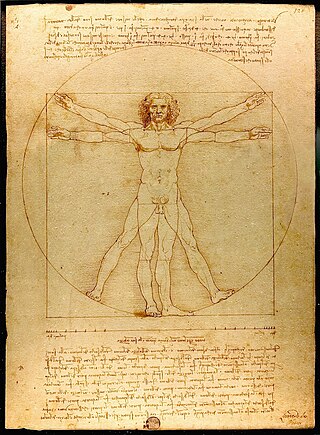
Drawing is a visual art that uses an instrument to mark paper or another two-dimensional surface. The instruments used to make a drawing are pencils, crayons, pens with inks, brushes with paints, or combinations of these, and in more modern times, computer styluses with graphics tablets or gamepads in VR drawing software.

Oil painting is a painting method involving the procedure of painting with pigments with a medium of drying oil as the binder. It has been the most common technique for artistic painting on canvas, wood panel or copper for several centuries, spreading from Europe to the rest of the world. The advantages of oil for painting images include "greater flexibility, richer and denser color, the use of layers, and a wider range from light to dark". But the process is slower, especially when one layer of paint needs to be allowed to dry before another is applied.

Technical drawing, drafting or drawing, is the act and discipline of composing drawings that visually communicate how something functions or is constructed.

A storyboard is a graphic organizer that consists of crude illustrations or images displayed in sequence for the purpose of pre-visualizing a motion picture, animation, motion graphic, or interactive media sequence. The storyboarding process, in the form it is known today, was developed at Walt Disney Productions during the early 1930s, after several years of similar processes being in use at Walt Disney and other animation studios.

An animator is an artist who creates images, known as frames, which give an illusion of movement called animation when displayed in rapid sequence. Animators can work in a variety of fields including film, television, and video games. Animation is closely related to filmmaking and like filmmaking is extremely labor-intensive, which means that most significant works require the collaboration of several animators. The methods of creating the images or frames for an animation piece depend on the animators' artistic styles and their field.

Graph drawing is an area of mathematics and computer science combining methods from geometric graph theory and information visualization to derive two-dimensional depictions of graphs arising from applications such as social network analysis, cartography, linguistics, and bioinformatics.

An illustrator is an artist who specializes in enhancing writing or elucidating concepts by providing a visual representation that corresponds to the content of the associated text or idea. The illustration may be intended to clarify complicated concepts or objects that are difficult to describe textually, which is the reason illustrations are often found in children's books.
Graphics are visual images or designs on some surface, such as a wall, canvas, screen, paper, or stone, to inform, illustrate, or entertain. In contemporary usage, it includes a pictorial representation of data, as in design and manufacture, in typesetting and the graphic arts, and in educational and recreational software. Images that are generated by a computer are called computer graphics.
A penciller is an artist who works on the creation of comic books, graphic novels, and similar visual art forms, with a focus on the initial pencil illustrations, usually in collaboration with other artists, who provide inks, colors and lettering in the book, under the supervision of an editor.

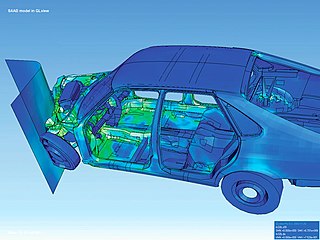
Scientific visualization is an interdisciplinary branch of science concerned with the visualization of scientific phenomena. It is also considered a subset of computer graphics, a branch of computer science. The purpose of scientific visualization is to graphically illustrate scientific data to enable scientists to understand, illustrate, and glean insight from their data. Research into how people read and misread various types of visualizations is helping to determine what types and features of visualizations are most understandable and effective in conveying information.

Visualization, also known as Graphics Visualization, is any technique for creating images, diagrams, or animations to communicate a message. Visualization through visual imagery has been an effective way to communicate both abstract and concrete ideas since the dawn of humanity. from history include cave paintings, Egyptian hieroglyphs, Greek geometry, and Leonardo da Vinci's revolutionary methods of technical drawing for engineering purposes that actively involve scientific requirements.

In information visualization and computing, treemapping is a method for displaying hierarchical data using nested figures, usually rectangles.

Gongbi is a careful realist technique in Chinese painting, the opposite of the interpretive and freely expressive xieyi style.

Graphic art software is a subclass of application software used for graphic design, multimedia development, stylized image development, technical illustration, general image editing, or simply to access graphic files. Art software uses either raster or vector graphic reading and editing methods to create, edit, and view art.
Resolution enhancement technologies are methods used to modify the photomasks in the lithographic processes used to make integrated circuits to compensate for limitations in the optical resolution of the projection systems. These processes allow the creation of features well beyond the limit that would normally apply due to the Rayleigh criterion. Modern technologies allow the creation of features on the order of 5 nanometers (nm), far below the normal resolution possible using deep ultraviolet (DUV) light.
Previsualization is the visualizing of scenes or sequences in a movie before filming. It is a concept used in other creative arts, including animation, performing arts, video game design, and still photography. Previsualization typically describes techniques like storyboarding, which uses hand-drawn or digitally-assisted sketches to plan or conceptualize movie scenes.

3D computer graphics, sometimes called CGI, 3-D-CGI or three-dimensional computer graphics, are graphics that use a three-dimensional representation of geometric data that is stored in the computer for the purposes of performing calculations and rendering digital images, usually 2D images but sometimes 3D images. The resulting images may be stored for viewing later or displayed in real time.

Martin M. Wattenberg is an American scientist and artist known for his work with data visualization. He is currently the Gordon McKay Professor of Computer Science at the Harvard University School of Engineering and Applied Sciences.

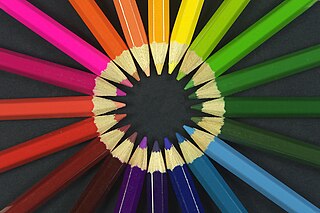
A colored pencil, coloured pencil, colour pencil, map pencil, pencil crayon, or coloured/colouring lead is an art medium constructed of a narrow, pigmented core encased in a wooden cylindrical case. Unlike graphite and charcoal pencils, colored pencils' cores are wax- or oil-based and contain varying proportions of pigments, additives, and binding agents. Water-soluble (watercolor) pencils and pastel pencils are also manufactured as well as colored cores for mechanical pencils.


