The Hubbert curve is an approximation of the production rate of a resource over time. It is a symmetric logistic distribution curve, often confused with the "normal" gaussian function. It first appeared in "Nuclear Energy and the Fossil Fuels," geologist M. King Hubbert's 1956 presentation to the American Petroleum Institute, as an idealized symmetric curve, during his tenure at the Shell Oil Company. It has gained a high degree of popularity in the scientific community for predicting the depletion of various natural resources. The curve is the main component of Hubbert peak theory, which has led to the rise of peak oil concerns. Basing his calculations on the peak of oil well discovery in 1948, Hubbert used his model in 1956 to create a curve which predicted that oil production in the contiguous United States would peak around 1970.

Resource depletion is the consumption of a resource faster than it can be replenished. Natural resources are commonly divided between renewable resources and non-renewable resources. The use of either of these forms of resources beyond their rate of replacement is considered to be resource depletion. The value of a resource is a direct result of its availability in nature and the cost of extracting the resource. The more a resource is depleted the more the value of the resource increases. There are several types of resource depletion, the most known being: Aquifer depletion, deforestation, mining for fossil fuels and minerals, pollution or contamination of resources, slash-and-burn agricultural practices, soil erosion, and overconsumption, excessive or unnecessary use of resources.

A non-renewable resource is a natural resource that cannot be readily replaced by natural means at a pace quick enough to keep up with consumption. An example is carbon-based fossil fuels. The original organic matter, with the aid of heat and pressure, becomes a fuel such as oil or gas. Earth minerals and metal ores, fossil fuels and groundwater in certain aquifers are all considered non-renewable resources, though individual elements are always conserved.

Marion King Hubbert was an American geologist and geophysicist. He worked at the Shell research lab in Houston, Texas. He made several important contributions to geology, geophysics, and petroleum geology, most notably the Hubbert curve and Hubbert peak theory, with important political ramifications. He was often referred to as "M. King Hubbert" or "King Hubbert".

The Hubbert peak theory says that for any given geographical area, from an individual oil-producing region to the planet as a whole, the rate of petroleum production tends to follow a bell-shaped curve. It is one of the primary theories on peak oil.

Hydrocarbon exploration is the search by petroleum geologists and geophysicists for deposits of hydrocarbons, particularly petroleum and natural gas, in the Earth's crust using petroleum geology.

Peak oil is the theorized point in time when the maximum rate of global oil production will occur, after which oil production will begin an irreversible decline. The primary concern of peak oil is that global transportation heavily relies upon the use of gasoline and diesel fuel. Switching transportation to electric vehicles, biofuels, or more fuel-efficient forms of travel may help reduce oil demand.
Oil depletion is the decline in oil production of a well, oil field, or geographic area. The Hubbert peak theory makes predictions of production rates based on prior discovery rates and anticipated production rates. Hubbert curves predict that the production curves of non-renewing resources approximate a bell curve. Thus, according to this theory, when the peak of production is passed, production rates enter an irreversible decline.
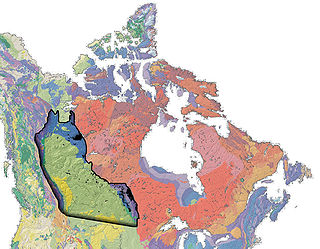
The Western Canadian Sedimentary Basin (WCSB) underlies 1.4 million square kilometres (540,000 sq mi) of Western Canada including southwestern Manitoba, southern Saskatchewan, Alberta, northeastern British Columbia and the southwest corner of the Northwest Territories. This vast sedimentary basin consists of a massive wedge of sedimentary rock extending from the Rocky Mountains in the west to the Canadian Shield in the east. This wedge is about 6 kilometres (3.7 mi) thick under the Rocky Mountains, but thins to zero at its eastern margins. The WCSB contains one of the world's largest reserves of petroleum and natural gas and supplies much of the North American market, producing more than 450 million cubic metres per day of gas in 2000. It also has huge reserves of coal. Of the provinces and territories within the WCSB, Alberta has most of the oil and gas reserves and almost all of the oil sands.
Jean H. Laherrère is a French petroleum engineer and consultant, best known as the co-author of an influential 1998 Scientific American article entitled The End of Cheap Oil.

The Hubbert linearization is a way to plot production data to estimate two important parameters of a Hubbert curve, the approximated production rate of a nonrenewable resource following a logistic distribution:

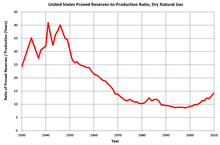
Proven reserves is a measure of fossil fuel energy reserves, such as oil and gas reserves and coal reserves. It is defined as the "[q]uantity of energy sources estimated with reasonable certainty, from the analysis of geologic and engineering data, to be recoverable from well established or known reservoirs with the existing equipment and under the existing operating conditions." A reserve is considered proven if it is probable that at least 90% of the resource is recoverable by economically profitable means.
Peak gas is the point in time when the maximum global natural gas production rate will be reached, after which the rate of production will enter its terminal decline. Although demand is peaking in the United States and Europe, it continues to rise globally due to consumers in Asia, especially China. Natural gas is a fossil fuel formed from plant matter over the course of millions of years. Natural gas derived from fossil fuels is a non-renewable energy source; however, methane can be renewable in other forms such as biogas. Peak coal was in 2013, and peak oil is forecast to occur before peak gas. One forecast is for natural gas demand to peak in 2035.
Peak coal is the peak consumption or production of coal by a human community. The peak of coal's share in the global energy mix was in 2008, when coal accounted for 30% of global energy production. Coal consumption is declining in the United States and Europe, as well as developed economies in Asia. However, consumption is still increasing in India and Southeast Asia, which compensates for the falls in other regions. Global coal consumption reached an all time high in 2023 at 8.5 billion tons. Peak coal can be driven by peak demand or peak supply. Historically, it was widely believed that the supply-side would eventually drive peak coal due to the depletion of coal reserves. However, since the increasing global efforts to limit climate change, peak coal in many countries has been driven by demand. This is due in large part to the rapid expansion of natural gas and renewable energy. Many countries have pledged to phase-out coal, despite estimates that project coal reserves to have the capacity to last for centuries at current consumption levels.

Peak oil is the point at which oil production, sometimes including unconventional oil sources, hits its maximum. Predicting the timing of peak oil involves estimation of future production from existing oil fields as well as future discoveries. The most influential production model is Hubbert peak theory, first proposed in the 1950s. The effect of peak oil on the world economy remains controversial.
As of 2017, Azerbaijan produced a range of metals and industrial minerals, including aluminum, bentonite, copper, gold, iodine, limestone, silver and steel.

Sustainability measurement is a set of frameworks or indicators to measure how sustainable something is. This includes processes, products, services and businesses. Sustainability is difficult to quantify. It may even be impossible to measure. To measure sustainability, the indicators consider environmental, social and economic domains. The metrics are still evolving. They include indicators, benchmarks and audits. They include sustainability standards and certification systems like Fairtrade and Organic. They also involve indices and accounting. And they can include assessment, appraisal and other reporting systems. These metrics are used over a wide range of spatial and temporal scales. Sustainability measures include corporate sustainability reporting, Triple Bottom Line accounting. They include estimates of the quality of sustainability governance for individual countries. These use the Environmental Sustainability Index and Environmental Performance Index. Some methods let us track sustainable development. These include the UN Human Development Index and ecological footprints.
Peak minerals marks the point in time when the largest production of a mineral will occur in an area, with production declining in subsequent years. While most mineral resources will not be exhausted in the near future, global extraction and production has become more challenging. Miners have found ways over time to extract deeper and lower grade ores with lower production costs. More than anything else, declining average ore grades are indicative of ongoing technological shifts that have enabled inclusion of more 'complex' processing – in social and environmental terms as well as economic – and structural changes in the minerals exploration industry and these have been accompanied by significant increases in identified Mineral Reserves.

Decline curve analysis is a means of predicting future oil well or gas well production based on past production history. Production decline curve analysis is a traditional means of identifying well production problems and predicting well performance and life based on measured oil well production. Before the availability of computers, decline curve analysis was performed by hand on semi-log plot paper. Currently, decline curve analysis software on PC computers is used to plot production decline curves for petroleum economics analysis.

Oil and gas reserves denote discovered quantities of crude oil and natural gas that can be profitably produced/recovered from an approved development. Oil and gas reserves tied to approved operational plans filed on the day of reserves reporting are also sensitive to fluctuating global market pricing. The remaining resource estimates are likely sub-commercial and may still be under appraisal with the potential to be technically recoverable once commercially established. Natural gas is frequently associated with oil directly and gas reserves are commonly quoted in barrels of oil equivalent (BoE). Consequently, both oil and gas reserves, as well as resource estimates, follow the same reporting guidelines, and are referred to collectively hereinafter as oil & gas.