Earth's natural oil supply is effectively fixed because petroleum is naturally formed far too slowly to be replaced at the rate at which it is being extracted. Over many millions of years, plankton, bacteria, and other plant and animal matter became buried in sediments on the ocean floor. When conditions were right—a lack of oxygen for decomposition, and sufficient depth and temperature of burial—these organic remains were converted into petroleum compounds, while the sediment accompanying them was converted into sandstone, siltstone, and other porous sedimentary rock. When capped by impermeable rocks such as shale, salt, or igneous intrusions, they formed the petroleum reservoirs which are exploited today.[2][3]
Production decline models
The Hubbert peak theory makes predictions of production rates based on prior discovery rates and anticipated production rates. Hubbert curves predict that the production curves of non-renewing resources approximate a bell curve. Thus, according to this theory, when the peak of production is passed, production rates enter an irreversible decline.[4][5]
For the short and medium-term, oil production decline occurs in a predictable manner based on geological circumstances, governmental policies, and engineering practices. The shape of the decline curve varies depending upon whether one considers a well, a field, or a set of fields. In the longer term, technological developments have defied some of the predictions.
Oil well production decline
Theoretical oil production curve for a well with exponential decline
An individual oil well usually produces at its maximum rate at the start of its life; the production rate eventually declines to a point at which it no longer produces profitable amounts. The shape of the decline curve depends on the oil reservoir and the reservoir drive mechanism. Wells in water-drive and gas-cap drive reservoirs often produce at a near constant rate until the encroaching water or expanding gas cap reaches the well, causing a sudden decline in oil production. Wells in gas solution drive and oil expansion drive reservoirs have exponential or hyperbolic declines: rapid declines at first, then leveling off.[6]
The shape of production curve of an oil well can also be affected by a number of nongeologic factors:
Well may be restricted by choice by lack of market demand or government regulation. This decreases the rate of decline, but will not change the well's total production significantly.
Hydraulic fracturing (fracking) or acidizing may be used to cause a sharp spike in production, and may increase the recoverable reserves of a given well.
The field may undergo a secondary or tertiary recovery project, discussed in the next section.
Oil field production decline
Individual oil wells are typically within multi-well oil fields. As with individual wells, the production curves for oil fields vary depending on geology and how they are developed and produced. Some fields have symmetric bell-shaped production profiles, but it is more common that the period of inclining production is briefer and steeper than the subsequent decline. More than half the production usually occurs after a field has reached a peak or plateau.[7] Production profiles of many fields show distinct peaks, but for giant oil fields, it is more common for production to reach and maintain a plateau before declining. Once a field declines, it usually follows an exponential decline.[8] As this decline levels off, production can continue at relatively low rates. A number of oil fields in the U.S. have been producing for over 100 years.[9][10]
Oil field production curves can be modified by a number of factors:
Production may be restricted by market conditions or government regulation.
A secondary recovery project, such as water or gas injection, can repressurize the field and increase the total recovery.
the field may undergo an enhanced oil recovery project, such as drilling of wells for injection of solvents, carbon dioxide, or steam. This allows more oil to be coaxed out of the rock, increasing the ultimate production of the field.
Multi-field production decline
Hubbert-theory graph of multiple oil field production
Most oil is found in a small number of very large oil fields. According to Hubbert peak theory, production starts off slowly, rises faster and faster, then slows down and flattens until it reaches a peak, after which production declines. In the late stage, production often enters a period of exponential decline in which the decline becomes less and less steep. Oil production may never actually reach zero, but eventually becomes very low. Factors which can modify this curve include:
Inadequate demand for oil, which reduces steepness of the curve and pushes its peak into the future.
Sharp price increases when the production peak is reached, as production fails to meet demand. If price increases cause a sharp drop in demand, a dip in the top of the curve may occur.
Development of new drilling technology or marketing of unconventional oil can reduce the steepness of the decline as more oil is produced than initially anticipated.
United States production
Oil production in the United States, provided one excludes Alaska, began by following the theoretical Hubbert curve for a few decades but is now deviating strongly from it. U.S. conventional oil extraction peaked in 1970; by the mid-2000s, it had fallen to 1940s levels. In 1950, the United States produced over half the world's oil, but by 2005, that proportion had dropped to about 8%. In 2005, U.S. crude oil imports peaked at twice as high as domestic production; since then, U.S. oil production has increased, and imports have fallen 41%.[11]
The conventional peak of oil extraction in 1970 was predicted by one of the two projections proposed by Hubbert in 1956. By 1972, all import quotas and controls on U.S. domestic production had been removed. Despite this, and the quadrupling of prices during the 1973 oil crisis, the production decline was not reversed in the lower 48 states until 2009. Crude oil production has since risen sharply from 2009 through 2014, so the rate of US oil production in October 2014 was 81% higher than the average rate in 2008.[12]
The actual U.S. production curve deviates from Hubbert's 1956 curve in significant ways:
When oil surpluses created a glut on the market and low prices began causing demand and production curves to rise, regulatory agencies such as the Texas Railroad Commission stepped in to restrain production.[2]
The curve peaked at a higher rate and sharper point than predicted.
Extraction for conventional oil fields fell after 1970, but started to recover and reached a lower secondary peak in 1988. This occurred because the supergiant Prudhoe Bay field in Alaska was only discovered in 1968, and the Trans-Alaska Pipeline System (TAPS) was not completed until 1977. After 1988, Alaska production peaked and total U.S. production began to decline again. By 2005, Prudhoe Bay had produced over 75% of its oil.
Production increases in the 2010s
Alaska oil production decline curve
Historical US crude oil production showing initial similarity to a Hubbert curve
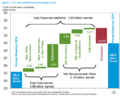
Individual oil well decline curve generated by decline curve analysis software, utilized in petroleum economics to indicate the depletion of oil & gas in a Petroleum reservoir. The Y axis is a log scale. Oil production (green line), and gas production (red line).
Although US proved oil reserves grew by 3.8 billion barrels in 2011, even after deducting 2.07 billion barrels of production, only 8 percent of the 5.84 billion barrels of the newly booked oil was due to new field discoveries (US EIA)
The 1970 extraction peak of conventional oil fields in the U.S. caused many people to begin to question when the world production peak would occur. The peak of world production is known as peak oil.
A peak in oil production could result in a worldwide oil shortage, or it could not even be noticed as demand decreases in conjunction with increased prices. While past shortages stemmed from a temporary insufficiency of supply, crossing Hubbert's Peak would mean that the production of oil would continue to decline, and that demand for these products must be reduced to meet supply. The effects of such a shortage would depend on the rate of decline and the development and adoption of effective alternatives.
Catastrophe
The use of fossil fuels allows humans to participate in takedown, which is the consumption of energy at a greater rate than it is being replaced. The industrial economy is currently heavily dependent on oil as a fuel and chemical feedstock. For example, over 90% of transportation in the United States relies on oil.[13]
Since the 1940s, agriculture has dramatically increased its productivity, due largely to the use of chemical pesticides, fertilizers, and increased mechanisation. This process has been called the Green Revolution. The increase in food production has allowed world population to grow dramatically over the last 50 years. Pesticides rely upon oil as a critical ingredient, and fertilizers require natural gas. Farm machinery also requires oil.
Most or all of the uses of fossil fuels in agriculture can be replaced with alternatives. For example, by far the biggest fossil fuel input to agriculture is the use of natural gas as a hydrogen source for the Haber-Bosch fertilizer-creation process.[14] Natural gas is used simply because it is the cheapest currently available source of hydrogen; were that to change, other sources, such as electrolysis powered by solar energy, could be used to provide the hydrogen for creating fertilizer.
Oil shortages may force a move to lower input "organic agriculture" methods, which may be more labor-intensive and require a population shift from urban to rural areas, reversing the trend towards urbanisation which has predominated in industrial societies; however, some organic farmers using modern organic-farming methods have reported yields as high as those available from conventional farming, but without the use of fossil-fuel-intensive artificial fertilizers or pesticides.[15][16][17][18]
Another possible effect would derive from modern transportation and housing infrastructure. A large proportion of the developed world's population live in suburbs, a type of low-density settlement designed with the automobile in mind. A movement to deal with this problem early, called "New Urbanism," seeks to develop the suburbs into higher density neighborhoods and use high density, mixed-use forms for new building projects.
Recession
A more modest scenario, assuming a slower rate of depletion or a smoother transition to alternative energy sources, could still cause substantial economic hardship such as a recession or depression due to higher energy prices.[citation needed]Inflation has also been linked to oil price spikes. However, economists disagree on the strength and causes of this association. See Energy crisis.
Rising oil prices cause rising food prices in three ways. First, increased equipment fuel costs drive higher prices. Second, transportation costs increase retail prices. Third, higher oil prices are causing farmers to switch from producing food crops to producing biofuel crops. [19][20]Supply and demand suggests if fewer farmers are producing food the price of food will rise.[21]
Replacement
An alternative considered likely by some is that oil will be replaced with renewable energy during the first half of the 21st century.[22] The replacement fuel would likely be hydrogen. A hydrogen economy would then replace the current oil-based economy. Another possible replacement fuel is biogas, which is composed of methane. Methane has a boiling point of −161°C, rather than hydrogen's -252.87°C, making methane a much easier fuel to condense.
Solar energy is a source of inexhaustible energy. There is more solar energy that reaches the surface of the Earth each hour than the amount of energy consumed by the world in a year.[23] The challenges of using the sun's energy – energy which can be obtained either from wind power or from solar power – is that the energy needs to either be (1) stored in physical form of fuel for when it can be used in the future, or (2) transported directly as electricity, through transmission lines. Neither is dispatchable, as there is no control over when the sun will shine or when the wind will blow. There are, however, concentrated solar power plants using thermal storage that can store energy efficiently for up to 24 hours.
Nuclear fusion could replace oil on a global and gradual scale; since the announcement of the first net energy gain in a nuclear fusion reaction by Lawrence Livermore National Laboratory on December 13, 2022,[24] a race to develop the nascent technology started, Microsoft was the first company to close a contract for the supply of energy from nuclear fusion with the company Helion Energy,[25] companies in the sector accumulate investments of US$ 5 billion, and although there is no energy production plant, the sector is confident, especially in recent years, of delivering abundant and cheaper energy by 2040, with some more optimists believing that it will be available by the end of the decade, the holy grail of energy can play a decisive role in the future of oil in the world and its aftermath decline as a source of energy for human activity.
Energy Export Databrowser - A visual review of production and consumption trends for individual nations; data from the British Petroleum Statistical Review.
This page is based on this Wikipedia article Text is available under the CC BY-SA 4.0 license; additional terms may apply. Images, videos and audio are available under their respective licenses.