1980s oil glut

Last updated

WTI oil prices 1983-2023 WTI oil prices.webp
WTI oil prices 1983–2023
Crude-oil-price-history-chart-2022.webp
Price of oil adjusted for inflation
Price of oil nominal price.webp
Price of oil (nominal)
West Texas Intermediate oil price history 1946–2022 [1]

The 1980s oil glut was a significant surplus of crude oil caused by falling demand following the 1970s energy crisis. The world price of oil had peaked in 1980 at over US$35 per barrel (equivalent to $124 per barrel in 2022 dollars, when adjusted for inflation); it fell in 1986 from $27 to below $10 ($72 to $27 in 2022 dollars). [2] [3] The glut began in the early 1980s as a result of slowed economic activity in industrial countries due to the crises of the 1970s, especially in 1973 and 1979, and the energy conservation spurred by high fuel prices. [4] The inflation-adjusted real 2004 dollar value of oil fell from an average of $78.2 in 1981 to an average of $26.8 per barrel in 1986. [5]

Contents

In June 1981, The New York Times proclaimed that an "oil glut" had arrived [6] and Time stated that "the world temporarily floats in a glut of oil". [7] However, The New York Times warned the next week that the word "glut" was misleading, and that temporary surpluses had brought down prices somewhat, but prices were still well above pre-energy crisis levels. [8] This sentiment was echoed in November 1981, when the CEO of Exxon also characterized the glut as a temporary surplus, and that the word "glut" was an example of "our American penchant for exaggerated language". He wrote that the main cause of the glut was declining consumption. In the United States, Europe, and Japan, oil consumption had fallen 13% from 1979 to 1981, "in part, in reaction to the very large increases in oil prices by the Organization of Petroleum Exporting Countries and other oil exporters", continuing a trend begun during the 1973 price increases. [9]

After 1980, reduced demand and increased production produced a glut on the world market. The result was a six-year decline in the price of oil, which reduced the price by half in 1986 alone. [2]

Production

OPEC, non-OPEC and world oil production, 1973-2004 Int oil2.gif
OPEC, non-OPEC and world oil production, 1973–2004

Non-OPEC

During the 1980s, reliance on Middle East production dwindled as commercial exploration developed major non-OPEC oilfields in Siberia, Alaska, the North Sea, and the Gulf of Mexico, [11] and the Soviet Union became the world's largest producer of oil. [12] Smaller non-OPEC producers including Brazil, Egypt, India, Malaysia, and Oman doubled their output between 1979 and 1985, to a total of 3 million barrels per day. [13]

United States

In April 1979, U.S. President Jimmy Carter signed an executive order to remove price controls from petroleum products by October 1981 so that prices would be wholly determined by the free market. Carter's successor, Ronald Reagan, signed an executive order on 28 January 1981, which enacted that reform immediately, [14] allowing the free market to adjust oil prices in the United States. [15] That ended the withdrawal of old oil from the market and artificial scarcity, which encouraged an increase in oil production.[ citation needed ] The U.S. oil windfall profits tax was lowered in August 1981 and removed in 1988, ending disincentives to U.S. oil producers.[ citation needed ]

Additionally, the Trans-Alaska Pipeline System began pumping oil in 1977. The Alaskan Prudhoe Bay Oil Field entered peak production, supplying 2 million bpd of crude oil in 1988, 25 percent of all U.S. oil production. [16]

North Sea

Phillips Petroleum discovered oil in the Chalk Group at Ekofisk, in Norwegian waters in the central North Sea. [17] Discoveries increased exponentially in the 1970s and 1980s, and new fields were developed throughout the continental shelf. [18]

OPEC

From 1980 to 1986, OPEC decreased oil production several times and nearly in half, in an attempt to maintain oil's high prices. However, it failed to hold on to its preeminent position, and by 1981, its production was surpassed by non-OPEC countries. [19] OPEC had seen its share of the world market drop to less than a third in 1985, from about half during the 1970s. [2] In February 1982, the Boston Globe reported that OPEC's production, which had previously peaked in 1977, was at its lowest level since 1969. Non-OPEC nations were at that time supplying most of the West's imports. [20]

OPEC's membership began to have divided opinions over what actions to take. In September 1985, Saudi Arabia became fed up with de facto propping up prices by lowering its own production in the face of high output from elsewhere in OPEC. [21] In 1985, daily output was around 3.5 million bpd, down from around 10 million in 1981. [21] During this period, OPEC members were supposed to meet production quotas in order to maintain price stability; however, many countries inflated their reserves to achieve higher quotas, cheated, or outright refused to accord with the quotas. [21] In 1985, the Saudis tired of this behavior and decided to punish the undisciplined OPEC countries. [21] The Saudis abandoned their role as swing producer and began producing at full capacity, creating a "huge surplus that angered many of their colleagues in OPEC". [22] High-cost oil production facilities became less or even not profitable. Oil prices as a result fell to as low as $7 per barrel. [21]

Kuwait oil production and exports.webp
Kuwait oil production and exports

Reduced demand

World energy consumption, 1965-2013, showing oil demand falling significantly in the early 1980s World energy consumption.svg
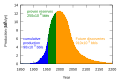
World energy consumption, 1965–2013, showing oil demand falling significantly in the early 1980s

OPEC had relied on the price inelasticity of demand of oil to maintain high consumption, but underestimated the extent to which other sources of supply would become profitable as prices increased. Electricity generation from coal, nuclear power and natural gas; [23] home heating from natural gas; and ethanol blended gasoline all reduced the demand for oil.[ citation needed ]

United States

New passenger car fuel economy in the United States rose from 17 miles per US gallon (14 L/100 km) in 1978 to more than 22 miles per US gallon (11 L/100 km) in 1982, an increase of more than 30 percent. [24]

The United States imported 28 percent of its oil in 1982 and 1983, down from 46.5 percent in 1977, due to lower consumption. [2]

Brazil

Impact

Fluctuations of OPEC net oil export revenues since 1972 Opecrev.gif
Fluctuations of OPEC net oil export revenues since 1972

The 1986 oil price collapse benefited oil-consuming countries such as the United States and Japan, countries in Europe, and developing nations but represented a serious loss in revenue for oil-producing countries in Northern Europe, the Soviet Union, and OPEC.[ citation needed ]

In 1981, before the brunt of the glut, Time Magazine wrote that in general, "A glut of crude causes tighter development budgets" in some oil-exporting nations. [7] Mexico had an economic and debt crisis in 1982. [27] The Venezuelan economy contracted and inflation levels (consumer price inflation) rose, remaining between 6 and 12% from 1982 to 1986. [28] [29] Even Saudi Arabian economic power was significantly weakened.[ citation needed ]

Iraq had fought a long and costly war against Iran and had particularly weak revenues. It was upset by Kuwait contributing to the glut [30] and allegedly pumping oil from the Rumaila field below their common border. [31] Iraq invaded Kuwait in 1990, planning to increase reserves and revenues and cancel the debt, resulting in the first Gulf War. [31]

The glut directed Algeria into an economic recession and directly influenced the politics: [32] the authoritarian regime of Chadli Bendjedid had to compromise with Islamic opposition in 1984 and start economic reforms dismantling socialism in 1987. After the 1988 October Riots he reformed the constitution twice, liberalized the political space amid growing discontent, and was ousted from office by the military after his party lost the first multi-party elections to Islamists.[ citation needed ]

The Soviet Union had become a major oil producer before the glut. The drop of oil prices contributed to the nation's final collapse. [33] [34]

In the United States, domestic exploration and the number of active drilling rigs were cut dramatically. In late 1985, there were nearly 2,300 rigs drilling wells; a year later, there were barely 1,000. [35] The number of U.S. petroleum producers decreased from 11,370 in 1985 to 5,231 in 1989, according to data from the Independent Petroleum Association of America. [36] Oil producers held back on the search for new oilfields for fear of losing on their investments. [37] In May 2007, companies like ExxonMobil were not making nearly the investment in finding new oil that they did in 1981. [38]

Canada responded to high energy prices in the 1970s with the National Energy Program (NEP) in 1980. The program was in place until 1985.[ citation needed ]

See also

Related Research Articles

<span class="mw-page-title-main">Petroleum</span> Naturally occurring flammable liquid

Petroleum, also known as crude oil, or simply oil, is a naturally occurring yellowish-black liquid mixture of mainly hydrocarbons, and is found in geological formations. The name petroleum covers both naturally occurring unprocessed crude oil and petroleum products that consist of refined crude oil.

<span class="mw-page-title-main">OPEC</span> Intergovernmental oil organization

The Organization of the Petroleum Exporting Countries is an organization enabling the co-operation of leading oil-producing countries in order to collectively influence the global oil market and maximize profit. It was founded on 14 September 1960 in Baghdad by the first five members. The 12 member countries account for an estimated 30 percent of global oil production.

<span class="mw-page-title-main">1979 oil crisis</span> Worldwide increase in crude oil prices following the Iranian Revolution

A drop in oil production in the wake of the Iranian Revolution led to an energy crisis in 1979. Although the global oil supply only decreased by approximately four percent, the oil markets' reaction raised the price of crude oil drastically over the next 12 months, more than doubling it to $39.50 per barrel ($248/m3). The sudden increase in price was connected with fuel shortages and long lines at gas stations similar to the 1973 oil crisis.

The National Energy Program was an energy policy of the Canadian federal government from 1980 to 1985. The economically nationalist policy sought to secure Canadian energy independence, though was strongly opposed by the private sector and the oil-producing Western Canadian provinces, most notably Alberta.

<span class="mw-page-title-main">2000s energy crisis</span> Sixfold rise in oil prices, peaking in 2008

From the mid-1980s to September 2003, the inflation-adjusted price of a barrel of crude oil on NYMEX was generally under US$25/barrel in 2008 dollars. During 2003, the price rose above $30, reached $60 by 11 August 2005, and peaked at $147.30 in July 2008. Commentators attributed these price increases to many factors, including Middle East tension, soaring demand from China, the falling value of the U.S. dollar, reports showing a decline in petroleum reserves, worries over peak oil, and financial speculation.

<span class="mw-page-title-main">Ahmed Zaki Yamani</span> Saudi Arabian politician (1930–2021)

Ahmed Zaki Yamani was a Saudi Arabian politician who served as Minister of Petroleum and Mineral Resources under four Saudi monarchs from 1962 to 1986, and a minister in the Organization of the Petroleum Exporting Countries (OPEC) for 25 years.

<span class="mw-page-title-main">Price of oil</span> Spot price of a barrel of benchmark crude oil

The price of oil, or the oil price, generally refers to the spot price of a barrel of benchmark crude oil—a reference price for buyers and sellers of crude oil such as West Texas Intermediate (WTI), Brent Crude, Dubai Crude, OPEC Reference Basket, Tapis crude, Bonny Light, Urals oil, Isthmus, and Western Canadian Select (WCS). Oil prices are determined by global supply and demand, rather than any country's domestic production level.

For further details see the "Energy crisis" series by Facts on File.

<span class="mw-page-title-main">Petroleum in the United States</span>

Petroleum has been a major industry in the United States since shortly after the oil discovery in the Oil Creek area of Titusville, Pennsylvania, in 1859. The industry includes exploration, production, processing (refining), transportation, and marketing of natural gas and petroleum products. In 2018, the U.S. became the world's largest crude oil producer, producing 15% of global crude oil, surpassing Russia and Saudi Arabia. The leading oil-producing area in the United States in 2019 was Texas, followed by the offshore federal zone of the Gulf of Mexico, North Dakota and New Mexico. In 2020, the top five U.S. oil-producing states were Texas (43%), North Dakota (10.4%), New Mexico (9.2%), Oklahoma (4.1%), and Colorado (4.0%).

<span class="mw-page-title-main">Oil reserves in Saudi Arabia</span> Oil reserves located in Saudi Arabia

The proven oil reserves in Saudi Arabia are reportedly the second largest in the world, estimated in 2017 to be 268 billion barrels, including 2.5 Gbbl in the Saudi–Kuwaiti neutral zone. This would correspond to more than 50 years of production at current rates. In the oil industry, an oil barrel is defined as 42 US gallons, which is about 159 litres, or 35 imperial gallons. The oil reserves are predominantly found in the Eastern Province. These reserves were apparently the largest in the world until Venezuela announced they had increased their proven reserves to 297 Gbbl in January 2011. The Saudi reserves are about one-fifth of the world's total conventional oil reserves. A large fraction of these reserves comes from a small number of very large oil fields, and past production amounts to 40% of the stated reserves. Other sources state that Saudi Arabia has about 297.7 billion barrels.

<span class="mw-page-title-main">World oil market chronology from 2003</span> Chronology of events affecting the oil market

From the mid-1980s to September 2003, the inflation adjusted price of a barrel of crude oil on NYMEX was generally under $25/barrel. Then, during 2004, the price rose above $40, and then $60. A series of events led the price to exceed $60 by August 11, 2005, leading to a record-speed hike that reached $75 by the middle of 2006. Prices then dropped back to $60/barrel by the early part of 2007 before rising steeply again to $92/barrel by October 2007, and $99.29/barrel for December futures in New York on November 21, 2007. Throughout the first half of 2008, oil regularly reached record high prices. Prices on June 27, 2008, touched $141.71/barrel, for August delivery in the New York Mercantile Exchange, amid Libya's threat to cut output, and OPEC's president predicted prices may reach $170 by the Northern summer. The highest recorded price per barrel maximum of $147.02 was reached on July 11, 2008. After falling below $100 in the late summer of 2008, prices rose again in late September. On September 22, oil rose over $25 to $130 before settling again to $120.92, marking a record one-day gain of $16.37. Electronic crude oil trading was temporarily halted by NYMEX when the daily price rise limit of $10 was reached, but the limit was reset seconds later and trading resumed. By October 16, prices had fallen again to below $70, and on November 6 oil closed below $60. Then in 2009, prices went slightly higher, although not to the extent of the 2005–2007 crisis, exceeding $100 in 2011 and most of 2012. Since late 2013 the oil price has fallen below the $100 mark, plummeting below the $50 mark one year later.

Sources include: Dow Jones (DJ), New York Times (NYT), Wall Street Journal (WSJ), and the Washington Post (WP).

<span class="mw-page-title-main">1970s energy crisis</span> Subclass of energy crisis

The 1970s energy crisis occurred when the Western world, particularly the United States, Canada, Western Europe, Australia, and New Zealand, faced substantial petroleum shortages as well as elevated prices. The two worst crises of this period were the 1973 oil crisis and the 1979 energy crisis, when, respectively, the Yom Kippur War and the Iranian Revolution triggered interruptions in Middle Eastern oil exports.

<span class="mw-page-title-main">2010s oil glut</span> Oversupply of oil in the 2010s

The 2010s oil glut was a significant surplus of crude oil that started in 2014–2015 and accelerated in 2016, with multiple causes. They include general oversupply as unconventional US and Canadian tight oil production reached critical volumes, geopolitical rivalries among oil-producing nations, falling demand across commodities markets due to the deceleration of the Chinese economy, and possible restraint of long-term demand as environmental policy promotes fuel efficiency and steers an increasing share of energy consumption away from fossil fuels.

The posted price of oil was the price at which oil companies offered to purchase oil from oil-producing governments. This price was set by the oil companies and used to calculate the share of oil revenues that oil-producing countries would receive. Between 1957 and 1972, the posted price was greater than the market price of crude oil. Between 1961 and 1970 the market price hovered between $1.30 and $1.50 per barrel, while the posted price was a constant $1.80.

<span class="mw-page-title-main">2020 Russia–Saudi Arabia oil price war</span> 2020 oil price war between Russia and Saudi Arabia

On 8 March 2020, Saudi Arabia initiated a price war on oil with Russia, which facilitated a 65% quarterly fall in the price of oil. The price war was triggered by a break-up in dialogue between the Organization of the Petroleum Exporting Countries (OPEC) and Russia over proposed oil-production cuts in the midst of the COVID-19 pandemic. Russia walked out of the agreement, leading to the fall of the OPEC+ alliance.

References

  1. "Crude Oil Prices – 70 Year Historical Chart". MacroTrends. Retrieved 25 May 2022.
  2. 1 2 3 4 Hershey Jr., Robert D. (30 December 1989). "Worrying Anew Over Oil Imports". The New York Times. Retrieved 30 December 2015.
  3. Mouawad, Jad (8 March 2008). "Oil Prices Pass Record Set in '80s, but Then Recede". The New York Times. Retrieved 20 April 2010.
  4. "Oil Glut, Price Cuts: How Long Will They Last?". U.S. News & World Report . Vol. 89, no. 7. 18 August 1980. p. 44.
  5. Oak Ridge National Lab data [ dead link ]
  6. Hershey Jr., Robert D. (21 June 1981). "How the Oil Glut Is Changing Business". The New York Times. Retrieved 30 December 2015.
  7. 1 2 Byron, Christopher (22 June 1981). "Problems for Oil Producers". Time. Archived from the original on 5 January 2013. Retrieved 19 January 2008.
  8. Yergin, Daniel (28 June 1981). "The Energy Outlook; Lulled to Sleep by the Oil Glut Mirage". The New York Times.
  9. Garvin, C. C. Jr. (9 November 1981). "The Oil Glut in Perspective". Oil & Gas Journal. Annual API Issue: 151.
  10. EIA – International Energy Data and Analysis
  11. Bromley, Simon (2013). American Power and the Prospects for International Order. John Wiley & Sons. p. 95. ISBN   978-0-7456-5841-4.
  12. "World: Saudis Edge U.S. on Oil". Washington Post, 3 January 1980, p. D2.
  13. Gately, Dermot (1986). "Lessons from the 1986 Oil Price Collapsey" (PDF). Brookings Papers on Economic Activity (2): 239. Archived from the original (PDF) on 9 May 2016. Retrieved 19 January 2016.
  14. "Executive Order 12287 – Decontrol of Crude Oil and Refined Petroleum Products". 28 January 1981. Retrieved 27 January 2019.
  15. Weiner, Edward (1999). Urban Transportation Planning in the United States An Historical Overview. Greenwood Publishing Group. p. 112. ISBN   978-0-275-96329-3 . Retrieved 7 June 2010. By September 30, 1981, petroleum prices were to be determined by the free market. This process was accelerated by President Reagan through an Executive Order
  16. National Energy Technology Laboratory. "Fossil Energy – Alaska Oil History," Arctic Energy Office. Accessed 29 July 2009. "NETL: Arctic Energy Office – Fossil Energy – Alaska Oil History". Archived from the original on 25 April 2009. Retrieved 29 July 2009.{{cite web}}: CS1 maint: bot: original URL status unknown (link)
  17. Ferrier, RW; Bamberg, JH (1982). The History of the British Petroleum Company. Cambridge University Press. pp. 201–203. ISBN   978-0-521-78515-0.
  18. Swartz, Kenneth I. (16 April 2015). "Setting the Standard". Vertical Magazine. Archived from the original on 18 April 2015. Retrieved 18 April 2015.
  19. Denning, Liam (1 June 2016). "How OPEC Won the Battle and Lost the War". Bloomberg News. Archived from the original on 22 February 2017. Retrieved 1 November 2022.
  20. Warsh, David (28 February 1982). "The economy: the Oil Glut deepens; OPEC's grip loosens; but a boom or a bomb could spur prices back up". The Boston Globe.
  21. 1 2 3 4 5 Yergin, Daniel (1991). The Prize: The Epic Quest for Oil, Money, and Power. Simon & Schuster. ISBN   0-671-50248-4.
  22. Koepp, Stephen (14 April 1986). "Cheap Oil!". Time. Archived from the original on 11 January 2013. Retrieved 19 January 2008.
  23. Toth, Ferenc L.; Rogner, Hans-Holger (January 2006). "Oil and nuclear power: Past, present, and future" (PDF). Energy Economics. 28 (1): 3. doi:10.1016/j.eneco.2005.03.004. Archived (PDF) from the original on 3 December 2007. Retrieved 4 January 2008.
  24. Portney, Paul R.; Parry, Ian W.H.; Gruenspecht, Howard K.; Harrington, Winston (November 2003). "The Economics of Fuel Economy Standards". Resources for the Future. Archived from the original on 1 December 2007. Retrieved 4 January 2008.
  25. "OPEC Revenues Fact Sheet". US Energy Information Administration. 10 January 2006. Archived from the original on 7 January 2008.
  26. "OPEC Revenues Fact Sheet". U.S. Energy Information Administration. 14 June 2016. Retrieved 25 August 2016.
  27. Ruiz, Ramón Eduardo (2010). Mexico: Why a Few are Rich and the People Poor. Berkeley, Los Angeles, London: University of California Press. p. 165. ISBN   978-0-520-26235-5.
  28. Heritage, Andrew (2002). Financial Times World Desk Reference. Dorling Kindersley. pp. 618–621. ISBN   978-0-7894-8805-3.
  29. "Venezuela Inflation rate (consumer prices)". Indexmundi. 2010. Retrieved 16 August 2010.
  30. Thornton, Ted (12 January 2007). "The Gulf Wars: Iraq Occupies Kuwait". Northfield Mount Hermon School. Archived from the original on 17 December 2007. Retrieved 14 January 2008.
  31. 1 2 Rousseau, David L. (1998). "History of OPEC" (PDF). University of Pennsylvania. Archived from the original (PDF) on 27 February 2008. Retrieved 12 January 2008.
  32. "A political economy of low oil prices in Algeria".
  33. Gaidar, Yegor (April 2007). "The Soviet Collapse: Grain and Oil" (PDF). American Enterprise Institute. Oil production in Saudi Arabia increased fourfold, while oil prices collapsed by approximately the same amount in real terms. As a result, the Soviet Union lost approximately $20 billion per year, money without which the country simply could not survive.
  34. McMaken, Ryan (7 November 2014). "The Economics Behind the Fall of the Berlin Wall". Mises Institute. High oil prices in the 1970s propped up the regime so well, that had it not been for Soviet oil sales, it's quite possible the regime would have collapsed a decade earlier.
  35. Gold, Russell (13 January 2015). "Back to the Future? Oil Replays 1980s Bust". The Wall Street Journal. Retrieved 16 January 2016.[ permanent dead link ]
  36. Penty, Rebecca; Shauk, Zain (21 January 2015). "Crude Collapse Has Investors Braced for '80s-Like Oil Casualties". Bloomberg. Retrieved 16 January 2016.
  37. "Oil, Oil Everywhere". Forbes. 24 July 2006. Archived from the original on 8 January 2008. Retrieved 6 January 2008.
  38. Fox, Justin (31 May 2007). "No More Gushers for ExxonMobil". Time. Archived from the original on 13 January 2008. Retrieved 8 January 2008.

Further reading