Tasmanian state election, 3 June 1925 [1] Contents | ||||||
---|---|---|---|---|---|---|
Enrolled voters | 114,901 | |||||
Votes cast | 77,281 | Turnout | 67.26% | +4.16% | ||
Informal votes | 1,714 | Informal | 2.22% | -0.41% | ||
Summary of votes by party | ||||||
Party | Primary votes | % | Swing | Seats | Change | |
Labor | 36,631 | 48.47% | +11.73% | 16 | + 4 | |
Nationalist | 21,932 | 29.02% | –11.93% | 7 | – 5 | |
Liberal (Lee) | 7,815 | 10.34% | +10.34% | 4 | + 4 | |
Independent Labor TAS | 2,604 | 3.45% | +2.14% | 0 | ± 0 | |
Independent | 6,585 | 8.71% | +1.70% | 3 | + 2 | |
Others | –13.98% | 0 | – 5 | |||
Total | 75,567 | 30 |
This is a list of House of Assembly results for the 1925 Tasmanian election.
Party | Candidate | Votes | % | ±% | |
---|---|---|---|---|---|
Quota | 2,133 | ||||
Labor | Allan Guy (elected 1) | 3,206 | 21.5 | +7.7 | |
Labor | George Becker (elected 2) | 1,665 | 11.2 | −1.8 | |
Labor | Victor Shaw (elected 5) | 1,269 | 8.5 | +3.2 | |
Labor | Harold Holmes | 428 | 2.9 | +2.9 | |
Liberal | Claude James (elected 3) | 2,008 | 13.4 | +13.4 | |
Liberal | James Newton (elected 4) | 1,286 | 8.6 | −3.0 | |
Liberal | Leslie Procter | 633 | 4.2 | +4.2 | |
Liberal | Robert Coplestone | 202 | 1.4 | +1.4 | |
Liberal | William Rose | 159 | 1.1 | +1.1 | |
Liberal | Luke Bryant | 42 | 0.3 | +0.3 | |
Nationalist | Henry Thomson (elected 6) | 1,032 | 6.9 | −1.2 | |
Nationalist | Robert Murphy | 597 | 4.0 | −2.1 | |
Nationalist | George Pullen | 289 | 1.9 | +1.9 | |
Nationalist | George Shields | 286 | 1.9 | +1.9 | |
Nationalist | James Sullivan | 61 | 0.4 | +0.4 | |
Independent Labor | Jens Jensen | 1,319 | 8.8 | +0.5 | |
Independent | Alexander Marshall | 448 | 3.0 | −5.4 | |
Total formal votes | 14,930 | 98.2 | +0.3 | ||
Informal votes | 277 | 1.8 | −0.3 | ||
Turnout | 15,207 | 68.0 | +6.7 | ||
Party total votes | |||||
Labor | 6,568 | 44.0 | +4.5 | ||
Liberal | 4,330 | 29.0 | +29.0 | ||
Nationalist | 2,265 | 15.2 | −30.9 | ||
Independent Labor | Jens Jensen | 1,319 | 8.8 | +0.5 | |
Independent | Alexander Marshall | 448 | 3.0 | +3.0 |
Party | Candidate | Votes | % | ±% | |
---|---|---|---|---|---|
Quota | 2,261 | ||||
Labor | James Belton (elected 1) | 2,790 | 17.6 | +6.9 | |
Labor | Philip Kelly (elected 2) | 2,585 | 16.3 | +9.4 | |
Labor | James Hurst (elected 4) | 1,354 | 8.6 | +1.3 | |
Labor | Henry Lane | 780 | 4.9 | +4.9 | |
Labor | Eliza Burnell | 348 | 2.2 | +2.2 | |
Labor | William Treanor | 291 | 1.8 | +1.8 | |
Nationalist | Frank Marriott (elected 3) | 1,856 | 11.7 | +2.7 | |
Nationalist | Henry McFie (elected 6) | 1,367 | 8.6 | +8.6 | |
Nationalist | Hubert Nichols | 1,059 | 6.7 | +6.7 | |
Nationalist | Herbert Vertigan | 565 | 3.6 | +3.6 | |
Nationalist | Harold Ireland | 396 | 2.5 | +2.5 | |
Nationalist | David Jones | 383 | 2.4 | +2.4 | |
Liberal | Edward Hobbs (elected 5) | 1,366 | 8.6 | 0.0 | |
Liberal | James Charleston | 684 | 4.3 | +4.3 | |
Total formal votes | 15,824 | 97.5 | +0.1 | ||
Informal votes | 408 | 2.5 | −0.1 | ||
Turnout | 16,232 | 70.5 | +7.5 | ||
Party total votes | |||||
Labor | 8,148 | 51.5 | +8.0 | ||
Nationalist | 5,626 | 35.6 | +7.0 | ||
Liberal | 2,050 | 13.0 | +13.0 |
Party | Candidate | Votes | % | ±% | |
---|---|---|---|---|---|
Quota | 2,381 | ||||
Labor | Charles Culley (elected 2) | 1,835 | 11.0 | +2.0 | |
Labor | Robert Cosgrove (elected 3) | 1,612 | 9.7 | +2.1 | |
Labor | Walter Woods (elected 4) | 1,490 | 8.9 | +8.9 | |
Labor | John Cleary (elected 6) | 1,208 | 7.3 | −6.4 | |
Labor | Enid Lyons | 998 | 6.0 | +6.0 | |
Labor | Eric Ogilvie | 922 | 5.5 | +5.5 | |
Labor | Charles Metz | 167 | 1.0 | +1.0 | |
Nationalist | John Soundy (elected 1) | 1,989 | 11.9 | +11.9 | |
Nationalist | Charles Grant | 1,524 | 9.1 | +0.3 | |
Nationalist | John McPhee (elected 5) | 1,436 | 8.6 | −5.4 | |
Nationalist | Leslie Payne | 994 | 6.0 | +3.3 | |
Nationalist | Frederick Wilson | 276 | 1.7 | +1.7 | |
Nationalist | William Jarvis | 258 | 1.5 | +1.5 | |
Nationalist | William Hammond | 205 | 1.2 | +1.2 | |
Independent Labor | Gerald Mahoney | 1,285 | 7.7 | +7.7 | |
Independent | Edith Waterworth | 462 | 2.8 | −3.7 | |
Total formal votes | 16,661 | 97.9 | +0.5 | ||
Informal votes | 360 | 2.1 | −0.5 | ||
Turnout | 17,021 | 69.0 | +2.8 | ||
Party total votes | |||||
Labor | 8,232 | 49.4 | +9.7 | ||
Nationalist | 6,682 | 40.1 | −12.3 | ||
Independent Labor | Gerald Mahoney | 1,285 | 7.7 | +7.7 | |
Independent | Edith Waterworth | 462 | 2.8 | −3.7 |
Party | Candidate | Votes | % | ±% | |
---|---|---|---|---|---|
Quota | 2,096 | ||||
Labor | Albert Ogilvie (elected 1) | 4,130 | 28.2 | +14.6 | |
Labor | William Sheridan (elected 3) | 992 | 6.8 | +6.8 | |
Labor | Benjamin Watkins (elected 4) | 760 | 5.2 | +1.1 | |
Labor | Samuel Lyden | 574 | 3.9 | +3.9 | |
Labor | John Lewis | 514 | 3.5 | +3.5 | |
Labor | Douglas Thompson | 247 | 1.7 | +1.7 | |
Labor | Winston Triffitt | 244 | 1.7 | +1.7 | |
Nationalist | John Evans (elected 2) | 2,187 | 14.9 | +3.3 | |
Nationalist | George Cummins | 1,270 | 8.7 | +0.6 | |
Nationalist | Richard Johnson | 297 | 2.0 | +2.0 | |
Independent | Peter Murdoch (elected 5) | 1,277 | 8.7 | +1.6 | |
Independent | John Piggott (elected 6) | 1,100 | 7.5 | −1.4 | |
Independent | Benjamin Pearsall | 1,076 | 7.3 | +1.8 | |
Total formal votes | 14,668 | 97.7 | +0.6 | ||
Informal votes | 338 | 2.3 | −0.6 | ||
Turnout | 15,006 | 63.9 | +3.0 | ||
Party total votes | |||||
Labor | 7,461 | 50.9 | +18.7 | ||
Nationalist | 3,754 | 25.6 | −12.5 | ||
Independent | Peter Murdoch | 1,277 | 8.7 | +8.7 | |
Independent | John Piggott | 1,100 | 7.5 | +7.5 | |
Independent | Benjamin Pearsall | 1,076 | 7.3 | +7.3 |
Party | Candidate | Votes | % | ±% | |
---|---|---|---|---|---|
Quota | 1,927 | ||||
Labor | Joseph Lyons (elected 1) | 4,125 | 30.6 | +12.9 | |
Labor | Michael O'Keefe (elected 2) | 1,037 | 7.7 | −0.1 | |
Labor | Herbert Osborne | 328 | 2.4 | +2.4 | |
Labor | William Shoobridge (elected 5) | 283 | 2.1 | +2.1 | |
Labor | Will Reece | 252 | 1.9 | +1.9 | |
Labor | John Palamountain | 197 | 1.5 | +1.5 | |
Nationalist | Neil Campbell (elected 3) | 1,499 | 11.1 | +3.4 | |
Nationalist | Percy Best | 828 | 6.1 | +6.1 | |
Nationalist | Albert Bendall | 700 | 5.2 | +5.2 | |
Nationalist | Ernest Blyth | 578 | 4.3 | +4.3 | |
Independent | Norman Cameron (elected 4) | 1,511 | 11.2 | +2.8 | |
Liberal | Walter Lee (elected 6) | 1,325 | 9.8 | −2.6 | |
Liberal | John Peters | 110 | 0.8 | +0.8 | |
Independent | John Newman | 711 | 5.3 | +5.3 | |
Total formal votes | 13,484 | 97.6 | +0.8 | ||
Informal votes | 331 | 2.4 | −0.8 | ||
Turnout | 13,815 | 64.6 | +1.1 | ||
Party total votes | |||||
Labor | 6,222 | 46.1 | +18.7 | ||
Nationalist | 3,605 | 26.7 | −11.6 | ||
Independent | Norman Cameron | 1,511 | 11.2 | +2.8 | |
Liberal | 1,435 | 10.6 | +10.6 | ||
Independent | John Newman | 711 | 5.3 | +5.3 |
The House of Assembly, or Lower House, is one of the two chambers of the Parliament of Tasmania in Australia. The other is the Legislative Council or Upper House. It sits in Parliament House in the state capital, Hobart.
The Parliament of Tasmania is the bicameral legislature of the Australian state of Tasmania. It follows a Westminster-derived parliamentary system and consists of the governor of Tasmania, the Legislative Council, and the House of Assembly. Since 1841, the Legislative Council has met in Parliament House, Hobart, with the House of Assembly following suit from its establishment in 1856. The Parliament of Tasmania first met in 1856.
Sir John Cameron McPhee, KCMG was an Australian politician and member of the Tasmanian House of Assembly. He was Premier of Tasmania from 15 June 1928 to 15 March 1934.
Donald Norman Cameron was an Australian politician. He served in the House of Representatives and Tasmanian House of Assembly.
James Ernest Ogden was an Australian politician who was elected to the Tasmanian House of Assembly and the Australian Senate.
The 1979 Tasmanian state election was held on 28 July 1979 in the Australian state of Tasmania to elect 35 members of the Tasmanian House of Assembly. The election used the Hare-Clark proportional representation system — seven members were elected from each of five electorates. The quota required for election was 12.5% in each division.
The 1912 Tasmanian state election was held on Tuesday, 30 April 1912 in the Australian state of Tasmania to elect 30 members of the Tasmanian House of Assembly. The election used the Hare-Clark proportional representation system — six members were elected from each of five electorates.
The 1916 Tasmanian state election was held on Saturday, 25 March 1916 in the Australian state of Tasmania to elect 30 members of the Tasmanian House of Assembly. The election used the Hare-Clark proportional representation system — six members were elected from each of five electorates.
The 1922 Tasmanian state election was held on 10 June 1922 in the Australian state of Tasmania to elect 30 members of the Tasmanian House of Assembly. The election used the Hare-Clark proportional representation system — six members were elected from each of five electorates.
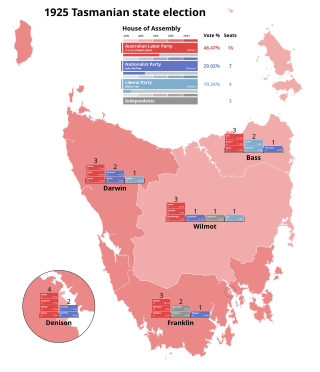
The 1925 Tasmanian state election was held on Wednesday, 3 June 1925 in the Australian state of Tasmania to elect 30 members of the Tasmanian House of Assembly. The election used the Hare-Clark proportional representation system — six members were elected from each of five electorates.
The 1928 Tasmanian state election was held on Wednesday, 30 May 1928 in the Australian state of Tasmania to elect 30 members of the Tasmanian House of Assembly. The election used the Hare-Clark proportional representation system — six members were elected from each of five electorates.
The 1950 Tasmanian state election was held on 6 May 1950 in the Australian state of Tasmania to elect 30 members of the Tasmanian House of Assembly. The election used the Hare-Clark proportional representation system — six members were elected from each of five electorates.
The 1955 Tasmanian state election was held on 19 February 1955 in the Australian state of Tasmania to elect 30 members of the Tasmanian House of Assembly. The election used the Hare-Clark proportional representation system — six members were elected from each of five electorates.
The 1956 Tasmanian state election was held on 13 October 1956 in the Australian state of Tasmania to elect 30 members of the Tasmanian House of Assembly. The election used the Hare-Clark proportional representation system — six members were elected from each of five electorates.
The 1959 Tasmanian state election was held on 2 May 1959 in the Australian state of Tasmania to elect 35 members of the Tasmanian House of Assembly. The number of members were increased from this election from 30 to 35. The election used the Hare-Clark proportional representation system — seven members were elected from each of five electorates.
The 1964 Tasmanian state election was held on 2 May 1964 in the Australian state of Tasmania to elect 35 members of the Tasmanian House of Assembly. The election used the Hare-Clark proportional representation system — seven members were elected from each of five electorates.
This is a list of members of the Tasmanian Legislative Council between 1921 and 1927. Terms of the Legislative Council did not coincide with Legislative Assembly elections, and members served six year terms, with a number of members facing election each year.
The 1925 Tasmanian state election was held on 3 June 1925. Since the last election, the Nationalist Party had split, with some supporting former leader Sir Walter Lee's "Liberal" grouping. The Tasmanian branch of the Country Party had also ceased to exist, with its members scattering to the Nationalists, Liberals or independents.
This is a list of House of Assembly results for the 1922 Tasmanian election.

The Tasmanian Nationals are a political party in the Australian state of Tasmania, aligned with the National Party of Australia. The party is not currently registered with the Tasmanian Electoral Commission, and is not separately registered with the Australian Electoral Commission, unlike the other state branches of the Nationals.