Results of the 1976 Tasmanian state election

Last updated

Tasmanian state election, 11 December 1976 [1]
House of Assembly
<< 19721979 >>

Contents

Enrolled voters258,550
Votes cast244,424 Turnout 94.54–0.37
Informal votes9,294Informal3.80+0.14
Summary of votes by party
PartyPrimary votes %SwingSeatsChange
  Labor 123,38652.48–2.4518– 3
  Liberal 104,61344.49+6.1217+ 3
  United Tasmania Group 5,1832.20–1.700± 0
  Workers Party 5240.22+0.220± 0
  Socialist Workers Party 1230.05+0.050± 0
  Independent 1,4240.61–2.190± 0
Total235,130  35 

This is a list of House of Assembly results for the 1976 Tasmanian election.

Results by division

Bass

1976 Tasmanian state election: Bass
PartyCandidateVotes%±%
Quota 5,431
Liberal Bill Beattie (elected 4)3,8248.8-6.8
Liberal Jim Mooney (elected 7)3,0006.9+6.9
Liberal Max Bushby (elected 5)2,9486.8+1.1
Liberal Neil Robson (elected 6)2,8706.6+6.6
Liberal Dawn Rhodes2,1094.9+4.9
Liberal Neil Pitt 2,0684.8-4.9
Liberal Dick Archer 1,9644.5+4.5
Liberal John Beswick 1,9314.4+4.4
Liberal William Luck6461.5+1.5
Labor Michael Barnard (elected 1)8,40119.3+0.6
Labor Gill James (elected 3)3,9439.1+9.1
Labor Harry Holgate (elected 2)3,4718.0+3.6
Labor David Farquhar 1,5333.5-0.7
Labor Ursula Workman1,3733.6+3.6
Labor Thomas O'Byrne1,1932.7+2.7
Labor John Breen8692.0+2.0
Labor Myron Tripp3970.9+0.9
United Tasmania Bob Brown 4141.0+1.0
United Tasmania Deidre Smith2550.6+0.6
United Tasmania Noreen Batchelor950.2+0.2
Independent Quentin Wilson1430.3+0.3
Total formal votes43,44795.8−0.2
Informal votes1,8864.2+0.2
Turnout 45,33394.3−0.5
Party total votes
Liberal 21,36049.2+6.3
Labor 21,18048.7-0.6
United Tasmania 7641.8-0.2
Independent Quentin Wilson1430.3+0.3

Braddon

1976 Tasmanian state election: Braddon
PartyCandidateVotes%±%
Quota 6,247
Labor Glen Davies (elected 1)7,95315.9+9.3
Labor John Coughlan (elected 3)5,05710.1+7.8
Labor Geoff Chisholm (elected 4)4,0908.2+3.3
Labor Michael Field (elected 5)3,5657.1+7.1
Labor Ted Vickers2,8375.7+5.7
Labor Maurice Dart1,4432.9+2.9
Labor Graeme Smith1,0532.1+2.1
Labor Christopher Wright9241.8+1.8
Liberal Ray Bonney (elected 2)6,43812.9+1.7
Liberal Ron Cornish (elected 6)4,0008.0+8.0
Liberal Roger Groom (elected 7)3,3346.7+6.7
Liberal Eric Bessell 2,7775.6+5.6
Liberal Kent Furmage2,1384.3+4.3
Liberal Frank Atkins1,8313.7+3.7
Liberal Harold Hawkes1,4392.9+2.9
Liberal Harold Dowling9631.9+1.9
Independent Philip Kelly1280.3+0.3
Total formal votes49,97096.6−0.2
Informal votes1,7663.4+0.2
Turnout 51,73694.3−0.2
Party total votes
Labor 26,92253.9-9.0
Liberal 22,92045.9+12.1
Independent Philip Kelly1280.3+0.3

Denison

1976 Tasmanian state election: Denison
PartyCandidateVotes%±%
Quota 5,854
Liberal Max Bingham (elected 1)14,52131.0+7.1
Liberal Hank Petrusma 1,7773.8+2.0
Liberal Bob Baker (elected 6)1,4663.1-0.7
Liberal Robert Mather (elected 5)1,3052.8-1.8
Liberal David Brownlow1,2972.8+2.8
Liberal Rudge Townley8391.8+1.8
Liberal Max Robinson (elected 7)4741.0+1.0
Liberal Basil Giffard2300.5+0.5
Labor Neil Batt (elected 2)8,63918.4+9.7
Labor Julian Amos (elected 3)3,1676.8+6.8
Labor John Green (elected 4)2,6685.7-4.5
Labor Ian Cole 1,8874.0+0.4
Labor Margaret Thurstans1,8313.9+3.9
Labor Thomas Gascoigne1,3162.8+2.8
Labor Des Lavey1,2692.7+2.7
Labor Ken Austin 1,1322.4-6.2
United Tasmania Rod Broadby1,5253.3+3.3
United Tasmania Helen Gee 3520.8+0.8
United Tasmania Patricia Armstrong2900.6+0.6
United Tasmania Patricia Jones2650.6+0.6
United Tasmania William Hickson960.2+0.2
United Tasmania Kevin Hazelwood730.2+0.2
United Tasmania David Stephen640.1+0.1
Workers Lance Buckingham1990.4+0.4
Workers Peter Mollon260.1+0.1
Socialist Workers Rosanne Fidler720.2+0.2
Socialist Workers John Tully510.1+0.1
Total formal votes46,83196.20.0
Informal votes1,8283.80.0
Turnout 48,65993.0−1.3
Party total votes
Liberal 21,90946.8+6.8
Labor 21,90946.8+0.5
United Tasmania 2,6655.7-1.2
Workers 2250.5+0.5
Socialist Workers 1230.3+0.3

Franklin

1976 Tasmanian state election: Franklin
PartyCandidateVotes%±%
Quota 5,913
Labor Bill Neilson (elected 1)11,37324.0+6.9
Labor Doug Lowe (elected 2)6,94414.7+4.1
Labor Ray Sherry (elected 4)3,6767.8+7.8
Labor Eric Barnard (elected 5)2,8916.1-13.0
Labor Jack Frost 1,2912.7-2.2
Labor Bill McKinnon 6561.4+1.4
Labor Peter Brown6451.4+1.4
Labor Raymond Woodruff5281.1+1.1
Labor Barrie Robinson980.2+0.2
Liberal John Beattie (elected 3)6,07712.8+3.4
Liberal Geoff Pearsall (elected 6)3,9768.4+3.5
Liberal Steve Gilmour (elected 7)2,5165.3+5.3
Liberal Alan Duggan1,7353.7+1.1
Liberal Doug Clark 1,6043.4-5.2
Liberal Thomas Dempsey5101.1+1.1
Liberal Roy Pallett4731.0+1.0
Liberal Frank O'Connor1030.2+0.2
United Tasmania Ria Ikin5621.2+1.2
United Tasmania John Levett2220.5+0.5
United Tasmania Brian Chapman1480.3+0.3
United Tasmania Rosemary Brown1450.3+0.3
United Tasmania Michael Davies890.2+0.2
United Tasmania Judith Walker890.2+0.2
United Tasmania Sharyn Harrison-Williams440.1+0.1
Independent Leo Jarvis3340.7+0.7
Independent Bryan Threlfall3270.7+0.7
Independent Harry Priest1250.3+0.3
Independent Roger Francis1190.3+0.3
Total formal votes47,30096.20.0
Informal votes1,8683.80.0
Turnout 49,16895.30.0
Party total votes
Labor 28,10259.4+0.7
Liberal 16,99435.9+2.6
United Tasmania 1,2992.7-5.3
Independent Leo Jarvis3340.7+0.7
Independent Bryan Threlfall3270.7+0.7
Independent Harry Priest1250.3+0.3
Independent Roger Francis1190.3+0.3

Wilmot

1976 Tasmanian state election: Wilmot
PartyCandidateVotes%±%
Quota 5,948
Labor Michael Polley (elected 1)8,05516.9+5.7
Labor Darrel Baldock (elected 2)6,26513.2+6.0
Labor Andrew Lohrey (elected 4)3,7047.8-2.2
Labor Charles Batt 3,0946.5+0.4
Labor Gordon Edhouse1,5733.3+3.3
Labor Terry Aulich (elected 5)1,4833.1+3.1
Labor Graham Vertigan5781.2+1.2
Labor Allan Rhodes5211.0+1.0
Liberal Robin Gray (elected 3)4,6329.7+9.7
Liberal Ian Braid (elected 6)3,8918.2+1.8
Liberal Graeme Page (elected 7)2,6945.7+5.7
Liberal Trevor Roach2,2314.7+4.7
Liberal Bob Ingamells 2,2074.6-0.6
Liberal D L Youd1,9714.1+4.1
Liberal Jim Burn1,6493.5+3.5
Liberal Bert Bessell 1,3062.7-1.7
Liberal Clyde FitzGerald1,0292.2+2.2
United Tasmania Anthony Burke3430.7+0.7
United Tasmania Anthony Joyce630.1+0.1
United Tasmania Roy Jackson490.1+0.1
Workers Stewart Lester2530.5+0.5
Workers Kevin Chaffey460.1+0.1
Independent Stan King1250.3+0.3
Total formal votes47,58296.1−0.3
Informal votes1,9463.9+0.3
Turnout 49,52895.70.0
Party total votes
Labor 25,27353.1-3.9
Liberal 21,43045.0+2.9
United Tasmania 4551.0+1.0
Workers 2990.6+0.6
Independent Stan King1250.3+0.3

See also

Related Research Articles

<span class="mw-page-title-main">Tasmanian House of Assembly</span> Lower house of the Parliament of Tasmania

The House of Assembly, or Lower House, is one of the two chambers of the Parliament of Tasmania in Australia. The other is the Legislative Council or Upper House. It sits in Parliament House in the state capital, Hobart.

<span class="mw-page-title-main">Parliament of Tasmania</span> Bicameral parliament in Tasmania

The Parliament of Tasmania is the bicameral legislature of the Australian state of Tasmania. It follows a Westminster-derived parliamentary system and consists of the governor of Tasmania, the Legislative Council, and the House of Assembly. Since 1841, the Legislative Council has met in Parliament House, Hobart, with the House of Assembly following suit from its establishment in 1856. The Parliament of Tasmania first met in 1856.

<span class="mw-page-title-main">1998 Tasmanian state election</span>

The 1998 Tasmanian state election was held on Saturday, 29 August 1998 in the Australian state of Tasmania to elect 25 members of the Tasmanian House of Assembly. The number of members was reduced from 35 to 25. The election used the Hare-Clark proportional representation system—five members were elected from each of five electorates. The quota required for election increased from 12.5% to 16.7%.

<span class="mw-page-title-main">1986 Tasmanian state election</span>

The 1986 Tasmanian state election was held on 8 February 1986 in the Australian state of Tasmania to elect 35 members of the Tasmanian House of Assembly. The election used the Hare-Clark proportional representation system — seven members were elected from each of five electorates. The quota required for election was 12.5% in each division.

<span class="mw-page-title-main">1969 Tasmanian state election</span>

The 1969 Tasmanian state election was held on 10 May 1969 in the Australian state of Tasmania to elect 35 members of the Tasmanian House of Assembly. The election used the Hare-Clark proportional representation system — seven members were elected from each of five electorates.

<span class="mw-page-title-main">1972 Tasmanian state election</span>

The 1972 Tasmanian state election was held on 22 April 1972 in the Australian state of Tasmania to elect 35 members of the Tasmanian House of Assembly. The election used the Hare-Clark proportional representation system — seven members were elected from each of five electorates.

<span class="mw-page-title-main">1976 Tasmanian state election</span>

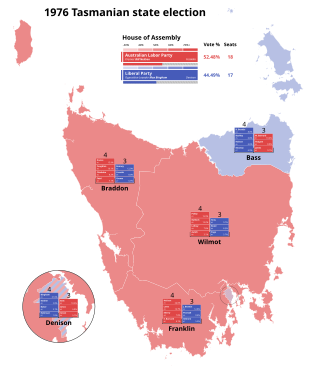
The 1976 Tasmanian state election was held on 11 December 1976 in the Australian state of Tasmania to elect 35 members of the Tasmanian House of Assembly. The election used the Hare-Clark proportional representation system — seven members were elected from each of five electorates.

<span class="mw-page-title-main">1979 Tasmanian state election</span>

The 1979 Tasmanian state election was held on 28 July 1979 in the Australian state of Tasmania to elect 35 members of the Tasmanian House of Assembly. The election used the Hare-Clark proportional representation system — seven members were elected from each of five electorates. The quota required for election was 12.5% in each division.

<span class="mw-page-title-main">1912 Tasmanian state election</span>

The 1912 Tasmanian state election was held on Tuesday, 30 April 1912 in the Australian state of Tasmania to elect 30 members of the Tasmanian House of Assembly. The election used the Hare-Clark proportional representation system — six members were elected from each of five electorates.

<span class="mw-page-title-main">1913 Tasmanian state election</span>

The 1913 Tasmanian state election was held on Thursday, 23 January 1913 in the Australian state of Tasmania to elect 30 members of the Tasmanian House of Assembly. The election used the Hare-Clark proportional representation system — six members were elected from each of five electorates.

<span class="mw-page-title-main">1916 Tasmanian state election</span>

The 1916 Tasmanian state election was held on Saturday, 25 March 1916 in the Australian state of Tasmania to elect 30 members of the Tasmanian House of Assembly. The election used the Hare-Clark proportional representation system — six members were elected from each of five electorates.

<span class="mw-page-title-main">1919 Tasmanian state election</span>

The 1919 Tasmanian state election was held on 31 May 1919 in the Australian state of Tasmania to elect 30 members of the Tasmanian House of Assembly. The election used the Hare-Clark proportional representation system — six members were elected from each of five electorates.

<span class="mw-page-title-main">1931 Tasmanian state election</span>

The 1931 Tasmanian state election was held on 9 May 1931 in the Australian state of Tasmania to elect 30 members of the Tasmanian House of Assembly. The election used the Hare-Clark proportional representation system — six members were elected from each of five electorates. For the first time, voting was compulsory, resulting in a high voter turnout.

<span class="mw-page-title-main">1937 Tasmanian state election</span>

The 1937 Tasmanian state election was held on 20 February 1937 in the Australian state of Tasmania to elect 30 members of the Tasmanian House of Assembly. The election used the Hare-Clark proportional representation system — six members were elected from each of five electorates.

<span class="mw-page-title-main">1950 Tasmanian state election</span>

The 1950 Tasmanian state election was held on 6 May 1950 in the Australian state of Tasmania to elect 30 members of the Tasmanian House of Assembly. The election used the Hare-Clark proportional representation system — six members were elected from each of five electorates.

<span class="mw-page-title-main">1955 Tasmanian state election</span>

The 1955 Tasmanian state election was held on 19 February 1955 in the Australian state of Tasmania to elect 30 members of the Tasmanian House of Assembly. The election used the Hare-Clark proportional representation system — six members were elected from each of five electorates.

<span class="mw-page-title-main">1956 Tasmanian state election</span>

The 1956 Tasmanian state election was held on 13 October 1956 in the Australian state of Tasmania to elect 30 members of the Tasmanian House of Assembly. The election used the Hare-Clark proportional representation system — six members were elected from each of five electorates.

<span class="mw-page-title-main">1959 Tasmanian state election</span>

The 1959 Tasmanian state election was held on 2 May 1959 in the Australian state of Tasmania to elect 35 members of the Tasmanian House of Assembly. The number of members were increased from this election from 30 to 35. The election used the Hare-Clark proportional representation system — seven members were elected from each of five electorates.

<span class="mw-page-title-main">1964 Tasmanian state election</span>

The 1964 Tasmanian state election was held on 2 May 1964 in the Australian state of Tasmania to elect 35 members of the Tasmanian House of Assembly. The election used the Hare-Clark proportional representation system — seven members were elected from each of five electorates.

This is a list of House of Assembly results for the 1972 Tasmanian election.

References

  1. "Assembly Election Results, 1976". Tasmanian Parliamentary Library.