Victorian state election, 30 March 1996 [1] Contents
| ||||||
---|---|---|---|---|---|---|
Enrolled voters | 3,000,076 | |||||
Votes cast | 2,826,467 | Turnout | 94.21 | –1.01 | ||
Informal votes | 72,800 | Informal | 2.58 | –1.53 | ||
Summary of votes by party | ||||||
Party | Primary votes | % | Swing | Seats won | Seats held | |
Liberal | 1,208,168 | 43.87 | +0.38 | 14 | 28 | |
Labor | 1,114,843 | 40.49 | +1.93 | 5 | 10 | |
National | 182,494 | 6.63 | –2.11 | 3 | 6 | |
Democrats | 157,798 | 5.73 | +5.42 | 0 | 0 | |
Democratic Labor | 43,553 | 1.58 | –2.96 | 0 | 0 | |
Natural Law | 14,129 | 0.51 | –0.11 | 0 | 0 | |
Call to Australia | 5,576 | 0.20 | +0.12 | 0 | 0 | |
Friendly Migrant Workers | 1,339 | 0.05 | +0.05 | 0 | 0 | |
Independent | 25,767 | 0.94 | –2.15 | 0 | 0 | |
Total | 2,753,667 | 22 | 44 | |||
Two-party-preferred | ||||||
Liberal/National | 1,482,617 | 53.96 | –2.69 | |||
Labor | 1,264,879 | 46.04 | +2.69 |
This is a list of Legislative Council results for the Victorian 1996 state election. 22 of the 44 seats were contested.
Party | Candidate | Votes | % | ±% | |
---|---|---|---|---|---|
Liberal | Rob Knowles | 62,107 | 51.7 | −2.2 | |
Labor | Catherine Laffey | 49,943 | 41.5 | +0.7 | |
Democrats | Myrna Rance | 4,687 | 3.9 | +3.9 | |
Call to Australia | David Cocking | 2,163 | 1.8 | +1.8 | |
Democratic Labor | Brian Lugar | 1,343 | 1.1 | −4.2 | |
Total formal votes | 120,243 | 98.2 | +1.1 | ||
Informal votes | 2,258 | 1.8 | −1.1 | ||
Turnout | 122,501 | 94.9 | |||
Two-party-preferred result | |||||
Liberal | Rob Knowles | 65,312 | 54.4 | −0.9 | |
Labor | Catherine Laffey | 54,796 | 45.6 | +0.9 | |
Liberal hold | Swing | -0.9 | |||
Party | Candidate | Votes | % | ±% | |
---|---|---|---|---|---|
Liberal | Geoff Craige | 68,100 | 54.1 | −4.4 | |
Labor | Geoff Cooper | 47,608 | 37.8 | +2.3 | |
Democrats | Ray Doensen | 7,904 | 6.3 | +6.3 | |
Democratic Labor | Christian Schalken | 2,248 | 1.8 | −4.2 | |
Total formal votes | 125,860 | 97.7 | +1.0 | ||
Informal votes | 2,951 | 2.3 | −1.0 | ||
Turnout | 128,811 | 95.0 | |||
Two-party-preferred result | |||||
Liberal | Geoff Craige | 72,329 | 57.6 | −3.3 | |
Labor | Geoff Cooper | 53,259 | 42.4 | +3.3 | |
Liberal hold | Swing | -3.3 | |||
Party | Candidate | Votes | % | ±% | |
---|---|---|---|---|---|
Liberal | Cameron Boardman | 61,122 | 50.7 | +0.7 | |
Labor | Burwyn Davidson | 50,902 | 42.2 | +1.7 | |
Democrats | Kaylyn Raynor | 5,694 | 4.7 | +4.7 | |
Democratic Labor | Mechelina Schalken | 1,480 | 1.2 | −3.2 | |
Natural Law | Lee Fergusson | 1,394 | 1.2 | +1.2 | |
Total formal votes | 120,592 | 97.5 | +1.9 | ||
Informal votes | 3,155 | 2.5 | −1.9 | ||
Turnout | 123,747 | 94.3 | |||
Two-party-preferred result | |||||
Liberal | Cameron Boardman | 64,158 | 53.3 | −0.9 | |
Labor | Burwyn Davidson | 56,315 | 46.7 | +0.9 | |
Liberal gain from Labor | Swing | -0.9 | |||
Party | Candidate | Votes | % | ±% | |
---|---|---|---|---|---|
Labor | Monica Gould | 75,717 | 57.8 | +6.4 | |
Liberal | Jody Allatt | 47,467 | 36.2 | +0.1 | |
Democrats | John Davey | 4,782 | 3.7 | +3.7 | |
Democratic Labor | Gloria Brook | 2,997 | 2.3 | −4.4 | |
Total formal votes | 130,963 | 95.6 | +2.3 | ||
Informal votes | 5,984 | 4.4 | −2.3 | ||
Turnout | 136,947 | 94.1 | |||
Two-party-preferred result | |||||
Labor | Monica Gould | 79,968 | 61.2 | +3.2 | |
Liberal | Jody Allatt | 50,727 | 38.8 | −3.2 | |
Labor hold | Swing | +3.2 | |||
Party | Candidate | Votes | % | ±% | |
---|---|---|---|---|---|
Liberal | David Davis | 72,536 | 57.3 | −6.2 | |
Labor | Morley Muralitharan | 38,297 | 30.2 | +0.1 | |
Democrats | Pierre Harcourt | 11,372 | 9.0 | +9.0 | |
Natural Law | Lesley Mendelson | 2,335 | 1.8 | +1.8 | |
Democratic Labor | John Murphy | 2,130 | 1.7 | −4.7 | |
Total formal votes | 126,670 | 98.3 | +1.5 | ||
Informal votes | 2,199 | 1.7 | −1.5 | ||
Turnout | 128,869 | 94.0 | |||
Two-party-preferred result | |||||
Liberal | David Davis | 78,558 | 62.2 | −4.2 | |
Labor | Morley Muralitharan | 47,736 | 37.8 | +4.2 | |
Liberal hold | Swing | -4.2 | |||
Party | Candidate | Votes | % | ±% | |
---|---|---|---|---|---|
Liberal | Neil Lucas | 64,976 | 48.8 | −3.8 | |
Labor | Bob Ives | 57,243 | 43.0 | +1.8 | |
Democrats | John Hastie | 5,478 | 4.1 | +4.1 | |
Call to Australia | Lynne Dickson | 3,413 | 2.6 | +2.6 | |
Democratic Labor | Teresa Crea | 2,056 | 1.5 | −4.6 | |
Total formal votes | 133,166 | 96.9 | +2.0 | ||
Informal votes | 4,273 | 3.1 | −2.0 | ||
Turnout | 137,439 | 94.9 | |||
Two-party-preferred result | |||||
Liberal | Neil Lucas | 70,196 | 52.8 | −2.3 | |
Labor | Bob Ives | 62,780 | 47.2 | +2.3 | |
Liberal gain from Labor | Swing | -2.3 | |||
Party | Candidate | Votes | % | ±% | |
---|---|---|---|---|---|
Liberal | Ian Cover | 63,930 | 51.2 | +6.7 | |
Labor | Carole Marple | 54,008 | 43.3 | +3.3 | |
Democrats | Gerald Desmarais | 5,599 | 4.5 | +4.5 | |
Democratic Labor | Bill Verhoef | 1,332 | 1.1 | −0.4 | |
Total formal votes | 124,869 | 97.8 | +1.3 | ||
Informal votes | 2,852 | 2.2 | −1.3 | ||
Turnout | 127,721 | 95.6 | |||
Two-party-preferred result | |||||
Liberal | Ian Cover | 66,366 | 53.3 | +0.1 | |
Labor | Carole Marple | 58,143 | 46.7 | −0.1 | |
Liberal gain from Labor | Swing | +0.1 | |||
Party | Candidate | Votes | % | ±% | |
---|---|---|---|---|---|
National | Peter Hall | 67,637 | 55.7 | +55.7 | |
Labor | Christian Zahra | 40,837 | 33.6 | +0.8 | |
Democrats | Greg Kerr | 5,720 | 4.7 | +4.7 | |
Independent | Ben Buckley | 5,375 | 4.4 | −0.2 | |
Democratic Labor | Michael Rowe | 1,872 | 1.5 | −2.4 | |
Total formal votes | 121,441 | 97.9 | +0.6 | ||
Informal votes | 2,560 | 2.1 | −0.6 | ||
Turnout | 124,001 | 95.0 | |||
Two-party-preferred result | |||||
National | Peter Hall | 73,844 | 61.0 | −0.9 | |
Labor | Christian Zahra | 47,253 | 39.0 | +0.9 | |
National hold | Swing | -0.9 | |||
Party | Candidate | Votes | % | ±% | |
---|---|---|---|---|---|
Liberal | John Ross | 69,727 | 56.7 | −5.3 | |
Labor | Ken Wilson | 42,032 | 34.2 | +3.2 | |
Democrats | Diane Barry | 9,655 | 7.9 | +7.9 | |
Democratic Labor | Gail King | 1,507 | 1.2 | −1.5 | |
Total formal votes | 122,921 | 98.0 | +1.6 | ||
Informal votes | 2,549 | 2.0 | −1.6 | ||
Turnout | 125,470 | 94.2 | |||
Two-party-preferred result | |||||
Liberal | John Ross | 74,580 | 60.8 | −3.9 | |
Labor | Ken Wilson | 48,149 | 39.2 | +3.9 | |
Liberal hold | Swing | -3.9 | |||
Party | Candidate | Votes | % | ±% | |
---|---|---|---|---|---|
Labor | Theo Theophanous | 70,387 | 55.3 | −0.2 | |
Liberal | George Prillwitz | 43,170 | 33.9 | −3.0 | |
Democrats | Yanko Kalincev | 9,137 | 7.2 | +7.2 | |
Democratic Labor | Bill Jansen | 2,764 | 2.2 | −5.4 | |
Natural Law | Byron Rigby | 1,834 | 1.4 | +1.4 | |
Total formal votes | 127,292 | 96.4 | +1.9 | ||
Informal votes | 4,805 | 3.6 | −1.9 | ||
Turnout | 132,097 | 94.2 | |||
Two-party-preferred result | |||||
Labor | Theo Theophanous | 79,806 | 62.8 | +1.5 | |
Liberal | George Prillwitz | 47,262 | 37.2 | −1.5 | |
Labor hold | Swing | +1.5 | |||
Party | Candidate | Votes | % | ±% | |
---|---|---|---|---|---|
Liberal | Gerald Ashman | 72,025 | 56.5 | −1.4 | |
Labor | Chrys Abraham | 45,323 | 35.5 | −1.3 | |
Democrats | Damian Wise | 7,066 | 5.5 | +5.5 | |
Democratic Labor | Paul Cahill | 1,810 | 1.4 | −3.9 | |
Independent | Jill Bannan | 1,336 | 1.0 | +1.0 | |
Total formal votes | 127,560 | 97.8 | +1.6 | ||
Informal votes | 2,865 | 2.2 | −1.6 | ||
Turnout | 130,425 | 94.3 | |||
Two-party-preferred result | |||||
Liberal | Gerald Ashman | 75,800 | 59.6 | −0.3 | |
Labor | Chrys Abraham | 51,431 | 40.4 | +0.3 | |
Liberal hold | Swing | -0.3 | |||
Party | Candidate | Votes | % | ±% | |
---|---|---|---|---|---|
Labor | Barry Pullen | 70,215 | 54.9 | +3.2 | |
Liberal | Stuart McCraith | 42,862 | 33.5 | −2.1 | |
Democrats | Robert Stone | 10,766 | 8.4 | +1.4 | |
Democratic Labor | John Mulholland | 2,283 | 1.8 | −0.2 | |
Natural Law | Ngaire Mason | 1,701 | 1.3 | −2.3 | |
Total formal votes | 127,827 | 96.9 | +2.5 | ||
Informal votes | 4,097 | 3.1 | −2.5 | ||
Turnout | 131,924 | 90.9 | |||
Two-party-preferred result | |||||
Labor | Barry Pullen | 81,343 | 63.8 | +4.9 | |
Liberal | Stuart McCraith | 46,128 | 36.2 | −4.9 | |
Labor hold | Swing | +4.9 | |||
Party | Candidate | Votes | % | ±% | |
---|---|---|---|---|---|
Labor | Caroline Hogg | 71,022 | 57.7 | +2.6 | |
Liberal | Julie Beattie | 44,334 | 36.0 | −2.3 | |
Democrats | Morris Moretta | 4,762 | 3.9 | +3.9 | |
Democratic Labor | Hank Ferwerda | 1,708 | 1.4 | −5.3 | |
Friendly Migrant Workers | Joseph Kaliniy | 1,339 | 1.1 | +1.1 | |
Total formal votes | 123,165 | 96.3 | +2.2 | ||
Informal votes | 4,699 | 3.7 | −2.2 | ||
Turnout | 127,864 | 94.0 | |||
Two-party-preferred result | |||||
Labor | Caroline Hogg | 75,831 | 61.7 | +1.9 | |
Liberal | Julie Beattie | 47,131 | 38.3 | −1.9 | |
Labor hold | Swing | +1.9 | |||
Party | Candidate | Votes | % | ±% | |
---|---|---|---|---|---|
Labor | Sang Nguyen | 59,414 | 47.6 | +2.7 | |
Liberal | Chris MacGregor | 41,861 | 33.5 | +3.7 | |
Independent | Les Twentyman | 12,878 | 10.3 | −12.6 | |
Democratic Labor | Kevin Carroll | 4,876 | 3.9 | +1.6 | |
Democrats | Alan Parker | 3,867 | 3.1 | +3.1 | |
Natural Law | Panayiota Stamatopoulou | 1,064 | 0.9 | +0.9 | |
Independent | Joe Santana | 853 | 0.7 | +0.7 | |
Total formal votes | 124,813 | 96.1 | +1.4 | ||
Informal votes | 5,053 | 3.9 | −1.4 | ||
Turnout | 129,866 | 93.7 | |||
Two-party-preferred result | |||||
Labor | Sang Nguyen | 76,203 | 61.2 | +5.6 | |
Liberal | Chris MacGregor | 48,360 | 38.8 | −5.6 | |
Labor hold | Swing | +5.6 | |||
Party | Candidate | Votes | % | ±% | |
---|---|---|---|---|---|
Liberal | Peter Katsambanis | 66,966 | 51.7 | −4.8 | |
Labor | Nicholas Gold | 49,805 | 38.5 | +3.4 | |
Democrats | Julie Peters | 8,467 | 6.5 | +6.5 | |
Natural Law | Joan Dickins | 2,451 | 1.9 | +1.9 | |
Democratic Labor | Terry O'Hanlon | 1,036 | 0.8 | −3.6 | |
Independent | Jonathan Heath | 767 | 0.6 | +0.6 | |
Total formal votes | 129,492 | 97.6 | +1.9 | ||
Informal votes | 3,134 | 2.4 | −1.9 | ||
Turnout | 132,626 | 90.4 | |||
Two-party-preferred result | |||||
Liberal | Peter Katsambanis | 70,709 | 54.8 | −5.5 | |
Labor | Nicholas Gold | 58,386 | 45.2 | +5.5 | |
Liberal hold | Swing | -5.5 | |||
Party | Candidate | Votes | % | ±% | |
---|---|---|---|---|---|
National | Jeanette Powell | 45,776 | 37.0 | −31.3 | |
Liberal | Glen Nichols | 40,020 | 32.4 | +32.4 | |
Labor | Rachelle Valente | 31,629 | 25.6 | −1.0 | |
Democrats | John Clarke | 4,862 | 3.9 | +3.9 | |
Democratic Labor | Gavan Grimes | 1,364 | 1.1 | −4.0 | |
Total formal votes | 123,651 | 97.7 | +0.7 | ||
Informal votes | 2,854 | 2.3 | −0.7 | ||
Turnout | 126,505 | 94.6 | |||
Two-candidate-preferred result | |||||
National | Jeanette Powell | 76,220 | 61.8 | −9.2 | |
Liberal | Glen Nichols | 47,027 | 38.2 | +38.2 | |
National hold | Swing | N/A | |||
Party | Candidate | Votes | % | ±% | |
---|---|---|---|---|---|
National | Ron Best | 69,081 | 57.2 | +2.1 | |
Labor | Gary Thorn | 40,796 | 33.8 | +3.4 | |
Democrats | Don Semmens | 6,856 | 5.7 | +5.7 | |
Independent | Gary Schorel | 2,473 | 2.0 | +2.0 | |
Democratic Labor | Peter Ferwerda | 1,479 | 1.2 | −0.7 | |
Total formal votes | 120,685 | 98.1 | +0.7 | ||
Informal votes | 2,375 | 1.9 | −0.7 | ||
Turnout | 123,060 | 94.9 | |||
Two-party-preferred result | |||||
National | Ron Best | 74,137 | 61.6 | −3.5 | |
Labor | Gary Thorn | 46,181 | 38.4 | +3.5 | |
National hold | Swing | -3.5 | |||
Party | Candidate | Votes | % | ±% | |
---|---|---|---|---|---|
Liberal | Wendy Smith | 68,604 | 56.0 | −1.7 | |
Labor | Kathy Jackson | 42,540 | 34.7 | −1.3 | |
Democrats | John McLaren | 7,318 | 6.0 | +6.0 | |
Natural Law | Sue Cawthorn | 1,928 | 1.6 | +1.6 | |
Democratic Labor | Alan Jansen | 1,143 | 0.9 | −5.3 | |
Independent | Steve Raskovy | 952 | 0.8 | +0.8 | |
Total formal votes | 122,485 | 97.8 | +1.2 | ||
Informal votes | 2,748 | 2.2 | −1.2 | ||
Turnout | 125,233 | 95.0 | |||
Two-party-preferred result | |||||
Liberal | Wendy Smith | 73,821 | 60.4 | +0.4 | |
Labor | Kathy Jackson | 48,423 | 39.6 | −0.4 | |
Liberal hold | Swing | +0.4 | |||
Party | Candidate | Votes | % | ±% | |
---|---|---|---|---|---|
Liberal | Ken Smith | 71,864 | 56.6 | −0.6 | |
Labor | Jude Perera | 45,005 | 35.4 | +2.0 | |
Democrats | Glen Maddock | 6,192 | 4.9 | +4.9 | |
Democratic Labor | Pat Crea | 1,461 | 1.1 | −2.4 | |
Natural Law | Alan Shield | 1,422 | 1.1 | −4.8 | |
Independent | Bill McCluskey | 1,133 | 0.9 | +0.9 | |
Total formal votes | 127,077 | 97.8 | +1.3 | ||
Informal votes | 2,846 | 2.2 | −1.3 | ||
Turnout | 129,923 | 94.9 | |||
Two-party-preferred result | |||||
Liberal | Ken Smith | 76,236 | 60.1 | −2.2 | |
Labor | Jude Perera | 50,660 | 39.9 | +2.2 | |
Liberal hold | Swing | -2.2 | |||
Party | Candidate | Votes | % | ±% | |
---|---|---|---|---|---|
Liberal | Carlo Furletti | 70,405 | 54.8 | −4.7 | |
Labor | Heather Garth | 45,196 | 35.2 | +0.4 | |
Democrats | Angela Carter | 11,079 | 8.6 | +8.6 | |
Democratic Labor | Frances Murphy | 1,867 | 1.5 | −1.2 | |
Total formal votes | 128,547 | 97.7 | +1.8 | ||
Informal votes | 3,001 | 2.3 | −1.8 | ||
Turnout | 131,548 | 94.8 | |||
Two-party-preferred result | |||||
Liberal | Carlo Furletti | 75,925 | 59.2 | −2.5 | |
Labor | Heather Garth | 52,392 | 40.8 | +2.5 | |
Liberal hold | Swing | -2.5 | |||
Party | Candidate | Votes | % | ±% | |
---|---|---|---|---|---|
Liberal | Maree Luckins | 62,281 | 50.9 | −1.7 | |
Labor | Garth Head | 49,573 | 40.5 | +1.2 | |
Democrats | Richard Grummet | 8,450 | 6.9 | +6.9 | |
Democratic Labor | Matt Cody | 1,960 | 1.6 | −2.2 | |
Total formal votes | 122,264 | 97.4 | +2.5 | ||
Informal votes | 3,266 | 2.6 | −2.5 | ||
Turnout | 125,530 | 94.0 | |||
Two-party-preferred result | |||||
Liberal | Maree Luckins | 66,917 | 54.8 | −0.1 | |
Labor | Garth Head | 55,085 | 45.2 | +0.1 | |
Liberal gain from Labor | Swing | -0.1 | |||
Party | Candidate | Votes | % | ±% | |
---|---|---|---|---|---|
Liberal | Bruce Chamberlain | 73,811 | 60.5 | +60.5 | |
Labor | Elizabeth Wilson | 37,351 | 30.6 | +3.2 | |
Democrats | Don Anderson | 8,085 | 6.6 | +6.6 | |
Democratic Labor | Christine Dodd | 2,837 | 2.3 | −2.8 | |
Total formal votes | 122,084 | 98.2 | +0.9 | ||
Informal votes | 2,276 | 1.8 | −0.9 | ||
Turnout | 124,360 | 95.8 | |||
Two-party-preferred result | |||||
Liberal | Bruce Chamberlain | 78,769 | 64.7 | −6.0 | |
Labor | Elizabeth Wilson | 42,897 | 35.3 | +6.0 | |
Liberal hold | Swing | -6.0 | |||
| |||||||||||||||||||
1 seat in the Legislative Council | |||||||||||||||||||
---|---|---|---|---|---|---|---|---|---|---|---|---|---|---|---|---|---|---|---|
|
There was a Legislative Council by-election that took place on election day following the resignation of MLCs elected at the 1992 election.
Party | Candidate | Votes | % | ±% | |
---|---|---|---|---|---|
Labor | Tayfun Eren | 73,796 | 57.0 | +5.6 | |
Liberal | R McClymont | 48,506 | 37.5 | +1.3 | |
Independent | S Bingle | 7,103 | 5.5 | +5.5 | |
Total formal votes | 129,405 | 95.6 | +2.2 | ||
Informal votes | 6,011 | 4.4 | −2.2 | ||
Turnout | 135,416 | 93.1 | |||
Two-party-preferred result | |||||
Labor | Tayfun Eren | 77,348 | 59.8 | ||
Liberal | R McClymont | 52,057 | 40.2 | ||
Labor hold | Swing | ||||
This election was caused by the vacancy following the resignation of David White, who unsuccessfully contested the lower house seat of Tullamarine.
William Robert Baxter is a former Australian politician and a former Victorian State President of The Nationals. He was the Nationals member of the Victorian Legislative Council representing North Eastern Province from June 1978 until November 2006. He also served one term in the Victorian Legislative Assembly from 1973 to 1976.
People Power was a populist political movement in Australia that was federally registered as a political party in March 2006. The party contested its first election at the 2006 Victorian state election and was de-registered federally in December 2006.
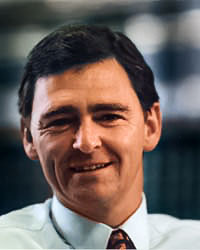
John Mansfield Brumby is the current Chancellor of La Trobe University and former Victorian Labor Party politician who was Premier of Victoria from 2007 to 2010. He became leader of the Victorian Labor Party and premier after the resignation of Steve Bracks. He also served as the Minister for Veterans' Affairs and the Minister for Multicultural Affairs. He contested his first election as premier at the November 2010 Victorian state election. His government was defeated by the Liberal/National Coalition led by Ted Baillieu. Brumby resigned as Labor leader after the election, on 30 November, to be replaced by Daniel Andrews. Within weeks of this leadership change, Brumby left parliament, with a Broadmeadows by-election taking place on 19 February 2011.
The Victorian Greens, officially known as the Australian Greens Victoria, is the Victorian state member party of the Australian Greens, a green political party in Australia.
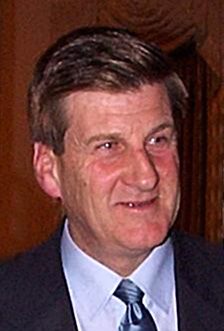
The 1996 Victorian state election, held on Saturday, 30 March 1996, was for the 53rd Parliament of Victoria. It was held in the Australian state of Victoria to elect all 88 members of the state's Legislative Assembly and 22 members of the 44-member Legislative Council. The election took place four weeks after the 1996 federal election which swept the Labor Party from power nationally.
The 2006 Victorian state election, held on Saturday, 25 November 2006, was for the 56th Parliament of Victoria. Just over 3 million Victorians registered to vote elected 88 members to the Legislative Assembly and, for the first time, 40 members to the Legislative Council under a proportional representation system. The election was conducted by the independent Victorian Electoral Commission.
Martin Philip Pakula is a former Australian politician. He has been a Labor Party member of the Parliament of Victoria from 2006 to 2022: in the Legislative Council for Western Metropolitan Region from 2006 to 2013, and then in the Legislative Assembly for Lyndhurst (2013–2014) and Keysborough (2014–2022).
This is a list of members of the Victorian Legislative Council between 1992 and 1996. As half of the Legislative Council's terms expired at each periodic election, half of these members were elected at the 1988 state election with terms expiring in 1996, while the other half were elected at the 1992 state election with terms intended to expire in 2000, but which lapsed at the 1999 state election.
Peter Argyris Katsambanis is a former Australian politician. He was elected to the Western Australian Legislative Council at the 2013 state election, representing the Liberal Party, taking his seat on 22 May 2013. He resigned in 2017 to successfully contest the Legislative Assembly seat of Hillarys. At the 2021 Western Australian state election, he was defeated by Labor's Caitlin Collins. He was previously a Liberal member of the Victorian Legislative Council, from 1996 to 2002.
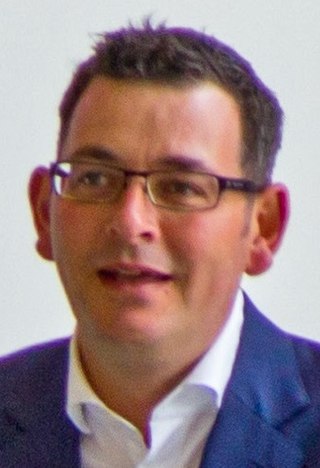
The 2014 Victorian state election, held on Saturday, 29 November 2014, was for the 58th Parliament of Victoria. All 88 seats in the Victorian Legislative Assembly and 40 seats in the Victorian Legislative Council were up for election. The incumbent centre-right Coalition minority government, led by Liberal Party leader and Premier Denis Napthine and National Party leader and Deputy Premier Peter Ryan, was defeated by the centre-left Labor Party opposition, led by Daniel Andrews. The Greens won two lower house seats, their first Legislative Assembly seats in a Victorian state election, whilst increasing their share of upper house seats. The new Andrews Ministry was sworn in on 4 December 2014.
Jane Furneaux Garrett was an Australian politician. She was the Labor Party member for Brunswick in the Victorian Legislative Assembly from 2010 until 2018, when she transferred to the Victorian Legislative Council representing Eastern Victoria.
This is a list of Legislative Council results for the Victorian 2002 state election. 22 of the 44 seats were contested. This was the last election using single-member districts before the introduction of multi-member districts ahead of the 2006 election.
This is a list of Legislative Council results for the Victorian 1999 state election. 22 of the 44 seats were contested.
The 2018 Victorian state election was held on Saturday, 24 November 2018 to elect the 59th Parliament of Victoria. All 88 seats in the Legislative Assembly and all 40 seats in the Legislative Council were up for election. The first-term incumbent Labor government, led by Premier Daniel Andrews, won a second four-year term, defeating the Liberal/National Coalition opposition, led by Opposition Leader Matthew Guy in a landslide victory. Minor party the Greens led by Samantha Ratnam also contested the election.
This is a list of results for the Legislative Council at the 2015 New South Wales state election.
This is a list of electoral results for the Ballarat Province in Victorian state elections.
This is a list of electoral results for the East Yarra Province in Victorian state elections.
This is a list of electoral results for the Doutta Galla Province in Victorian state elections.
This is a list of electoral results for the North Eastern Province in Victorian state elections.
The 2026 Victorian state election is expected to be held on 28 November 2026 to elect the 61st Parliament of Victoria. All 88 seats in the Legislative Assembly and all 40 seats in the Legislative Council will be up for election, presuming there are no new electorates added in a redistribution.