Rockworks

Last updated

First developed in 1985 by RockWare Inc, RockWorks is used by the mining, petroleum, and environmental industry for subsurface visualization, borehole database management as well as the creation of grids, solid models, calculating volumetric analysis, etc.

Contents

RockWorks background

Computer modeling in RockWorks provides a means for tailoring a mine, environmental, petroleum, etc. plan based on the end-user specifications. The basic strategy involves the creation of a borehole database that includes analytical results for various physical and chemical properties as a function of depth. Once the database has been created, visualizations such as cross-sections, fence diagrams, and block diagrams are generated to check the validity and geological reasonability of the modeling. The next steps can involve the calculation of volumetrics and optimal pit-designs for example, in mining, based on a series of user-defined parameters.

The foundation of these analyses involve the creation of imaginary block models in which a site is subdivided into a series of three-dimensional cells called a voxel (volumetric element). Values are estimated for these voxels based on their proximity relative to downhole data. For example, a clay deposit may involve the creation of separate models representing shrinkage, brightness, and slip. These models are then filtered and combined into a final model that shows where all of the parameters (models) meet a set of user-defined criteria. The net result is high-grade, or “surgical” mining in which the quarry is designed to maximize profitability rather than simply mining the entire lease and relying on the sorting/milling process to separate the ore and the non-ore.

A healthy level of skepticism must be employed when using computer software to compute resource volumetrics. The algorithms or methods used to create the volumetric models have limitations that may be acceptable for one type of deposit while being completely inappropriate for another. For example, a sand and gravel deposit requires an approach that is completely different from the methods used to evaluate a phosphate reserve. The best way to avoid misuse is to always compare “slices” through the models with borehole logs that show the original data. These cross-sections are used to make sure that the model “honors” the data. Just as importantly, cross-sections should be evaluated to make sure that the modeling conforms to the expected geology.

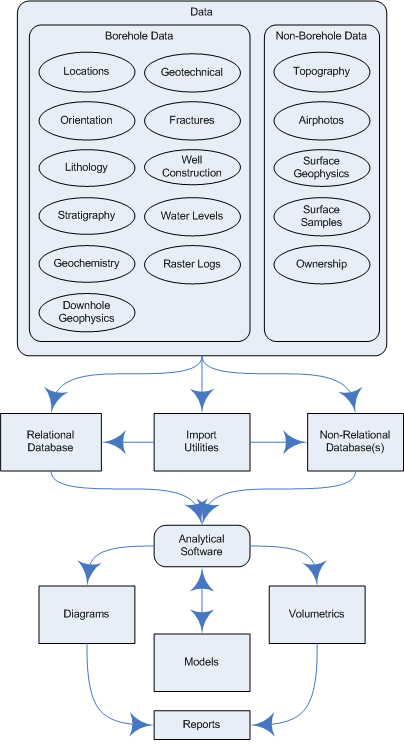
The raw dataset that are used for industrial mineral deposit modeling can be classified into two major types: borehole and non-borehole data. The management of borehole data is very different from non-borehole data. Specifically, borehole data requires a relational database management system (e.g. Access, FileMaker, SQL, Oracle,) whereas non-borehole data (with the exception of land ownership) can be handled with simple “flat” file managers (e.g. Microsoft Excel, Lotus 1-2-3).

Rockworks flowchart 01.png

Modeling

“Modeling” refers to the process of creating a spatial array of estimations. The parameter that is being estimated may be the thickness of the ore, the grade of the ore, or some other property that is useful for the evaluation of the resource. These arrays may be two or three-dimensional depending upon the number of independent variables. In a two-dimensional array (also referred to as a “grid model”), the dependent variable (z) is a function of the horizontal (x,y) coordinates. In a three-dimensional array (also referred to as a solid or block model), the dependent variable (g) is a function of the horizontal (x,y) and vertical coordinates (z). Grids are used to model topography, stratigraphic contacts, isopachs, and water levels, while solids are used to model geochemistry, ore grades, and geotechnical properties.

The key difference between grid models and block models is that a gridded surface (e.g. a stratigraphic contact) cannot fold or wrap under itself whereas an isosurface within a block model can. Stated differently, when dealing with grids, there can only be one z-value for any given xy coordinate. On the other hand, when dealing with block models, there can only be one g-value for any given xyz coordinate. Another major difference is that gridding is computationally fast while block modeling can be very slow.

Two-Dimensional Modeling (Gridding)

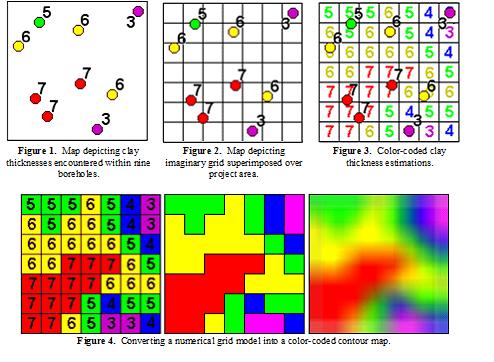
Consider the evaluation of a clay deposit in which the only important parameter is the thickness of the clay (i.e. the clay grade is homogeneous or “anisotropic”). Variations in the clay thickness encountered within nine boreholes are depicted by Figure 1.

Clay thickness.jpg

The first step in the modeling process is to superimpose an imaginary grid (Figure 2) over the project area. This grid defines the resolution of the subsequent model in a manner analogous to pixels (picture elements) within a digital image. Specifically, as the pixels become smaller, smaller features are resolved at the expense of computer memory and speed. A general guideline for dimensioning the grid is to set the cell dimensions equal to the average minimum distance between the control points (e.g. boreholes).

Once a grid has been established, the clay thicknesses at the center of each grid node are estimated. These estimations are based on a weighted average of the values associated with the surrounding control points (Figure 3). A variety of interpolation methods or “algorithms” are available for performing these estimations. A popular and simple technique called inverse distance weighting (IDW) varies the influence of surrounding points based on the inverse of the distance between the control point and the interpolated point. Another technique, called Kriging varies the influence of surrounding points based on a statistical analysis of their relative distance and direction.

Grid models are commonly used to produce color-coded contour maps by averaging the regions between cells (Figure 4). In fact, most computer contouring uses gridding as a preliminary, behind-the-scenes, step towards producing contours. There are, however, many more things that can be done with grids, including volumetrics.

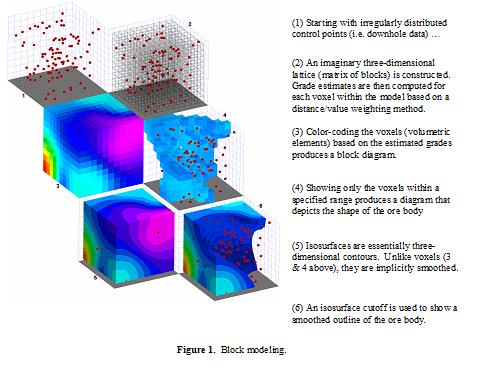
Three-Dimensional Block Modeling

Block modeling (Figure 1) is simply the three-dimensional version of gridding. The original data points typically consist of quantitative downhole data (e.g. geochemistry, ore grades, physical properties, etc.).

Block modeling.jpg

Software Versions

RockWare will discontinue their technical support and unlocking for any version prior to RockWorks15 after 12/31/2015.

RockWorks is currently on version 17 which was released on October 19, 2015. As of November 10, 2016, there have been 752 updates to the software since its development [1] RockWorks17 is the first 64bit version of the software. This new version also moves away from an MS Access database format to a native SQLite database format as well as the capability to utilize other database engines and Enterprise Database products.

The software is designed to analyze and visualize interval and point data such as stratigraphy, lithology, quantitative data, color intervals, fracture data and hydrology and aquifer data. The software is extensively used in the Geotechnical, Environmental, Mining, and Petroleum industries.

Some of the functions of the software include:

   ·Point Maps    ·Line Maps    ·Polygon Maps    ·Image Stacking    ·Flyovers    ·Cell Maps    ·Survey Maps
   · Contour Maps    · Claim Maps and Lease Maps    · Location Maps    · Polygon Maps    · Isopach Maps    · Strike and Dip Maps
   ·Litohology    ·Stratigraphy    ·Interval and Point data (e.g. interpolated plume concentration based on sample data)    ·Fence Diagrams 
   ·Statistics reports    ·Variography    ·Volumetrics (for any interpolated solid)    ·Unit Conversions and Calculation Tools
   ·Stereonets and Stereonet Maps    ·Rose Diagrams    ·Beta Intersections    ·Fault Interpretation Modeling    ·3D Faulting for Grid and Solid Modeling
   ·Piper Diagrams    ·Stiff Diagrams and Stiff Diagram Maps    ·Durov Diagrams    ·Ion Balance    ·Flow Line Interpretation     ·Hydrographs 

The software comes in 3 Levels of capability after download for a limited time, but even after the trial period is over it still serves as a reader of all the file types and has the Earth Apps capability which allows output of files to Google Earth via creation of .kml files. Licensing of the software can be standalone computer license or network licensing. [2] Software purchased from the company comes with a 30 minutes of phone support and email support from actual in-house geologists (not outsourced tech support) as long as your software is the current or previous version.

License Level:ReaderBasicStandardAdvanced
Single License Price: (as of 3/2/2015) [2] Free$1,500$3,000$5,000
or Annual Rental:Free$650$1,300$2,200
EarthAppsXXXX
RockPlot2DXXXX
RockPlot3DXXXX
ReportWorksXXXX
Utilities-XXX
Logs & Sections--XX
Borehole-Based Modeling--XX
RockWare GIS Link *---X

Revision History

Version:RockWorksRockWorksRockWorksRockWorksRockWorksRockWorksRockWorks
2002(discontinued)2004(discontinued)2006(discontinued)14(discontinued)151617
Release Date8/27/20014/6/20043/31/20063/31/20089/1/20097/1/201310/19/2015
QuarterStartEndItemsItemsItemsItemsItemsItemsItems
410/1/201912/31/2019--
37/1/20199/30/2019--
24/1/20196/30/201926
11/1/20193/31/201951
410/1/201812/31/201826
37/1/20189/30/201843
24/1/20186/30/201852
11/1/20183/31/201840
410/1/201712/31/201757
37/1/20179/30/201724
24/1/20176/30/201751
11/1/20173/31/201797
410/1/201612/31/2016116
37/1/20169/30/2016178
24/1/20166/30/201656
11/1/20163/31/2016278
410/1/201512/31/2015156
37/1/20159/30/20154610
24/1/20156/30/20152363
11/1/20153/31/20156915
410/1/201412/31/201470Development
37/1/20149/30/2014146
24/1/20146/30/201487
11/1/20143/31/201499
410/1/201312/31/2013152
37/1/20139/30/2013290
24/1/20136/30/20132Development
11/1/20133/31/20134
410/1/201212/31/201210
37/1/20129/30/20123
24/1/20126/30/20127
11/1/20123/31/20121
410/1/201112/31/20113
37/1/20119/30/201115
24/1/20116/30/201111
11/1/20113/31/201175
410/1/201012/31/201063
37/1/20109/30/201070
24/1/20106/30/201085
11/1/20103/31/2010102
410/1/200912/31/200980
37/1/20099/30/2009134
24/1/20096/30/200972
11/1/20093/31/200939
410/1/200812/31/200848143
37/1/20089/30/2008112Development
24/1/20086/30/2008159
11/1/20083/31/20087274
410/1/200712/31/2007123Development
37/1/20079/30/200776
24/1/20076/30/200771
11/1/20073/31/2007124
410/1/200612/31/200678
37/1/20069/30/200698
24/1/20066/30/2006137
11/1/20063/31/20062171
410/1/200512/31/200511Development
37/1/20059/30/200515
24/1/20056/30/200565
11/1/20053/31/200552
410/1/200412/31/200475
37/1/20049/30/200495
24/1/20046/30/2004115
11/1/20043/31/2004223
410/1/200312/31/2003172
37/1/20039/30/200323
24/1/20036/30/200341Development
11/1/20033/31/200352
410/1/200212/31/200240
37/1/20029/30/200261
24/1/20026/30/200242
11/1/20023/31/2002149
410/1/200112/31/2001114
37/1/200109/31/01169
24/1/20016/30/200195
11/1/20013/31/200181
Total:950844848950393919982752
Average:35/month28/month28/month35/month33/month16/month47/month20/month

For information about specific current version fixes: RockWorks Revision History [1]

Related Research Articles

Topography Study of the forms of land surfaces

Topography is the study of the forms and features of land surfaces. The topography of an area could refer to the surface forms and features themselves, or a description.

Voxel Element representing a value on a grid in three dimensional space

In 3D computer graphics, a voxel represents a value on a regular grid in three-dimensional space. As with pixels in a 2D bitmap, voxels themselves do not typically have their position explicitly encoded with their values. Instead, rendering systems infer the position of a voxel based upon its position relative to other voxels.

Visual programming language

In computing, a visual programming language (VPL) is any programming language that lets users create programs by manipulating program elements graphically rather than by specifying them textually. A VPL allows programming with visual expressions, spatial arrangements of text and graphic symbols, used either as elements of syntax or secondary notation. For example, many VPLs are based on the idea of "boxes and arrows", where boxes or other screen objects are treated as entities, connected by arrows, lines or arcs which represent relations.

Scientific visualization interdisciplinary branch of science concerned with presenting scientific data visually

Scientific visualization is an interdisciplinary branch of science concerned with the visualization of scientific phenomena. It is also considered a subset of computer graphics, a branch of computer science. The purpose of scientific visualization is to graphically illustrate scientific data to enable scientists to understand, illustrate, and glean insight from their data. Research into how people read and misread various types of visualizations is helping to determine what types and features of visualizations are most understandable and effective in conveying information.

Geologic map Special-purpose map

A geologic map is a special-purpose map made to show various geological features. Rock units or geologic strata are shown by color or symbols. Bedding planes and structural features such as faults, folds, are shown with strike and dip or trend and plunge symbols which give three-dimensional orientations features.

Volume rendering 3D rendering techniques

In scientific visualization and computer graphics, volume rendering is a set of techniques used to display a 2D projection of a 3D discretely sampled data set, typically a 3D scalar field.

Geologic modelling Applied science of creating computerized representations of portions of the Earths crust

Geologic modelling,geological modelling or geomodelling is the applied science of creating computerized representations of portions of the Earth's crust based on geophysical and geological observations made on and below the Earth surface. A geomodel is the numerical equivalent of a three-dimensional geological map complemented by a description of physical quantities in the domain of interest. Geomodelling is related to the concept of Shared Earth Model; which is a multidisciplinary, interoperable and updatable knowledge base about the subsurface.

Elevation Height of a geographic location above a fixed reference point

The elevation of a geographic location is its height above or below a fixed reference point, most commonly a reference geoid, a mathematical model of the Earth's sea level as an equipotential gravitational surface . The term elevation is mainly used when referring to points on the Earth's surface, while altitude or geopotential height is used for points above the surface, such as an aircraft in flight or a spacecraft in orbit, and depth is used for points below the surface.

Exploration geophysics is an applied branch of geophysics and economic geology, which uses physical methods, such as seismic, gravitational, magnetic, electrical and electromagnetic at the surface of the Earth to measure the physical properties of the subsurface, along with the anomalies in those properties. It is most often used to detect or infer the presence and position of economically useful geological deposits, such as ore minerals; fossil fuels and other hydrocarbons; geothermal reservoirs; and groundwater reservoirs.

Earthscope Earth science program exploring the structure of the North American continent

Earthscope was an National Science Foundation (NSF) funded earth science program that, from 2003-2018, used geological and geophysical techniques to explore the structure and evolution of the North American continent and to understand the processes controlling earthquakes and volcanoes. The project had three components: USArray, the Plate Boundary Observatory, and the San Andreas Fault Observatory at Depth. Organizations associated with the project included UNAVCO, the Incorporated Research Institutions for Seismology (IRIS), Stanford University, the United States Geological Survey (USGS) and National Aeronautics and Space Administration (NASA). Several international organizations also contributed to the initiative. EarthScope data are publicly accessible.

Petrophysics is the study of physical and chemical rock properties and their interactions with fluids.

Terrain cartography Representation of elevation on maps

Terrain cartography or relief mapping is the depiction of the shape of the surface of the Earth on a map, using one or more of several techniques that have been developed. Terrain or relief is an essential aspect of physical geography, and as such its portrayal presents a central problem in cartographic design, and more recently geographic information systems and geovisualization.

GeoModeller is a methodology and associated software tool for 3D geologic modelling developed by Bureau de Recherches Géologiques et Minières and Intrepid Geophysics over the last 20 years. The software is written using Open CASCADE in C++ for the engine, Java for the GUI and data are stored in extensible mark-up language XML. GeoModeller has started to revolutionise the working practices, data standards and products of a geological survey as a whole. The software takes into account all structural geology data such as dip, dip directions, strike, hingelines and axialtrace to build the geometry of geological units.

Specialized wind energy software applications aid in the development and operation of wind farms.

A data model in geographic information systems is a mathematical construct for representing geographic objects or surfaces as data. For example, the vector data model represents geography as collections of points, lines, and polygons; the raster data model represent geography as cell matrices that store numeric values; and the TIN data model represents geography as sets of contiguous, nonoverlapping triangles.

Golden Software LLC is a privately held, American company based in Golden, Colorado. It develops and markets a small catalog of GIS and scientific software.

Stoping

Stoping is the process of extracting the desired ore or other mineral from an underground mine, leaving behind an open space known as a stope. Stoping is used when the country rock is sufficiently strong not to collapse into the stope, although in most cases artificial support is also provided.

Mineral resource estimation is used to determine and define the ore tonnage and grade of a geological deposit, from the developed block model. There are different estimation methods used for different scenarios dependent upon the ore boundaries, geological deposit geometry, grade variability and the amount of time and money available. A typical resource estimation involves the construction of a geological and resource model with data from various sources. Depending on the nature of the information and whether the data is hard copy or computerized, the principal steps of computer resource estimation are:

  1. Creation, standardization and validation of the database.
  2. Section plotting and interactive geological modeling.
  3. Geostatistical analysis.
  4. Block modeling and block estimation.

EMIGMA is a geophysics interpretation software platform developed by Petros Eikon Incorporated for data processing, simulation, inversion and imaging as well as other associated tasks. The software focuses on non-seismic applications and operates only on the Windows operating system. It supports files standard to the industry, instrument native formats as well as files used by other software in the industry such as AutoCAD, Google Earth and Oasis montaj. There is a free version of EMIGMA called EMIGMA Basic developed to allow viewing of databases created by licensed users. It does not allow data simulation nor modeling nor data import. The software is utilized by geoscientists for exploration and delineating purposes in mining, oil and gas and groundwater as well as hydrologists, environmental engineers, archaeologists and academic institutions for research purposes. Principal contributors to the software are R. W. Groom, H. Wu, E. Vassilenko, R. Jia, C. Ottay and C. Alvarez.

References

  1. 1 2 "RockWorks Revision History". www.rockware.com.
  2. 1 2 "RockWorks".

Sources

RockWare, 2007, RockWorks/2006: Integrated geological data management, analysis, and visualization: RockWare Geoscientific Software Consulting & Training, accessed on March 12, 2007.

Software Review, RockWorks 2006, Clint Carney, Nebraska Public Power District and Colorado School of Mines, Southwest Hydrology March/April 2007.

F. Trabelsi, j. Tarhouni, A. Ben Mammou, and G. Ranieri, 2011. Environ Earth Sci. Special Issue, October 21, 2011. Springer. "GIS-based subsurface databases and 3-D geological modeling as a tool for the set up of hydrogeological framework:Nabeul–Hammamet coastal aquifer case study (Northeast Tunisia)" GIS-based subsurface databases and 3-D geological modeling as a tool for the set up of hydrogeological framework: Nabeul–Hammamet coastal aquifer case study (Northeast Tunisia) accessed on March 3, 2015.