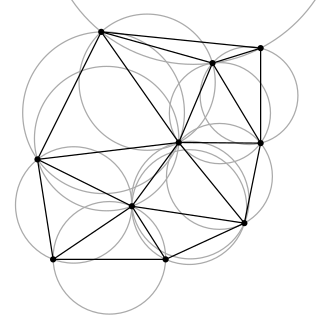
In computational geometry, a Delaunay triangulation or Delone triangulation of a set of points in the plane subdivides their convex hull into triangles whose circumcircles do not contain any of the points. This maximizes the size of the smallest angle in any of the triangles, and tends to avoid sliver triangles.

In geometry, a polyhedron is a three-dimensional figure with flat polygonal faces, straight edges and sharp corners or vertices.
In geometry, a tesseract or 4-cube is a four-dimensional hypercube, analogous to a two-dimensional square and a three-dimensional cube. Just as the perimeter of the square consists of four edges and the surface of the cube consists of six square faces, the hypersurface of the tesseract consists of eight cubical cells, meeting at right angles. The tesseract is one of the six convex regular 4-polytopes.

A voxel is a three-dimensional counterpart to a pixel. It represents a value on a regular grid in a three-dimensional space. Voxels are frequently used in the visualization and analysis of medical and scientific data. They are also commonly used in video games, both as a technological feature, as in Outcast, and a graphical style, which was popularised by Minecraft.

Ray casting is the methodological basis for 3D CAD/CAM solid modeling and image rendering. It is essentially the same as ray tracing for computer graphics where virtual light rays are "cast" or "traced" on their path from the focal point of a camera through each pixel in the camera sensor to determine what is visible along the ray in the 3D scene.

Scientific visualization is an interdisciplinary branch of science concerned with the visualization of scientific phenomena. It is also considered a subset of computer graphics, a branch of computer science. The purpose of scientific visualization is to graphically illustrate scientific data to enable scientists to understand, illustrate, and glean insight from their data. Research into how people read and misread various types of visualizations is helping to determine what types and features of visualizations are most understandable and effective in conveying information.

An octree is a tree data structure in which each internal node has exactly eight children. Octrees are most often used to partition a three-dimensional space by recursively subdividing it into eight octants. Octrees are the three-dimensional analog of quadtrees. The word is derived from oct + tree. Octrees are often used in 3D graphics and 3D game engines.

In scientific visualization and computer graphics, volume rendering is a set of techniques used to display a 2D projection of a 3D discretely sampled data set, typically a 3D scalar field.
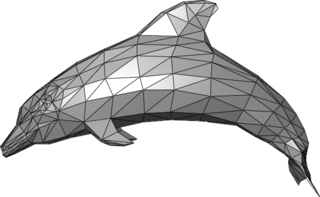
In 3D computer graphics and solid modeling, a polygon mesh is a collection of vertices, edges and faces that defines the shape of a polyhedral object's surface. It simplifies rendering, as in a wire-frame model. The faces usually consist of triangles, quadrilaterals (quads), or other simple convex polygons (n-gons). A polygonal mesh may also be more generally composed of concave polygons, or even polygons with holes.
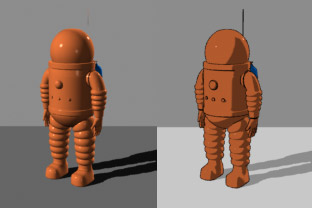
Non-photorealistic rendering (NPR) is an area of computer graphics that focuses on enabling a wide variety of expressive styles for digital art, in contrast to traditional computer graphics, which focuses on photorealism. NPR is inspired by other artistic modes such as painting, drawing, technical illustration, and animated cartoons. NPR has appeared in movies and video games in the form of cel-shaded animation as well as in scientific visualization, architectural illustration and experimental animation.

Marching cubes is a computer graphics algorithm, published in the 1987 SIGGRAPH proceedings by Lorensen and Cline, for extracting a polygonal mesh of an isosurface from a three-dimensional discrete scalar field. The applications of this algorithm are mainly concerned with medical visualizations such as CT and MRI scan data images, and special effects or 3-D modelling with what is usually called metaballs or other metasurfaces. The marching cubes algorithm is meant to be used for 3-D; the 2-D version of this algorithm is called the marching squares algorithm.

Marching tetrahedra is an algorithm in the field of computer graphics to render implicit surfaces. It clarifies a minor ambiguity problem of the marching cubes algorithm with some cube configurations. It was originally introduced in 1991.
In computer graphics, marching squares is an algorithm that generates contours for a two-dimensional scalar field. A similar method can be used to contour 2D triangle meshes.
In computer science, a level set is a data structure designed to represent discretely sampled dynamic level sets of functions.
Simplicial continuation, or piecewise linear continuation, is a one-parameter continuation method which is well suited to small to medium embedding spaces. The algorithm has been generalized to compute higher-dimensional manifolds by and.
In computer vision and computer graphics, 3D reconstruction is the process of capturing the shape and appearance of real objects. This process can be accomplished either by active or passive methods. If the model is allowed to change its shape in time, this is referred to as non-rigid or spatio-temporal reconstruction.
Visualization Library (VL) is an open source C++ middleware for 2D/3D graphics applications based on OpenGL 4, designed to develop portable applications for the Microsoft Windows, Linux and Mac OS X operating systems.

The Point Cloud Library (PCL) is an open-source library of algorithms for point cloud processing tasks and 3D geometry processing, such as occur in three-dimensional computer vision. The library contains algorithms for filtering, feature estimation, surface reconstruction, 3D registration, model fitting, object recognition, and segmentation. Each module is implemented as a smaller library that can be compiled separately. PCL has its own data format for storing point clouds - PCD, but also allows datasets to be loaded and saved in many other formats. It is written in C++ and released under the BSD license.
In scientific visualization the asymptotic decider is an algorithm developed by Nielson and Hamann in 1991 that creates isosurfaces from a given scalar field. It was proposed as an improvement to the marching cubes algorithm, which can produce some "bad" topology, but can also be considered an algorithm in its own right.

In three-dimensional hyperbolic geometry, an ideal polyhedron is a convex polyhedron all of whose vertices are ideal points, points "at infinity" rather than interior to three-dimensional hyperbolic space. It can be defined as the convex hull of a finite set of ideal points. An ideal polyhedron has ideal polygons as its faces, meeting along lines of the hyperbolic space.


