A typical 3D data set is a group of 2D slice images acquired by a CT, MRI, or MicroCTscanner.[2] Usually these are acquired in a regular pattern (e.g., one slice for each millimeter of depth) and usually have a regular number of image pixels in a regular pattern. This is an example of a regular volumetric grid, with each volume element, or voxel represented by a single value that is obtained by sampling the immediate area surrounding the voxel.
To render a 2D projection of the 3D data set, one first needs to define a camera in space relative to the volume. Also, one needs to define the opacity and color of every voxel. This is usually defined using an RGBA (for red, green, blue, alpha) transfer function that defines the RGBA value for every possible voxel value.
For example, a volume may be viewed by extracting isosurfaces (surfaces of equal values) from the volume and rendering them as polygonal meshes or by rendering the volume directly as a block of data. The marching cubes algorithm is a common technique for extracting an isosurface from volume data. Direct volume rendering is a computationally intensive task that may be performed in several ways.
Another method of volume rendering is Ray marching, a category of 3D computer graphics rendering techniques in which rays are traced step by step, subdividing each ray into smaller segments and sampling a function at each interval.
Scope
Types of presentations of CT scans, with two examples of volume rendering
Volume rendering is distinguished from thin slice tomography presentations, and is also generally distinguished from projections of 3D models, including maximum intensity projection.[3] Still, technically, all volume renderings become projections when viewed on a 2-dimensional display, making the distinction between projections and volume renderings a bit vague. Nevertheless, the epitomes of volume rendering models feature a mix of for example coloring[4] and shading[5] in order to create realistic and/or observable representations.
Direct volume rendering
A direct volume renderer[6][7][8] requires every sample value to be mapped to opacity and a color. This is done with a "transfer function" which can be a simple ramp, a piecewise linear function or an arbitrary table. Once converted to an RGBA color model (for red, green, blue, alpha) value, the composed RGBA result is projected on the corresponding pixel of the frame buffer. The way this is done depends on the rendering technique.
A combination of these techniques is possible. For instance, a shear warp implementation could use texturing hardware to draw the aligned slices in the off-screen buffer.
Volume Ray Casting. Crocodile mummy provided by the Phoebe A. Hearst Museum of Anthropology, UC Berkeley. CT data was acquired by Rebecca Fahrig, Department of Radiology, Stanford University, using a Siemens SOMATOM Definition, Siemens Healthcare. The image was rendered by Fovia's High Definition Volume Rendering® engine.
The technique of volume ray casting can be derived directly from the rendering equation.[9] It provides results of very high quality, usually considered to provide the best image quality. Volume ray casting is classified as image based volume rendering technique, as the computation emanates from the output image, not the input volume data as is the case with object based techniques. In this technique, a ray is generated for each desired image pixel. Using a simple camera model, the ray starts at the center of projection of the camera (usually the eye point) and passes through the image pixel on the imaginary image plane floating in between the camera and the volume to be rendered. The ray is clipped by the boundaries of the volume in order to save time. Then the ray is sampled at regular or adaptive intervals throughout the volume. The data is interpolated at each sample point, the transfer function applied to form an RGBA sample, the sample is composited onto the accumulated RGBA of the ray, and the process repeated until the ray exits the volume. The RGBA color is converted to an RGB color and deposited in the corresponding image pixel. The process is repeated for every pixel on the screen to form the completed image.[citation needed]
This is a technique which trades quality for speed. Here, every volume element is splatted, as Lee Westover said, like a snow ball, on to the viewing surface in back to front order. These splats are rendered as disks whose properties (color and transparency) vary diametrically in normal (Gaussian) manner. Flat disks and those with other kinds of property distribution are also used depending on the application.[10][11]
Shear warp
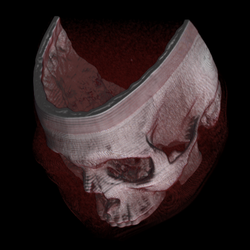
Example of a mouse skull (CT) rendering using the shear warp algorithm
The shear warp approach to volume rendering was developed by Cameron and Undrill, popularized by Philippe Lacroute and Marc Levoy.[12] In this technique, the viewing transformation is transformed such that the nearest face of the volume becomes axis aligned with an off-screen image data buffer with a fixed scale of voxels to pixels. The volume is then rendered into this buffer using the far more favorable memory alignment and fixed scaling and blending factors. Once all slices of the volume have been rendered, the buffer is then warped into the desired orientation and scaled in the displayed image.[citation needed]
This technique is relatively fast in software at the cost of less accurate sampling and potentially worse image quality compared to ray casting. There is memory overhead for storing multiple copies of the volume, for the ability to have near axis aligned volumes. This overhead can be mitigated using run length encoding.[citation needed]
Many 3D graphics systems use texture mapping to apply images, or textures, to geometric objects. Commodity PC graphics cards are fast at texturing and can efficiently render slices of a 3D volume, with real time interaction capabilities. WorkstationGPUs are even faster, and are the basis for much of the production volume visualization used in medical imaging, oil and gas, and other markets (2007). In earlier years, dedicated 3D texture mapping systems were used on graphics systems such as Silicon GraphicsInfiniteReality, HP Visualize FX graphics accelerator, and others. This technique was first described by Bill Hibbard and Dave Santek.[13]
These slices can either be aligned with the volume and rendered at an angle to the viewer, or aligned with the viewing plane and sampled from unaligned slices through the volume. Graphics hardware support for 3D textures is needed for the second technique.[citation needed]
Volume aligned texturing produces images of reasonable quality. The image quality degrades with coarse slice counts, though there is often a noticeable transition when the volume is rotated.[14]
Hardware-accelerated volume rendering
Due to the extremely parallel nature of direct volume rendering, special purpose volume rendering hardware was a rich research topic before GPU volume rendering became fast enough. The most widely cited technology was the VolumePro real-time ray-casting system, developed by Hanspeter Pfister and scientists at Mitsubishi Electric Research Laboratories,[15] which used high memory bandwidth and brute force to render using the ray casting algorithm. The technology was transferred to TeraRecon, Inc. and two generations of ASICs were produced and sold. The VP1000[16] was released in 2002 and the VP2000 in 2007.[17]
Pixel shaders are able to read and write randomly from video memory and perform some basic mathematical and logical calculations. These SIMD processors were used to perform general calculations such as rendering polygons and signal processing. In recent GPU generations, the pixel shaders now are able to function as MIMD processors (now able to independently branch) utilizing up to 1 GB of texture memory with floating point formats. With such power, virtually any algorithm with steps that can be performed in parallel, such as volume ray casting or tomographic reconstruction, can be performed with tremendous acceleration. The programmable pixel shaders can be used to simulate variations in the characteristics of lighting, shadow, reflection, emissive color and so forth. Such simulations can be written using high level shading languages.[citation needed]
The performance improvements provided by GPU processing can be complemented by CPU parallelization. Hybrid CPU-GPU parallel computing models combined with parallel and distributed computing techniques can be used to improve the runtime performance of quality-diversity volume rendering frameworks that rely on evolutionary algorithms to select and analyze candidate solutions.[18]
Optimization techniques
The primary goal of optimization is to skip as much of the volume as possible. A typical medical data set can be 1 GB in size. To render that at 30 frame/s requires an extremely fast memory bus. Skipping voxels means less information needs to be processed.[citation needed]
Empty space skipping
Often, a volume rendering system will have a system for identifying regions of the volume containing no visible material. This information can be used to avoid rendering these transparent regions.[19]
Early ray termination
This is a technique used when the volume is rendered in front to back order. For a ray through a pixel, once sufficient dense material has been encountered, further samples will make no significant contribution to the pixel and so may be neglected.[citation needed]
Octree and BSP space subdivision
The use of hierarchical structures such as octree and BSP-tree could be very helpful for both compression of volume data and speed optimization of volumetric ray casting process.[citation needed]
Volume segmentation
Volume segmentation include automatic bone removal, such as used in the right image in this CT angiography.Volume segmentation of a 3D-rendered CT scan of the thorax: The anterior thoracic wall, the airways and the pulmonary vessels anterior to the root of the lung have been digitally removed in order to visualize thoracic contents: - blue: pulmonary arteries - red: pulmonary veins (and also the abdominal wall) - yellow: the mediastinum - violet: the diaphragmVisualization of the inner organs from the segmented Visible Human data set rendered by Voxel-Man, aside with a drawing of Leonardo da Vinci (1998)
Image segmentation is a manual or automatic procedure that can be used to section out large portions of the volume that one considers uninteresting before rendering, the amount of calculations that have to be made by ray casting or texture blending can be significantly reduced. This reduction can be as much as from O(n) to O(log n) for n sequentially indexed voxels. Volume segmentation also has significant performance benefits for other ray tracing algorithms. Volume segmentation can subsequently be used to highlight or expose structures of interest.[20]
Multiple and adaptive resolution representation
By representing less interesting regions of the volume in a coarser resolution, the data input overhead can be reduced. On closer observation, the data in these regions can be populated either by reading from memory or disk, or by interpolation. The coarser resolution volume is resampled to a smaller size in the same way as a 2D mipmap image is created from the original. These smaller volume are also used by themselves while rotating the volume to a new orientation.[citation needed]
Pre-integrated volume rendering
Pre-integrated volume rendering[21] is a method that can reduce sampling artifacts by pre-computing much of the required data. It is especially useful in hardware-accelerated applications[22][23] because it improves quality without a large performance impact. Unlike most other optimizations, this does not skip voxels. Rather it reduces the number of samples needed to accurately display a region of voxels. The idea is to render the intervals between the samples instead of the samples themselves. This technique captures rapidly changing material, for example the transition from muscle to bone with much less computation.[citation needed]
For a complete display view, only one voxel per pixel (the front one) is required to be shown (although more can be used for smoothing the image), if animation is needed, the front voxels to be shown can be cached and their location relative to the camera can be recalculated as it moves. Where display voxels become too far apart to cover all the pixels, new front voxels can be found by ray casting or similar, and where two voxels are in one pixel, the front one can be kept.[citation needed]
List of related software
Open source
3D Slicer – a software package for scientific visualization and image analysis
ClearVolume – a GPU ray-casting based, live 3D visualization library designed for high-end volumetric light sheet microscopes.
ParaView – a cross-platform, large data analysis and visualization application. ParaView users can quickly build visualizations to analyze their data using qualitative and quantitative techniques. ParaView is built on VTK (below).
Studierfenster (StudierFenster) – a free, non-commercial Open Science client/server-based Medical Imaging Processing (MIP) online framework.
Vaa3D – a 3D, 4D and 5D volume rendering and image analysis platform for gigabytes and terabytes of large images (based on OpenGL) especially in the microscopy image field. Also cross-platform with Mac, Windows, and Linux versions. Include a comprehensive plugin interface and 100 plugins for image analysis. Also render multiple types of surface objects.
VisIt – a cross-platform interactive parallel visualization and graphical analysis tool for viewing scientific data.
Voreen – a cross-platform rapid application development framework for the interactive visualization and analysis of multi-modal volumetric data sets. It provides GPU-based volume rendering and data analysis techniques
VTK – a general-purpose C++ toolkit for data processing, visualization, 3D interaction, computational geometry, with Python and Java bindings. Also, VTK.js provides a JavaScript implementation.
Commercial
Amira – a 3D visualization and analysis software for scientists and researchers (in life sciences and biomedical)
Imaris – a scientific software module that delivers all the necessary functionality for data management, visualization, analysis, segmentation and interpretation of 3D and 4D microscopy datasets
MeVisLab – cross-platform software for medical image processing and visualization (based on OpenGL and Open Inventor)
Open Inventor – a high-level 3D API for 3D graphics software development (C++, .NET, Java)
ScanIP – an image processing and image-based meshing platform that can render scan data (MRI, CT, Micro-CT...) in 3D directly after import.
Example of a fly brain rendered with its compartments' surface models using Vaa3D
tomviz – a 3D visualization platform for scientists and researchers that can utilize Python scripts for advanced 3D data processing.
VoluMedic – a volume slicing and rendering software
↑Page 185 in Leif Kobbelt (2006). Vision, Modeling, and Visualization 2006: Proceedings, November 22-24. IOS Press. ISBN978-3-89838-081-2.
↑Levoy, M. (May 1988). "Display of surfaces from volume data". IEEE Computer Graphics and Applications. 8 (3): 29–37. doi:10.1109/38.511.
↑Drebin, Robert A.; Carpenter, Loren; Hanrahan, Pat (August 1988). "Volume rendering". ACM SIGGRAPH Computer Graphics. 22 (4): 65–74. doi:10.1145/378456.378484.
↑Drebin, Robert A.; Carpenter, Loren; Hanrahan, Pat (1988). "Volume rendering". Proceedings of the 15th annual conference on Computer graphics and interactive techniques. pp.65–74. doi:10.1145/54852.378484. ISBN978-0-89791-275-4.
↑Yuan, Youwei; Ye, Wenlong (2009). "Interactive Ray Tracing for Volume Visualization and 3D Rendering Using Neural Networks". 2009 WRI Global Congress on Intelligent Systems. pp.278–281. doi:10.1109/gcis.2009.348. ISBN978-0-7695-3571-5.
↑Huang, Jian (Spring 2002). "Splatting"(PPT). Retrieved 5 August 2011.
↑Lacroute, Philippe; Levoy, Marc (1994). "Fast volume rendering using a shear-warp factorization of the viewing transformation". Proceedings of the 21st annual conference on Computer graphics and interactive techniques - SIGGRAPH '94. pp.451–458. doi:10.1145/192161.192283. ISBN978-0-89791-667-7.
↑Hibbard, William; Santek, David (1989). "Interactivity is the key". Proceedings of the 1989 Chapel Hill workshop on Volume visualization. pp.39–43. doi:10.1145/329129.329356. ISBN978-1-4503-7322-7.
↑Pfister, Hanspeter; Hardenbergh, Jan; Knittel, Jim; Lauer, Hugh; Seiler, Larry (1999). "The VolumePro real-time ray-casting system". Proceedings of the 26th annual conference on Computer graphics and interactive techniques - SIGGRAPH '99. pp.251–260. doi:10.1145/311535.311563. ISBN978-0-201-48560-8.
↑Wu, Yin; Bhatia, Vishal; Lauer, Hugh; Seiler, Larry (2003). "Shear-image order ray casting volume rendering". Proceedings of the 2003 symposium on Interactive 3D graphics. pp.152–162. doi:10.1145/641480.641510. ISBN978-1-58113-645-6.
↑TeraRecon (7 December 2006). "Product Announcement". healthimaging.com. Retrieved 27 August 2018.
↑Butincu, Cristian Nicolae; Gavrilescu, Marius (2024). "CPU-GPU Parallelism Applied to Quality-Diversity Volume Rendering". 2024 28th International Conference on System Theory, Control and Computing (ICSTCC). 28th International Conference on System Theory, Control and Computing (ICSTCC). pp.576–581. doi:10.1109/ICSTCC62912.2024.10744686. ISSN2473-5698. S2CID273981090.
↑Sherbondy, A.; Houston, M.; Napel, S. (2003). "Fast volume segmentation with simultaneous visualization using programmable graphics hardware". IEEE Transactions on Ultrasonics, Ferroelectrics and Frequency Control. pp.171–176. doi:10.1109/VISUAL.2003.1250369. ISBN978-0-7803-8120-9.
↑Max, Nelson; Hanrahan, Pat; Crawfis, Roger (1990). "Area and volume coherence for efficient visualization of 3D scalar functions". Proceedings of the 1990 workshop on Volume visualization. pp.27–33. doi:10.1145/99307.99315. ISBN978-0-89791-417-8. OSTI6397749.
↑Engel, Klaus; Kraus, Martin; Ertl, Thomas (2001). "High-quality pre-integrated volume rendering using hardware-accelerated pixel shading". Proceedings of the ACM SIGGRAPH/EUROGRAPHICS workshop on Graphics hardware. pp.9–16. doi:10.1145/383507.383515. ISBN978-1-58113-407-0.
volume shader – An interactive online demonstration of volume rendering and transfer functions.
This page is based on this Wikipedia article Text is available under the CC BY-SA 4.0 license; additional terms may apply. Images, videos and audio are available under their respective licenses.