Scanning of an object or environment to collect data on its shape
Making a 3D model of a Viking belt buckle using a hand held VIUscan 3D laser scanner
3D scanning is the process of analyzing a real-world object or environment to collect three dimensional data of its shape and possibly its appearance (e.g. color). The collected data can then be used to construct digital 3D models.
The purpose of a 3D scanner is usually to create a 3D model. This 3D model consists of a polygon mesh or point cloud of geometric samples on the surface of the subject. These points can then be used to extrapolate the shape of the subject (a process called reconstruction). If color information is collected at each point, then the colors or textures on the surface of the subject can also be determined.
3D scanners share several traits with cameras. Like most cameras, they have a cone-like field of view, and like cameras, they can only collect information about surfaces that are not obscured. While a camera collects color information about surfaces within its field of view, a 3D scanner collects distance information about surfaces within its field of view. The "picture" produced by a 3D scanner describes the distance to a surface at each point in the picture. This allows the three dimensional position of each point in the picture to be identified.[7]
In some situations, a single scan will not produce a complete model of the subject. Multiple scans, from different directions are usually helpful to obtain information about all sides of the subject. These scans have to be brought into a common reference system, a process that is usually called alignment or registration, and then merged to create a complete 3D model. This whole process, going from the single range map to the whole model, is usually known as the 3D scanning pipeline.[8][9][10][11][12]
Technology
There are a variety of technologies for digitally acquiring the shape of a 3D object. The techniques work with most or all sensor types including optical, acoustic, laser scanning,[13] radar, thermal,[14] and seismic.[15][16] 3D scan technologies can be split in 2 categories: contact and non-contact. Non-contact solutions can be further divided into two main categories, active and passive.[17] There are a variety of technologies that fall under each of these categories.
Contact 3D scanners work by physically probing (touching) the part and recording the position of the sensor as the probe moves around the part.
There are two main types of contact 3D scanners:
Coordinate measuring machines (CMMs) which traditionally have 3 perpendicular moving axis with a touch probe mounted on the Z axis. As the touch probe moves around the part, sensors on each axis record the position to generate XYZ coordinates. Modern CMMs are 5 axis systems, with the two extra axes provided by pivoting sensor heads. CMMs are the most accurate form of 3D measurement achieving micron precision. The greatest advantage of a CMM after accuracy is that it can be run in autonomous (CNC) mode or as a manual probing system. The disadvantages of CMMs are their upfront cost and the technical knowledge required to operate them.
Articulated Arms which generally have multiple segments with polar sensors on each joint. As per the CMM, as the articulated arm moves around the part sensors record their position and the location of the end of the arm is calculated using complex math and the wrist rotation angle and hinge angle of each joint. While not usually as accurate as CMMs, articulated arms still achieve high accuracy and are cheaper and slightly easier to use. They do not usually have CNC options. Companies such as FARO Technologies and Hexagon AB are notable developers of this technology.[18]
Both modern CMMs and Articulated Arms can also be fitted with non-contact laser scanners instead of touch probes.
Non-contact active
Active scanners emit some kind of radiation or light and detect its reflection or radiation passing through object in order to probe an object or environment. Possible types of emissions used include light, ultrasound or x-ray.
Time-of-flight
This lidar scanner may be used to scan buildings, rock formations, etc., to produce a 3D model. The lidar can aim its laser beam in a wide range: its head rotates horizontally, a mirror flips vertically. The laser beam is used to measure the distance to the first object on its path.
The time-of-flight 3D laser scanner is an active scanner that uses laser light to probe the subject. At the heart of this type of scanner is a time-of-flight laser range finder. The laser range finder finds the distance of a surface by timing the round-trip time of a pulse of light. A laser is used to emit a pulse of light and the amount of time before the reflected light is seen by a detector is measured. Since the speed of light is known, the round-trip time determines the travel distance of the light, which is twice the distance between the scanner and the surface. If is the round-trip time, then distance is equal to . The accuracy of a time-of-flight 3D laser scanner depends on how precisely we can measure the time: 3.3 picoseconds (approx.) is the time taken for light to travel 1 millimetre.
The laser range finder only detects the distance of one point in its direction of view. Thus, the scanner scans its entire field of view one point at a time by changing the range finder's direction of view to scan different points. The view direction of the laser range finder can be changed either by rotating the range finder itself, or by using a system of rotating mirrors. The latter method is commonly used because mirrors are much lighter and can thus be rotated much faster and with greater accuracy. Typical time-of-flight 3D laser scanners can measure the distance of 10,000~100,000 points every second.
Time-of-flight devices are also available in a 2D configuration. This is referred to as a time-of-flight camera.[19]
Triangulation
Principle of a laser triangulation sensor. Two object positions are shown.
Triangulation based 3D laser scanners are also active scanners that use laser light to probe the environment. With respect to time-of-flight 3D laser scanner the triangulation laser shines a laser on the subject and exploits a camera to look for the location of the laser dot. Depending on how far away the laser strikes a surface, the laser dot appears at different places in the camera's field of view. This technique is called triangulation because the laser dot, the camera and the laser emitter form a triangle. The length of one side of the triangle, the distance between the camera and the laser emitter is known. The angle of the laser emitter corner is also known. The angle of the camera corner can be determined by looking at the location of the laser dot in the camera's field of view. These three pieces of information fully determine the shape and size of the triangle and give the location of the laser dot corner of the triangle.[20] In most cases a laser stripe, instead of a single laser dot, is swept across the object to speed up the acquisition process. The use of triangulation to measure distances dates to antiquity.
Strengths and weaknesses
Time-of-flight range finders are capable of operating over long distances on the order of kilometres. These scanners are thus suitable for scanning large structures like buildings or geographic features. A disadvantage is that, due to the high speed of light, measuring the round-trip time is difficult and so the accuracy of the distance measurement is relatively low, on the order of millimetres.
Triangulation range finders, on the other hand, have a range of usually limited to a few meters for reasonably sized devices, but their accuracy is relatively high. The accuracy of triangulation range finders is on the order of tens of micrometers.
Time-of-flight scanners' accuracy can be lost when the laser hits the edge of an object because the information that is sent back to the scanner is from two different locations for one laser pulse. The coordinate relative to the scanner's position for a point that has hit the edge of an object will be calculated based on an average and therefore will put the point in the wrong place. When using a high resolution scan on an object the chances of the beam hitting an edge are increased and the resulting data will show noise just behind the edges of the object. Scanners with a smaller beam width will help to solve this problem but will be limited by range as the beam width will increase over distance. Software can also help by determining that the first object to be hit by the laser beam should cancel out the second.
At a rate of 10,000 sample points per second, low resolution scans can take less than a second, but high resolution scans, requiring millions of samples, can take minutes for some time-of-flight scanners. The problem this creates is distortion from motion. Since each point is sampled at a different time, any motion in the subject or the scanner will distort the collected data. Thus, it is usually necessary to mount both the subject and the scanner on stable platforms and minimise vibration. Using these scanners to scan objects in motion is very difficult.
Recently, there has been research on compensating for distortion from small amounts of vibration[21] and distortions due to motion and/or rotation.[22]
Short-range laser scanners can not usually encompass a depth of field more than 1 meter.[23] When scanning in one position for any length of time slight movement can occur in the scanner position due to changes in temperature. If the scanner is set on a tripod and there is strong sunlight on one side of the scanner then that side of the tripod will expand and slowly distort the scan data from one side to another. Some laser scanners have level compensators built into them to counteract any movement of the scanner during the scan process.
Conoscopic holography
In a conoscopic system, a laser beam is projected onto the surface and then the immediate reflection along the same ray-path are put through a conoscopic crystal and projected onto a CCD. The result is a diffraction pattern, that can be frequency analyzed to determine the distance to the measured surface. The main advantage with conoscopic holography is that only a single ray-path is needed for measuring, thus giving an opportunity to measure for instance the depth of a finely drilled hole.[24]
Hand-held laser scanners
Hand-held laser scanners create a 3D image through the triangulation mechanism described above: a laser dot or line is projected onto an object from a hand-held device and a sensor (typically a charge-coupled device or position sensitive device) measures the distance to the surface. Data is collected in relation to an internal coordinate system and therefore to collect data where the scanner is in motion the position of the scanner must be determined. The position can be determined by the scanner using reference features on the surface being scanned (typically adhesive reflective tabs, but natural features have been also used in research work)[25][26] or by using an external tracking method. External tracking often takes the form of a laser tracker (to provide the sensor position) with integrated camera (to determine the orientation of the scanner) or a photogrammetric solution using 3 or more cameras providing the complete six degrees of freedom of the scanner. Both techniques tend to use infraredlight-emitting diodes attached to the scanner which are seen by the camera(s) through filters providing resilience to ambient lighting.[27]
Data is collected by a computer and recorded as data points within three-dimensional space, with processing this can be converted into a triangulated mesh and then a computer-aided design model, often as non-uniform rational B-spline surfaces. Hand-held laser scanners can combine this data with passive, visible-light sensors — which capture surface textures and colors — to build (or "reverse engineer") a full 3D model.
A structured-light 3D scanner (Matterport Pro2) capturing an architectural interior. The device rotates on a tripod to project light patterns and build a 3D model of the surrounding space.
Structured-light 3D scanners project a pattern of light on the subject and look at the deformation of the pattern on the subject. The pattern is projected onto the subject using either an LCD projector or other stable light source. A camera, offset slightly from the pattern projector, looks at the shape of the pattern and calculates the distance of every point in the field of view.
Structured-light scanning is still a very active area of research with many research papers published each year. Perfect maps have also been proven useful as structured light patterns that solve the correspondence problem and allow for error detection and error correction.[28]
The advantage of structured-light 3D scanners is speed and precision. Instead of scanning one point at a time, structured light scanners scan multiple points or the entire field of view at once. Scanning an entire field of view in a fraction of a second reduces or eliminates the problem of distortion from motion. Some existing systems are capable of scanning moving objects in real-time.
A real-time scanner using digital fringe projection and phase-shifting technique (certain kinds of structured light methods) was developed, to capture, reconstruct, and render high-density details of dynamically deformable objects (such as facial expressions) at 40 frames per second.[29] Recently, another scanner has been developed. Different patterns can be applied to this system, and the frame rate for capturing and data processing achieves 120 frames per second. It can also scan isolated surfaces, for example two moving hands.[30] By utilising the binary defocusing technique, speed breakthroughs have been made that could reach hundreds[31] to thousands of frames per second.[32]
Modulated light
Modulated light 3D scanners shine a continually changing light at the subject. Usually the light source simply cycles its amplitude in a sinusoidal pattern. A camera detects the reflected light and the amount the pattern is shifted by determines the distance the light travelled. Modulated light also allows the scanner to ignore light from sources other than a laser, so there is no interference.
Volumetric techniques
Medical
Computed tomography (CT) is a medical imaging method which generates a three-dimensional image of the inside of an object from a large series of two-dimensional X-ray images; magnetic resonance imaging (MRI) is another similar medical imaging technique, only MRI provides much greater contrast between the different soft tissues of the body than computed tomography (CT) does, making it especially useful in neurological (brain), musculoskeletal, cardiovascular, and oncological (cancer) imaging. These techniques produce a discrete 3D volumetric representation that can be directly visualised, manipulated or converted to traditional 3D surface by mean of isosurface extraction algorithms.
Industrial
Although most common in medicine, industrial computed tomography, microtomography and MRI are also used in other fields for acquiring a digital representation of an object and its interior, such as non destructive materials testing, reverse engineering, or studying biological and paleontological specimens.
Non-contact passive
Passive 3D imaging solutions do not emit any kind of radiation themselves, but instead rely on detecting reflected ambient radiation. Most solutions of this type detect visible light because it is a readily available ambient radiation. Other types of radiation, such as infrared could also be used. Passive methods can be very cheap, because in most cases they do not need particular hardware but simple digital cameras.
Stereoscopic systems usually employ two video cameras, slightly apart, looking at the same scene. By analysing the slight differences between the images seen by each camera, it is possible to determine the distance at each point in the images. This method is based on the same principles driving human stereoscopic vision.[33]
Photometric systems usually use a single camera, but take multiple images under varying lighting conditions. These techniques attempt to invert the image formation model in order to recover the surface orientation at each pixel.
Silhouette techniques use outlines created from a sequence of photographs around a three-dimensional object against a well contrasted background. These silhouettes are extruded and intersected to form the visual hull approximation of the object. With these approaches some concavities of an object (like the interior of a bowl) cannot be detected.
Images taken from multiple perspectives such as a fixed camera array can be taken of a subject for a photogrammetric reconstruction pipeline to generate a 3D mesh or point cloud.
Photogrammetry provides reliable information about 3D shapes of physical objects based on analysis of photographic images. The resulting 3D data is typically provided as a 3D point cloud, 3D mesh or 3D points.[34] Modern photogrammetry software applications automatically analyze a large number of digital images for 3D reconstruction, however manual interaction may be required if the software cannot automatically determine the 3D positions of the camera in the images which is an essential step in the reconstruction pipeline. Various software packages are available including PhotoModeler, Geodetic Systems, Autodesk ReCap, RealityCapture and Agisoft Metashape (see comparison of photogrammetry software).
Close range photogrammetry typically uses a handheld camera such as a DSLR with a fixed focal length lens to capture images of objects for 3D reconstruction.[35] Subjects include smaller objects such as a building facade, vehicles, sculptures, rocks, and shoes.
Camera Arrays can be used to generate 3D point clouds or meshes of live objects such as people or pets by synchronizing multiple cameras to photograph a subject from multiple perspectives at the same time for 3D object reconstruction.[36]
Wide angle photogrammetry can be used to capture the interior of buildings or enclosed spaces using a wide angle lens camera such as a 360 camera.
Aerial photogrammetry uses aerial images acquired by satellite, commercial aircraft or UAV drone to collect images of buildings, structures and terrain for 3D reconstruction into a point cloud or mesh.
Acquisition from acquired sensor data
Semi-automatic building extraction from lidar data and high-resolution images is also a possibility. Again, this approach allows modelling without physically moving towards the location or object.[37] From airborne lidar data, digital surface model (DSM) can be generated and then the objects higher than the ground are automatically detected from the DSM. Based on general knowledge about buildings, geometric characteristics such as size, height and shape information are then used to separate the buildings from other objects. The extracted building outlines are then simplified using an orthogonal algorithm to obtain better cartographic quality. Watershed analysis can be conducted to extract the ridgelines of building roofs. The ridgelines as well as slope information are used to classify the buildings per type. The buildings are then reconstructed using three parametric building models (flat, gabled, hipped).[38]
Acquisition from on-site sensors
Lidar and other terrestrial laser scanning technology[39] offers the fastest, automated way to collect height or distance information. lidar or laser for height measurement of buildings is becoming very promising.[40] Commercial applications of both airborne lidar and ground laser scanning technology have proven to be fast and accurate methods for building height extraction. The building extraction task is needed to determine building locations, ground elevation, orientations, building size, rooftop heights, etc. Most buildings are described to sufficient details in terms of general polyhedra, i.e., their boundaries can be represented by a set of planar surfaces and straight lines. Further processing such as expressing building footprints as polygons is used for data storing in GIS databases.
Using laser scans and images taken from ground level and a bird's-eye perspective, Fruh and Zakhor present an approach to automatically create textured 3D city models. This approach involves registering and merging the detailed facade models with a complementary airborne model. The airborne modeling process generates a half-meter resolution model with a bird's-eye view of the entire area, containing terrain profile and building tops. Ground-based modeling process results in a detailed model of the building facades. Using the DSM obtained from airborne laser scans, they localize the acquisition vehicle and register the ground-based facades to the airborne model by means of Monte Carlo localization (MCL). Finally, the two models are merged with different resolutions to obtain a 3D model.
Using an airborne laser altimeter, Haala, Brenner and Anders combined height data with the existing ground plans of buildings. The ground plans of buildings had already been acquired either in analog form by maps and plans or digitally in a 2D GIS. The project was done in order to enable an automatic data capture by the integration of these different types of information. Afterwards virtual reality city models are generated in the project by texture processing, e.g. by mapping of terrestrial images. The project demonstrated the feasibility of rapid acquisition of 3D urban GIS. Ground plans proved are another very important source of information for 3D building reconstruction. Compared to results of automatic procedures, these ground plans proved more reliable since they contain aggregated information which has been made explicit by human interpretation. For this reason, ground plans, can considerably reduce costs in a reconstruction project. An example of existing ground plan data usable in building reconstruction is the Digital Cadastral map, which provides information on the distribution of property, including the borders of all agricultural areas and the ground plans of existing buildings. Additionally information as street names and the usage of buildings (e.g. garage, residential building, office block, industrial building, church) is provided in the form of text symbols. At the moment the Digital Cadastral map is built up as a database covering an area, mainly composed by digitizing preexisting maps or plans.
Cost
Terrestrial laser scan devices (pulse or phase devices) + processing software generally start at a price of €150,000. Some less precise devices (as the Trimble VX) cost around €75,000.
Terrestrial lidar systems cost around €300,000.
Systems using regular still cameras mounted on RC helicopters (Photogrammetry) are also possible, and cost around €25,000. Systems that use still cameras with balloons are even cheaper (around €2,500), but require additional manual processing. As the manual processing takes around one month of labor for every day of taking pictures, this is still an expensive solution in the long run.
Obtaining satellite images is also an expensive endeavor. High resolution stereo images (0.5m resolution) cost around €11,000. Image satellites include Quikbird and Ikonos. High resolution monoscopic images cost around €5,500. Somewhat lower resolution images (e.g. from the CORONA satellite, with a 2m resolution) cost around €1,000 per 2 images. Note that Google Earth images are too low in resolution to make an accurate 3D model.[41]
The point clouds produced by 3D scanners and 3D imaging can be used directly for measurement and visualisation in the architecture and construction world.
From models
Most applications, however, use instead polygonal 3D models, NURBS surface models, or editable feature-based CAD models (aka solid models).
Polygon mesh models: In a polygonal representation of a shape, a curved surface is modeled as many small faceted flat surfaces (think of a sphere modeled as a disco ball). Polygon models—also called Mesh models, are useful for visualisation, for some CAM (i.e., machining), but are generally "heavy" ( i.e., very large data sets), and are relatively un-editable in this form. Reconstruction to polygonal model involves finding and connecting adjacent points with straight lines in order to create a continuous surface. Many applications, both free and nonfree, are available for this purpose (e.g. GigaMesh, MeshLab, PointCab, kubit PointCloud for AutoCAD, Reconstructor, imagemodel, PolyWorks, Rapidform, Geomagic, Imageware, Rhino 3D etc.).
Surface models: The next level of sophistication in modeling involves using a quilt of curved surface patches to model the shape. These might be NURBS, TSplines or other curved representations of curved topology. Using NURBS, the spherical shape becomes a true mathematical sphere. Some applications offer patch layout by hand but the best in class offer both automated patch layout and manual layout. These patches have the advantage of being lighter and more manipulable when exported to CAD. Surface models are somewhat editable, but only in a sculptural sense of pushing and pulling to deform the surface. This representation lends itself well to modelling organic and artistic shapes. Providers of surface modellers include Rapidform, Geomagic, Rhino 3D, Maya, T Splines etc.
Solid CAD models: From an engineering/manufacturing perspective, the ultimate representation of a digitised shape is the editable, parametric CAD model. In CAD, the sphere is described by parametric features which are easily edited by changing a value (e.g., centre point and radius).
These CAD models describe not simply the envelope or shape of the object, but CAD models also embody the "design intent" (i.e., critical features and their relationship to other features). An example of design intent not evident in the shape alone might be a brake drum's lug bolts, which must be concentric with the hole in the centre of the drum. This knowledge would drive the sequence and method of creating the CAD model; a designer with an awareness of this relationship would not design the lug bolts referenced to the outside diameter, but instead, to the center. A modeler creating a CAD model will want to include both Shape and design intent in the complete CAD model.
Vendors offer different approaches to getting to the parametric CAD model. Some export the NURBS surfaces and leave it to the CAD designer to complete the model in CAD (e.g., Geomagic, Imageware, Rhino 3D). Others use the scan data to create an editable and verifiable feature based model that is imported into CAD with full feature tree intact, yielding a complete, native CAD model, capturing both shape and design intent (e.g. Geomagic, Rapidform). For instance, the market offers various plug-ins for established CAD-programs, such as SolidWorks. Xtract3D, DezignWorks and Geomagic for SolidWorks allow manipulating a 3D scan directly inside SolidWorks. Still other CAD applications are robust enough to manipulate limited points or polygon models within the CAD environment (e.g., CATIA, AutoCAD, Revit).
From a set of 2D slices
3D reconstruction of the brain and eyeballs from CT scanned DICOM images. In this image, areas with the density of bone or air were made transparent, and the slices stacked up in an approximate free-space alignment. The outer ring of material around the brain are the soft tissues of skin and muscle on the outside of the skull. A black box encloses the slices to provide the black background. Since these are simply 2D images stacked up, when viewed on edge the slices disappear since they have effectively zero thickness. Each DICOM scan represents about 5mm of material averaged into a thin slice.
CT, industrial CT, MRI, or micro-CT scanners do not produce point clouds but a set of 2D slices (each termed a "tomogram") which are then 'stacked together' to produce a 3D representation. There are several ways to do this depending on the output required:
Volume rendering: Different parts of an object usually have different threshold values or greyscale densities. From this, a 3-dimensional model can be constructed and displayed on screen. Multiple models can be constructed from various thresholds, allowing different colors to represent each component of the object. Volume rendering is usually only used for visualisation of the scanned object.
Image segmentation: Where different structures have similar threshold/greyscale values, it can become impossible to separate them simply by adjusting volume rendering parameters. The solution is called segmentation, a manual or automatic procedure that can remove the unwanted structures from the image. Image segmentation software usually allows export of the segmented structures in CAD or STL format for further manipulation.
Image-based meshing: When using 3D image data for computational analysis (e.g. CFD and FEA), simply segmenting the data and meshing from CAD can become time-consuming, and virtually intractable for the complex topologies typical of image data. The solution is called image-based meshing, an automated process of generating an accurate and realistic geometrical description of the scan data.
From laser scans
Laser scanning describes the general method to sample or scan a surface using laser technology. Several areas of application exist that mainly differ in the power of the lasers that are used, and in the results of the scanning process. Low laser power is used when the scanned surface doesn't have to be influenced, e.g. when it only has to be digitised. Confocal or 3D laser scanning are methods to get information about the scanned surface. Another low-power application uses structured light projection systems for solar cell flatness metrology,[42] enabling stress calculation throughout in excess of 2000 wafers per hour.[43]
The laser power used for laser scanning equipment in industrial applications is typically less than 1W. The power level is usually on the order of 200mW or less but sometimes more.
3D data acquisition and object reconstruction can be performed using stereo image pairs. Stereo photogrammetry or photogrammetry based on a block of overlapped images is the primary approach for 3D mapping and object reconstruction using 2D images. Close-range photogrammetry has also matured to the level where cameras or digital cameras can be used to capture the close-look images of objects, e.g., buildings, and reconstruct them using the very same theory as the aerial photogrammetry. An example of software which could do this is Vexcel FotoG 5.[44][45] This software has now been replaced by Vexcel GeoSynth.[46] Another similar software program is Microsoft Photosynth.[47][48]
A semi-automatic method for acquiring 3D topologically structured data from 2D aerial stereo images has been presented by Sisi Zlatanova.[49] The process involves the manual digitizing of a number of points necessary for automatically reconstructing the 3D objects. Each reconstructed object is validated by superimposition of its wire frame graphics in the stereo model. The topologically structured 3D data is stored in a database and are also used for visualization of the objects. Notable software used for 3D data acquisition using 2D images include e.g. Agisoft Metashape,[50]RealityCapture,[51] and ENSAIS Engineering College TIPHON (Traitement d'Image et PHOtogrammétrie Numérique).[52]
A method for semi-automatic building extraction together with a concept for storing building models alongside terrain and other topographic data in a topographical information system has been developed by Franz Rottensteiner. His approach was based on the integration of building parameter estimations into the photogrammetry process applying a hybrid modeling scheme. Buildings are decomposed into a set of simple primitives that are reconstructed individually and are then combined by Boolean operators. The internal data structure of both the primitives and the compound building models are based on the boundary representation methods[53][54]
Multiple images are used in Zhang's[55] approach to surface reconstruction from multiple images. A central idea is to explore the integration of both 3D stereo data and 2D calibrated images. This approach is motivated by the fact that only robust and accurate feature points that survived the geometry scrutiny of multiple images are reconstructed in space. The density insufficiency and the inevitable holes in the stereo data should then be filled in by using information from multiple images. The idea is thus to first construct small surface patches from stereo points, then to progressively propagate only reliable patches in their neighborhood from images into the whole surface using a best-first strategy. The problem thus reduces to searching for an optimal local surface patch going through a given set of stereo points from images.
Multi-spectral images are also used for 3D building detection. The first and last pulse data and the normalized difference vegetation index are used in the process.[56]
New measurement techniques are also employed to obtain measurements of and between objects from single images by using the projection, or the shadow as well as their combination. This technology is gaining attention given its fast processing time, and far lower cost than stereo measurements.[citation needed]
Establishing a bench mark of pre-existing shape/state in order to detect structural changes resulting from exposure to extreme loadings such as earthquake, vessel/truck impact or fire.
Increasing accuracy working with complex parts and shapes,
Coordinating product design using parts from multiple sources,
Updating old CD scans with those from more current technology,
Replacing missing or older parts,
Creating cost savings by allowing as-built design services, for example in automotive manufacturing plants,
"Bringing the plant to the engineers" with web shared scans, and
Saving travel costs.
Entertainment
3D scanners are used by the entertainment industry to create digital 3D models for movies, video games and leisure purposes.[66] They are heavily utilized in virtual cinematography. In cases where a real-world equivalent of a model exists, it is much faster to scan the real-world object than to manually create a model using 3D modeling software. Frequently, artists sculpt physical models of what they want and scan them into digital form rather than directly creating digital models on a computer.
3D photography
3D selfie in 1:20 scale printed by Shapeways using gypsum-based printing, created by Madurodam miniature park from 2D pictures taken at its Fantasitron photo boothFantasitron 3D photo booth at Madurodam
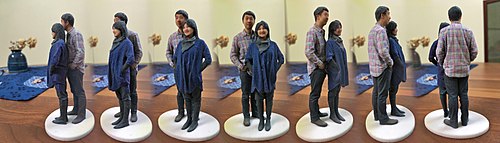
3D scanners are evolving for the use of cameras to represent 3D objects in an accurate manner.[67] Companies are emerging since 2010 that create 3D portraits of people (3D figurines or 3D selfie).
An augmented reality menu for the Madrid restaurant chain 80 Degrees[68]
Law enforcement
3D laser scanning is used by the law enforcement agencies around the world. 3D models are used for on-site documentation of:[69]
Crime scenes
Bullet trajectories
Bloodstain pattern analysis
Accident reconstruction
Bombings
Plane crashes, and more
Reverse engineering
Reverse engineering of a mechanical component requires a precise digital model of the objects to be reproduced. Rather than a set of points a precise digital model can be represented by a polygon mesh, a set of flat or curved NURBS surfaces, or ideally for mechanical components, a CAD solid model. A 3D scanner can be used to digitise free-form or gradually changing shaped components as well as prismatic geometries whereas a coordinate measuring machine is usually used only to determine simple dimensions of a highly prismatic model. These data points are then processed to create a usable digital model, usually using specialized reverse engineering software.
Real estate
Land or buildings can be scanned into a 3D model, which allows buyers to tour and inspect the property remotely, anywhere, without having to be present at the property.[70] For example, companies such as Matterport use structured-light or LiDAR scanners to create interactive "digital twins" of properties, allowing potential buyers to take virtual tours.[71] A typical tour includes a "dollhouse view," which shows a 3D cutaway of the entire property, and an "inside view" for first-person navigation.[72]
Virtual/remote tourism
The environment at a place of interest can be captured and converted into a 3D model. This model can then be explored by the public, either through a VR interface or a traditional "2D" interface. This allows the user to explore locations which are inconvenient for travel.[73] A group of history students at Vancouver iTech Preparatory Middle School created a Virtual Museum by 3D Scanning more than 100 artifacts.[74]
Cultural heritage
There have been many research projects undertaken via the scanning of historical sites and artifacts both for documentation and analysis purposes.[75] The resulting models can be used for a variety of different analytical approaches.[76][77]
The combined use of 3D scanning and 3D printing technologies allows the replication of real objects without the use of traditional plaster casting techniques, that in many cases can be too invasive for being performed on precious or delicate cultural heritage artifacts.[78] In an example of a typical application scenario, a gargoyle model was digitally acquired using a 3D scanner and the produced 3D data was processed using MeshLab. The resulting digital 3D model was fed to a rapid prototyping machine to create a real resin replica of the original object.
Creation of 3D models for Museums and Archaeological artifacts[79][80][81]
Michelangelo
In 1999, two different research groups started scanning Michelangelo's statues. Stanford University with a group led by Marc Levoy[82] used a custom laser triangulation scanner built by Cyberware to scan Michelangelo's statues in Florence, notably the David, the Prigioni and the four statues in The Medici Chapel. The scans produced a data point density of one sample per 0.25mm, detailed enough to see Michelangelo's chisel marks. These detailed scans produced a large amount of data (up to 32 gigabytes) and processing the data from his scans took 5 months. Approximately in the same period a research group from IBM, led by H. Rushmeier and F. Bernardini scanned the Pietà of Florence acquiring both geometric and color details. The digital model, result of the Stanford scanning campaign, was thoroughly used in the 2004 subsequent restoration of the statue.[83]
Monticello
In 2002, David Luebke, et al. scanned Thomas Jefferson's Monticello.[84] A commercial time of flight laser scanner, the DeltaSphere 3000, was used. The scanner data was later combined with color data from digital photographs to create the Virtual Monticello, and the Jefferson's Cabinet exhibits in the New Orleans Museum of Art in 2003. The Virtual Monticello exhibit simulated a window looking into Jefferson's Library. The exhibit consisted of a rear projection display on a wall and a pair of stereo glasses for the viewer. The glasses, combined with polarised projectors, provided a 3D effect. Position tracking hardware on the glasses allowed the display to adapt as the viewer moves around, creating the illusion that the display is actually a hole in the wall looking into Jefferson's Library. The Jefferson's Cabinet exhibit was a barrier stereogram (essentially a non-active hologram that appears different from different angles) of Jefferson's Cabinet.
Cuneiform tablets
The first 3D models of cuneiform tablets were acquired in Germany in 2000.[85] In 2003 the so-called Digital Hammurabi project acquired cuneiform tablets with a laser triangulation scanner using a regular grid pattern having a resolution of 0.025mm (0.00098in).[86] With the use of high-resolution 3D scanners by the Heidelberg University for tablet acquisition in 2009 the development of the GigaMesh Software Framework began to visualize and extract cuneiform characters from 3D models.[87] It was used to process ca. 2.000 3D digitized tablets of the Hilprecht Collection in Jena to create an Open Access benchmark dataset[88] and an annotated collection[89] of 3D models of tablets freely available under CC BY licenses.[90]
Kasubi Tombs
A 2009 CyArk 3D scanning project at Uganda's historic Kasubi Tombs, a UNESCO World Heritage Site, using a Leica HDS 4500, produced detailed architectural models of Muzibu Azaala Mpanga, the main building at the complex and tomb of the Kabakas (Kings) of Uganda. A fire on March 16, 2010, burned down much of the Muzibu Azaala Mpanga structure, and reconstruction work is likely to lean heavily upon the dataset produced by the 3D scan mission.[91]
"Plastico di Roma antica"
In 2005, Gabriele Guidi, et al. scanned the "Plastico di Roma antica",[92] a model of Rome created in the last century. Neither the triangulation method, nor the time of flight method satisfied the requirements of this project because the item to be scanned was both large and contained small details. They found though, that a modulated light scanner was able to provide both the ability to scan an object the size of the model and the accuracy that was needed. The modulated light scanner was supplemented by a triangulation scanner which was used to scan some parts of the model.
Other projects
The 3D Encounters Project at the Petrie Museum of Egyptian Archaeology aims to use 3D laser scanning to create a high quality 3D image library of artefacts and enable digital travelling exhibitions of fragile Egyptian artefacts, English Heritage has investigated the use of 3D laser scanning for a wide range of applications to gain archaeological and condition data, and the National Conservation Centre in Liverpool has also produced 3D laser scans on commission, including portable object and in situ scans of archaeological sites.[93] The Smithsonian Institution has a project called Smithsonian X 3D notable for the breadth of types of 3D objects they are attempting to scan. These include small objects such as insects and flowers, to human sized objects such as Amelia Earhart's Flight Suit to room sized objects such as the Gunboat Philadelphia to historic sites such as Liang Bua in Indonesia. Also of note the data from these scans is being made available to the public for free and downloadable in several data formats.
Medical CAD/CAM
3D scanners are used to capture the 3D shape of a patient in orthotics and dentistry. It gradually supplants tedious plaster cast. CAD/CAM software are then used to design and manufacture the orthosis, prosthesis or dental implants.
Many chairside dental CAD/CAM systems and dental laboratory CAD/CAM systems use 3D scanner technologies to capture the 3D surface of a dental preparation (either in vivo or in vitro), in order to produce a restoration digitally using CAD software and ultimately produce the final restoration using a CAM technology (such as a CNC milling machine, or 3D printer). The chairside systems are designed to facilitate the 3D scanning of a preparation in vivo and produce the restoration (such as a Crown, Onlay, Inlay or Veneer).
Creation of 3D models for anatomy and biology education[94][95] and cadaver models for educational neurosurgical simulations.[96]
Quality assurance and industrial metrology
The digitalisation of real-world objects is of vital importance in various application domains. This method is especially applied in industrial quality assurance to measure the geometric dimension accuracy. Industrial processes such as assembly are complex, highly automated and typically based on CAD (computer-aided design) data. The problem is that the same degree of automation is also required for quality assurance. It is, for example, a very complex task to assemble a modern car, since it consists of many parts that must fit together at the very end of the production line. The optimal performance of this process is guaranteed by quality assurance systems. Especially the geometry of the metal parts must be checked in order to assure that they have the correct dimensions, fit together and finally work reliably.
Within highly automated processes, the resulting geometric measures are transferred to machines that manufacture the desired objects. Due to mechanical uncertainties and abrasions, the result may differ from its digital nominal. In order to automatically capture and evaluate these deviations, the manufactured part must be digitised as well. For this purpose, 3D scanners are applied to generate point samples from the object's surface which are finally compared against the nominal data.[97]
The process of comparing 3D data against a CAD model is referred to as CAD-Compare, and can be a useful technique for applications such as determining wear patterns on moulds and tooling, determining accuracy of final build, analysing gap and flush, or analysing highly complex sculpted surfaces. At present, laser triangulation scanners, structured light and contact scanning are the predominant technologies employed for industrial purposes, with contact scanning remaining the slowest, but overall most accurate option. Nevertheless, 3D scanning technology offers distinct advantages compared to traditional touch probe measurements. White-light or laser scanners accurately digitize objects all around, capturing fine details and freeform surfaces without reference points or spray. The entire surface is covered at record speed without the risk of damaging the part. Graphic comparison charts illustrate geometric deviations of full object level, providing deeper insights into potential causes.[98][99]
After the data has been collected, the acquired (and sometimes already processed) data from images or sensors needs to be reconstructed. This may be done in the same program or in some cases, the 3D data needs to be exported and imported into another program for further refining, and/or to add additional data. Such additional data could be GPS-location data. After the reconstruction, the data might be directly implemented into a local (GIS) map[100][101] or a worldwide map such as Google Earth or Apple Maps.
Software
Several software packages are used in which the acquired (and sometimes already processed) data from images or sensors is imported. Notable software packages include:[102]
↑Izadi, Shahram; Davison, Andrew; Fitzgibbon, Andrew; Kim, David; Hilliges, Otmar; Molyneaux, David; Newcombe, Richard; Kohli, Pushmeet; Shotton, Jamie; Hodges, Steve; Freeman, Dustin (2011). "Kinect Fusion". Proceedings of the 24th annual ACM symposium on User interface software and technology - UIST '11. p.559. doi:10.1145/2047196.2047270. ISBN978-1-4503-0716-1. S2CID3345516.
↑Moeslund, Thomas B.; Granum, Erik (1 March 2001). "A Survey of Computer Vision-Based Human Motion Capture". Computer Vision and Image Understanding. 81 (3): 231–268. CiteSeerX10.1.1.108.203. doi:10.1006/cviu.2000.0897.
↑Wand, Michael; Adams, Bart; Ovsjanikov, Maksim; Berner, Alexander; Bokeloh, Martin; Jenke, Philipp; Guibas, Leonidas; Seidel, Hans-Peter; Schilling, Andreas (April 2009). "Efficient reconstruction of nonrigid shape and motion from real-time 3D scanner data". ACM Transactions on Graphics. 28 (2): 1–15. CiteSeerX10.1.1.230.1675. doi:10.1145/1516522.1516526. S2CID9881027.
↑Cui, Yan; Schuon, Sebastian; Chan, Derek; Thrun, Sebastian; Theobalt, Christian (2010). "3D shape scanning with a time-of-flight camera". 2010 IEEE Computer Society Conference on Computer Vision and Pattern Recognition. pp.1173–1180. doi:10.1109/CVPR.2010.5540082. ISBN978-1-4244-6984-0. S2CID2084943.
↑Franca, J.G.D.M.; Gazziro, M.A.; Ide, A.N.; Saito, J.H. (2005). "A 3D scanning system based on laser triangulation and variable field of view". IEEE International Conference on Image Processing 2005. pp.I-425. doi:10.1109/ICIP.2005.1529778. ISBN978-0-7803-9134-5. S2CID17914887.
↑François Blais; Michel Picard; Guy Godin (6–9 September 2004). "Accurate 3D acquisition of freely moving objects". 2nd International Symposium on 3D Data Processing, Visualisation, and Transmission, 3DPVT 2004, Thessaloniki, Greece. Los Alamitos, CA: IEEE Computer Society. pp.422–9. ISBN0-7695-2223-8.
↑Strobl, K. H.; Mair, E.; Bodenmuller, T.; Kielhofer, S.; Sepp, W.; Suppa, M.; Burschka, D.; Hirzinger, G. (2009). "The self-referenced DLR 3D-modeler". 2009 IEEE/RSJ International Conference on Intelligent Robots and Systems. pp.21–28. doi:10.1109/IROS.2009.5354708. ISBN978-1-4244-3803-7. S2CID3576337.
↑W. J. Walecki; F. Szondy; M. M. Hilali (2008). "Fast in-line surface topography metrology enabling stress calculation for solar cell manufacturing allowing throughput in excess of 2000 wafers per hour". Meas. Sci. Technol. 19 (2) 025302. doi:10.1088/0957-0233/19/2/025302. S2CID121768537.
↑Rottensteiner, Franz (2001). Semi-automatic extraction of buildings based on hybrid adjustment using 3D surface models and management of building data in a TIS. Inst. für Photogrammetrie u. Fernerkundung d. Techn. Univ. Wien. hdl:20.500.12708/373. ISBN978-3-9500791-3-5.
↑Zhang, Zhengyou (September 1999). "Flexible camera calibration by viewing a plane from unknown orientations". Proceedings of the Seventh IEEE International Conference on Computer Vision. Vol.1. pp.666–673. doi:10.1109/ICCV.1999.791289. ISBN0-7695-0164-8. S2CID206769306.
↑Larsson, Sören; Kjellander, J.A.P. (2006). "Motion control and data capturing for laser scanning with an industrial robot". Robotics and Autonomous Systems. 54 (6): 453–460. doi:10.1016/j.robot.2006.02.002.
↑Men, Hao; Pochiraju, Kishore (2012). "Algorithms for 3D Map Segment Registration". In Khosrow-Pour, Mehdi (ed.). Geographic Information Systems: Concepts, Methodologies, Tools, and Applications: Concepts, Methodologies, Tools, and Applications. Vol.I. IGI Global. p.502. ISBN978-1-4666-2039-1.
↑Murphy, Liam. "Case Study: Old Mine Workings". Subsurface Laser Scanning Case Studies. Liam Murphy. Archived from the original on 2012-04-18. Retrieved 11 January 2012.
↑Lamine Mahdjoubi; Cletus Moobela; Richard Laing (December 2013). "Providing real-estate services through the integration of 3D laser scanning and building information modelling". Computers in Industry. 64 (9): 1272. doi:10.1016/j.compind.2013.09.003.
↑Cignoni, Paolo; Scopigno, Roberto (18 June 2008). "Sampled 3D models for CH applications: A viable and enabling new medium or just a technological exercise?". Journal on Computing and Cultural Heritage. 1 (1): 2:1–2:23. doi:10.1145/1367080.1367082. S2CID16510261.
↑Scopigno, R.; Cignoni, P.; Pietroni, N.; Callieri, M.; Dellepiane, M. (January 2017). "Digital Fabrication Techniques for Cultural Heritage: A Survey: Fabrication Techniques for Cultural Heritage". Computer Graphics Forum. 36 (1): 6–21. doi:10.1111/cgf.12781. S2CID26690232.
↑Marc Levoy; Kari Pulli; Brian Curless; Szymon Rusinkiewicz; David Koller; Lucas Pereira; Matt Ginzton; Sean Anderson; James Davis; Jeremy Ginsberg; Jonathan Shade; Duane Fulk (2000). "The Digital Michelangelo Project: 3D Scanning of Large Statues"(PDF). Proceedings of the 27th annual conference on Computer graphics and interactive techniques. pp.131–144.
↑Roberto Scopigno; Susanna Bracci; Falletti, Franca; Mauro Matteini (2004). Exploring David. Diagnostic Tests and State of Conservation. Gruppo Editoriale Giunti. ISBN978-88-09-03325-2.
↑Kumar, S.; Snyder, D.; Duncan, D.; Cohen, J.; Cooper, J. (2003). "Digital preservation of ancient Cuneiform tablets using 3D-scanning". Fourth International Conference on 3-D Digital Imaging and Modeling, 2003. 3DIM 2003. Proceedings. pp.326–333. doi:10.1109/IM.2003.1240266. ISBN978-0-7695-1991-3. S2CID676588.
↑Mara, Hubert; Krömker, Susanne; Jakob, Stefan; Breuckmann, Bernd (2010). "GigaMesh and Gilgamesh 3D Multiscale Integral Invariant Cuneiform Character Extraction". Vast: International Symposium on Virtual Reality. doi:10.2312/VAST/VAST10/131-138. ISBN978-3-905674-29-3.
↑Mara, Hubert (2019-06-07), HeiCuBeDa Hilprecht – Heidelberg Cuneiform Benchmark Dataset for the Hilprecht Collection, heiDATA – institutional repository for research data of Heidelberg University, doi:10.11588/data/IE8CCN
↑Mara, Hubert (2019-06-07), HeiCu3Da Hilprecht – Heidelberg Cuneiform 3D Database - Hilprecht Collection, heidICON – Die Heidelberger Objekt- und Multimediadatenbank, doi:10.11588/heidicon.hilprecht
↑Mara, Hubert; Bogacz, Bartosz (2019). "Breaking the Code on Broken Tablets: The Learning Challenge for Annotated Cuneiform Script in Normalized 2D and 3D Datasets". 2019 International Conference on Document Analysis and Recognition (ICDAR). pp.148–153. doi:10.1109/ICDAR.2019.00032. ISBN978-1-7281-3014-9. S2CID211026941.
↑Gabriele Guidi; Laura Micoli; Michele Russo; Bernard Frischer; Monica De Simone; Alessandro Spinetti; Luca Carosso (13–16 June 2005). "3D digitisation of a large model of imperial Rome". 5th international conference on 3-D digital imaging and modeling: 3DIM 2005, Ottawa, Ontario, Canada. Los Alamitos, CA: IEEE Computer Society. pp.565–572. ISBN0-7695-2327-7.
↑Iwanaga, Joe; Terada, Satoshi; Kim, Hee-Jin; Tabira, Yoko; Arakawa, Takamitsu; Watanabe, Koichi; Dumont, Aaron S.; Tubbs, R. Shane (September 2021). "Easy three-dimensional scanning technology for anatomy education using a free cellphone app". Clinical Anatomy. 34 (6): 910–918. doi:10.1002/ca.23753. PMID33984162. S2CID234497497.
↑竹下, 俊治 (19 March 2021). "生物の形態観察における3Dスキャンアプリの活用" [Utilization of 3D scanning application for morphological observation of organisms]. 学校教育実践学研究 (in Japanese). 27. doi:10.15027/50609.
↑Gurses, Muhammet Enes; Gungor, Abuzer; Hanalioglu, Sahin; Yaltirik, Cumhur Kaan; Postuk, Hasan Cagri; Berker, Mustafa; Türe, Uğur (December 2021). "Qlone®: A Simple Method to Create 360-Degree Photogrammetry-Based 3-Dimensional Model of Cadaveric Specimens". Operative Neurosurgery. 21 (6): E488–E493. doi:10.1093/ons/opab355. PMID34662905.
↑Christian Teutsch (2007). Model-based Analysis and Evaluation of Point Sets from Optical 3D Laser Scanners (PhD thesis).
↑Zlatanova, Sisi (2008). "Working Group II — Acquisition — Position Paper: Data collection and 3D reconstruction". Advances in 3D Geoinformation Systems. Lecture Notes in Geoinformation and Cartography. pp.425–428. doi:10.1007/978-3-540-72135-2_24. ISBN978-3-540-72134-5.
This page is based on this Wikipedia article Text is available under the CC BY-SA 4.0 license; additional terms may apply. Images, videos and audio are available under their respective licenses.