
Tomography is imaging by sections or sectioning that uses any kind of penetrating wave. The method is used in radiology, archaeology, biology, atmospheric science, geophysics, oceanography, plasma physics, materials science, cosmochemistry, astrophysics, quantum information, and other areas of science. The word tomography is derived from Ancient Greek τόμος tomos, "slice, section" and γράφω graphō, "to write" or, in this context as well, "to describe." A device used in tomography is called a tomograph, while the image produced is a tomogram.

In scientific visualization and computer graphics, volume rendering is a set of techniques used to display a 2D projection of a 3D discretely sampled data set, typically a 3D scalar field.
Tomographic reconstruction is a type of multidimensional inverse problem where the challenge is to yield an estimate of a specific system from a finite number of projections. The mathematical basis for tomographic imaging was laid down by Johann Radon. A notable example of applications is the reconstruction of computed tomography (CT) where cross-sectional images of patients are obtained in non-invasive manner. Recent developments have seen the Radon transform and its inverse used for tasks related to realistic object insertion required for testing and evaluating computed tomography use in airport security.

ROOT is an object-oriented computer program and library developed by CERN. It was originally designed for particle physics data analysis and contains several features specific to the field, but it is also used in other applications such as astronomy and data mining. The latest minor release is 6.32, as of 2024-05-26.

Analysis of Functional NeuroImages (AFNI) is an open-source environment for processing and displaying functional MRI data—a technique for mapping human brain activity.

Transmission electron cryomicroscopy (CryoTEM), commonly known as cryo-EM, is a form of cryogenic electron microscopy, more specifically a type of transmission electron microscopy (TEM) where the sample is studied at cryogenic temperatures. Cryo-EM, specifically 3-dimensional electron microscopy (3DEM), is gaining popularity in structural biology.
MeshLab is a 3D mesh processing software system that is oriented to the management and processing of unstructured large meshes and provides a set of tools for editing, cleaning, healing, inspecting, rendering, and converting these kinds of meshes. MeshLab is free and open-source software, subject to the requirements of the GNU General Public License (GPL), version 2 or later, and is used as both a complete package and a library powering other software. It is well known in the more technical fields of 3D development and data handling.
Electron tomography (ET) is a tomography technique for obtaining detailed 3D structures of sub-cellular, macro-molecular, or materials specimens. Electron tomography is an extension of traditional transmission electron microscopy and uses a transmission electron microscope to collect the data. In the process, a beam of electrons is passed through the sample at incremental degrees of rotation around the center of the target sample. This information is collected and used to assemble a three-dimensional image of the target. For biological applications, the typical resolution of ET systems are in the 5–20 nm range, suitable for examining supra-molecular multi-protein structures, although not the secondary and tertiary structure of an individual protein or polypeptide. Recently, atomic resolution in 3D electron tomography reconstructions has been demonstrated.

ParaView is an open-source multiple-platform application for interactive, scientific visualization. It has a client–server architecture to facilitate remote visualization of datasets, and generates level of detail (LOD) models to maintain interactive frame rates for large datasets. It is an application built on top of the Visualization Toolkit (VTK) libraries. ParaView is an application designed for data parallelism on shared-memory or distributed-memory multicomputers and clusters. It can also be run as a single-computer application.
OpenMS is an open-source project for data analysis and processing in mass spectrometry and is released under the 3-clause BSD licence. It supports most common operating systems including Microsoft Windows, MacOS and Linux.
Biological data visualization is a branch of bioinformatics concerned with the application of computer graphics, scientific visualization, and information visualization to different areas of the life sciences. This includes visualization of sequences, genomes, alignments, phylogenies, macromolecular structures, systems biology, microscopy, and magnetic resonance imaging data. Software tools used for visualizing biological data range from simple, standalone programs to complex, integrated systems.

IMOD is an open-source, cross-platform suite of modeling, display and image processing programs used for 3D reconstruction and modeling of microscopy images with a special emphasis on electron microscopy data. IMOD has been used across a range of scales from macromolecule structures to organelles to whole cells and can also be used for optical sections. IMOD includes tools for image reconstruction, image segmentation, 3D mesh modeling and analysis of 2D and 3D data.

Amira is a software platform for visualization, processing, and analysis of 3D and 4D data. It is being actively developed by Thermo Fisher Scientific in collaboration with the Zuse Institute Berlin (ZIB), and commercially distributed by Thermo Fisher Scientific — together with its sister software Avizo.
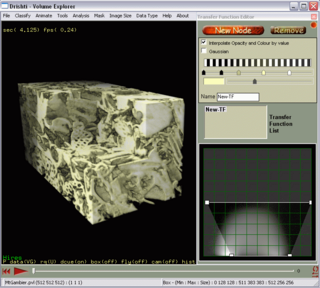
Drishti is a multi-platform, open-source volume-exploration and presentation tool. Written for visualizing tomography data, electron-microscopy data and the like, it aims to ease understanding of data sets and to assist with conveying that understanding to the research community or to lay persons. From the website:
"The central idea about Drishti is that the scientists should be able to use it for exploring volumetric datasets as well as use it in presentations."

GPlates is open-source application software offering a novel combination of interactive plate-tectonic reconstructions, geographic information system (GIS) functionality and raster data visualisation.
