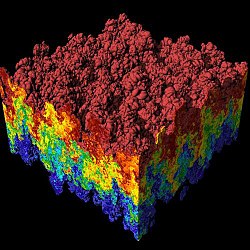
VisIt is an open-source, interactive parallel visualization, and graphical analysis tool designed for viewing scientific data. It can visualize scalar and vector fields on 2D and 3D structured and unstructured meshes.
VisIt was developed by the Department of Energy (DOE) Advanced Simulation and Computing Initiative (ASCI) to visualize and analyze the results of terascale simulations. It was conceived as a framework for adding custom capabilities and rapidly deploying new visualization technologies. After an initial prototype effort, work on VisIt began in the summer of 2000, with the initial version released in the fall of 2002.
VisIt is supported by the DOE's SciDAC (Scientific Discovery Through Advanced Computing)[3] program to assist with the analysis and visualization of large datasets generated by open scientific computing. It is developed in collaboration with multiple organizations, including Oak Ridge National Laboratory, Lawrence Berkeley National Laboratory, and the University of California, Davis. Being open-source and released under the BSD license, VisIt has received contributions from various other developers[citation needed].
Summary
VisIt is an open-source application for large-scale simulated and experimental data sets. The application serves as an infrastructure for parallelized, general post-processing of extremely massive data sets. Its primary use cases include data exploration, comparative analysis, visual debugging, quantitative analysis, and presentation.
VisIt leverages several third-party libraries: the Qt widget library for its user interface, the Python programming language for a command line interpreter[citation needed], and the Visualization ToolKit (VTK) library for its data model and many of its visualization algorithms. The VisIt-specific effort has largely been focused on parallelization for large data sets, user interface, implementing custom data analysis routines, addressing non-standard data models (such as adaptive mesh refinement (AMR) and mixed materials zones), and creating a robust overall product. It has been ported to Windows, Mac, and many Unix variants, including AIX, IRIX, Solaris, Tru64, and Linux, including ports for SGI's Altix, Cray's XT4, and many commodity clusters.
The basic design is a client–server model, where the server is parallelized. The most common form of the server is a stand-alone process that reads data from files. However, an alternate form exists where a simulation code can link in "lib-VisIt" and become itself the server, allowing for in situ visualization and analysis.
VisIt follows a data flow network paradigm where interoperable modules are connected to perform custom analysis. The modules come from VisIt's five primary user interface abstractions. There are twenty-one "plots" (ways to render data), forty-two "operators" (ways to manipulate data), eighty-five file format readers, over fifty "queries" (ways to extract quantitative information), and over one hundred "expressions" (ways to create derived quantities). Further, a plugin capability allows for the dynamic incorporation of new plot, operator, and database modules. These plugins can be partially code generated, even including automatic generation of Qt and Python user interfaces.
Supports scalar, vector, and tensor field visualization. VisIt handles 2D and 3D data. VisIt also has the ability to animate data, allowing users to see the time evolution of their data.
Provides qualitative and quantitative visualization and analysis. VisIt provides support for derived fields, which allow new fields to be calculated using existing fields. For example, if a dataset contains a velocity field, it is possible to define a new field that is the velocity magnitude. It also supports a generalized query interface, which allows users to query derived quantities such as volume or surface area.
Supports multiple mesh types. VisIt provides support for a variety of computational meshes, including two and three-dimensional points, rectilinear, curvilinear, and unstructured meshes. VisIt also supports structuredAMR meshes and CSG meshes.
VisIt's graphical user interface allows novice users to quickly visualize their data, and includes advanced features for power users. It automatically creates time-based animations from data sets that contain multiple time steps. It also has a keyframe animation capability that allows users to create sophisticated animations. VisIt allows users to pan, zoom, and rotate objects interactively using the mouse. It also gives users the ability to interactively size and position geometric objects such as planes and spheres.
Parallel and distributed architecture. VisIt employs a distributed and parallel architecture in order to handle extremely large data sets interactively. VisIt's rendering and data processing capabilities are split into viewer and engine components that may be distributed across multiple machines:
Viewer is responsible for rendering and is typically run on a local desktop or visualization server so that it can leverage the powerful graphics cards.
Engine is responsible for the bulk of the data processing and input/output and is typically run on a remote machine where the data is located. This eliminates the need to move the data and makes high-end compute and I/O resources available to it. The engine can be run serially on a single processor or in parallel on thousands of processors.
Interfaces with C++, Python, and Java. The C++ and Java interfaces make it possible to provide alternate user interfaces for VisIt or allow existing C++ or Java applications to add visualization support. The Python scripting interface gives users the ability to batch process data using a scripting language. This feature can be used to create sophisticated animations or implement regression suites.
Extensible with dynamically loaded plug-ins. VisIt achieves extensibility through the use of dynamically loaded plugins. All of VisIt's plots, operators, and database readers are implemented as plugins and are loaded at run-time from the plugin directory. New plugins can be added by installing them in this directory. VisIt comes with a graphical plugin creation tool, which simplifies the process of creating new plugins.
Plans for upcoming releases are available to view.
This page is based on this Wikipedia article Text is available under the CC BY-SA 4.0 license; additional terms may apply. Images, videos and audio are available under their respective licenses.