An emerging trend is the blurring of boundaries between the visualization of 3D structures at atomic resolution, the visualization of larger complexes by cryo-electron microscopy, and the visualization of the location of proteins and complexes within whole cells and tissues.[1][2] There has also been an increase in the availability and importance of time-resolved data from systems biology, electron microscopy, and cell and tissue imaging.[3][4]
Sequence alignment visualization plays a crucial role in bioinformatics and genomics by enabling researchers to interpret and analyze complex genetic data effectively. Visualizing sequence alignments allows for the identification of similarities, differences, conserved regions, and evolutionary patterns within DNA or protein sequences, aiding in understanding genetic relationships, functional elements, and evolutionary processes. Sequence alignment visualization is essential for several reasons:
Identifying conserved sequence: Visualization helps researchers identify conserved regions across sequences, which are indicative of functional importance or evolutionary relationships.[5]
Detecting mutations and variations: Visualization tools enable the detection of mutations, insertions, deletions, and other variations within sequences, providing insights into genetic diversity and disease-causing mutations.[6]
Understanding evolutionary relationships: By visualizing sequence alignments, researchers can infer evolutionary relationships, construct phylogenetic trees, and study the evolutionary history of species or genes.[7]
Predicting functional elements: Visualization aids in predicting functional elements such as protein domains, motifs, and regulatory regions within sequences, facilitating functional genomics studies.[8]
Comparing genomes: comparative genomics rely on sequence alignment visualization to compare genomes, identify orthologous and paralogous genes, and study genome evolution across species.[9] To visualize sequence alignments and their features, researchers often rely on popular bioinformatics software tools such as Clustal Omega, MUSCLE, T-Coffee, and MAFFT. These tools provide interactive platforms for aligning sequences, highlighting conserved regions, displaying sequence variations, and identifying sequence motifs. Additionally, visualization software like Jalview, BioEdit, and Geneious offer advanced features for visualizing and analyzing sequence alignments, making it easier for researchers to interpret and extract meaningful information from genetic data.
Techniques
Besides software tools, such as Clustal Omega, MUSCLE, T-Coffee, and MAFFT, several popular techniques exist for genomic sequence alignment visualization, which plays a crutial role in helping researchers understand generic relationship, functional elements, and evolutionary processes. Among popular tools, common techniques in sequence alignment visualization include:
Sequence logo: Sequence logos are graphical representations of sequence alignments that display the conservation of residues at each position as well as the relative frequency of each amino acid or nucleotide. Sequence logos provide a compact and informative visualization of conserved sequence and variability.[10]
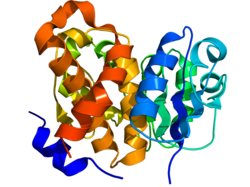
Protein structure alignment tools: tools like PyMOL and UCSF Chimera enable the visualization of sequence alignments in the context of protein structures. By superimposing aligned sequences onto protein structures, researchers can analyze the spatial arrangement of conserved residues and functional domains.[12]
Phylogenetic tree visualization: Phylogenetic tree visualization tools, such as FigTree and iTOL, allow researchers to visualize evolutionary relationships inferred from sequence alignments. These tools provide interactive displays of phylogenetic trees, highlighting branch lengths, node support values, and evolutionary distances.[13]
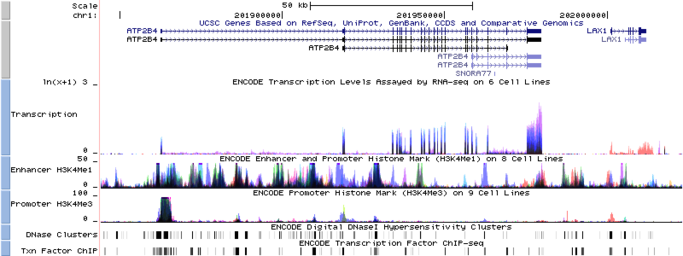
Genome browser: Genome browsers like UCSC Genome Browser and Ensembl provide comprehensive platforms for visualizing sequence alignments across entire genomes. Researchers can explore DNA annotation, regulatory elements, and comparative genomics data within the context of genome sequences.[14]
Prostista taxonomy vs. phylogeny - This diagram shows the phylogeny of eukaryotes based on some recent analyses superimposed over the current kingdom and subkingdom-level taxonomy of protists. The purpose of the image is to demonstrate the paraphyly of most protist groupings, particularly those belonging to kingdom Protozoa: subkingdom Eozoa. Source: Wikipedia Commons, the free media repository. Retrieved April 20, 2024, from https://commons.wikimedia.org/wiki/File:Protista_taxonomy_vs_phylogeny.png
Applications
Genomic sequence alignment visualization is used in various applications, playing a crucial role in various areas of genomics and bioinformatics, enabling researchers to analyze, interpret, and extract valuable insights from genetic data. The applications of sequence alignment visualization are diverse and encompass a wide range of research fields. Some key applications include:
Comparative genomics:Sequence alignment visualization is essential for comparative genomics studies, where researchers compare genetic sequences across different species to identify evolutionary relationships, conserved sequence regions, and functional elements. Visualization tools help in detecting similarities and differences between genomes, aiding in the study of evolutionary processes.[15]
Phylogenetic analysis:Phylogenetics studies rely on sequence alignment visualization to construct phylogenetic trees and analyze genetic relationships between species or population. Visualization tools enable researchers to visualize sequence similarities, calculate evolutionary distances, and infer phylogenetic relationships based on sequence alignments.[17]
Functional genomics: In functional genomics research, sequence alignment visualization is employed to study gene expression, regulatory elements, and protein-protein interactions. By visualizing sequence alignments in the context of functional annotations and gene networks, researchers can elucidate the biological functions and regulatory mechanisms of genes.[18]
The visualization of macromolecules is critical for an intricate understanding of the multifaceted structures and functionalities that are fundamental to biological systems. Remarkable progress has been made in the three-dimensional portrayal of such macromolecules, spanning carbohydrates, proteins, nucleic acids, and their complexes. Recent advancements in visualization methodologies have precipitated a quantum leap in our ability to discern the subtleties of biological data. These sophisticated visualizations bestow an unprecedented level of clarity and granularity, thereby enhancing our comprehension of the mechanistic underpinnings governing the behavior and interaction of biological entities.
Techniques
Volume rendering
Segmentation enhances biological imaging interpretation, with automated tools improving data analysis. This has led to a rise in web-based visualization for 3D segmentations. Segmentation plays a vital role in deciphering biological imaging data. The advent of sophisticated automated segmentation technologies, along with their incorporation into public imaging data repositories, greatly enhances the interpretation process.[20]
Volume rendering reveals internal macromolecular structures without segmentation, providing a non-invasive view inside the molecules.
Integrating experimental data into visualizations, like overlaying mutations or binding data, offers richer insights. This can be displayed as heat maps or gradients on the molecule, vital for managing the growing complexity of biomolecular data.[21]
Interactive 3D visualization offers hands-on engagement with macromolecules, allowing for manipulation such as rotation and zooming, which enhances comprehension.
Interactive 3D visualization
Virtual reality and augmented reality present immersive methods to engage with macromolecules, delivering a 3D perspective that screen-based tools can't match. AR app also designed to help students visualize and interact with 3D macromolecular structures, addressing the limitations of traditional 2D images in conveying spatial details and depth perception.[22]
Animation of molecular activities illustrates the dynamic behaviors of biomolecules, serving as a powerful educational and research tool. Utilizing Unity3D game engine technology, this approach democratizes the creation of interactive molecular visualization tools, resulting in a user-friendly platform that simplifies complex biological data depiction.[23]
High-performance computing visualization enables real-time rendering of massive, intricate datasets, a necessity for advanced macromolecular analysis. Software leveraging high-performance computing dynamically and efficiently analyzes drug-receptor interactions via molecular dynamics simulations, offering profound insights and predictions on drug efficacy, and facilitating visualization.[24]
Hybrid visualization techniques merge various methods to provide a multifaceted view of molecules, combining detailed atomic positions with a holistic understanding of structure and volume.
Visualization in different types of macromolecular
Visualizations of the Carbohydrate Binding Module (CBM) of cellulase examine its interactions with cellulose during hydrolysis from three angles: the adsorption of CBM to cellulose, its spatial occupation, and the accessibility of the cellulose surface to CBM.
The RCSB Protein Data Bank (RCSB PDB), supported by major US scientific agencies, has been a pivotal resource for structural biologists globally and acts as the US data center within the Worldwide Protein Data Bank (wwPDB) partnership. As the designated Archive Keeper, RCSB PDB ensures the security of PDB data and serves tens of thousands of data depositors annually across all inhabited continents using various structural determination methods. The RCSB.org web portal provides unrestricted access to PDB data to millions globally. This article details the growth and evolution of the archive with advancing experimental techniques, the critical role of data standards and integration, and the introduction of new tools and features for 3D structural analysis and visualization over the past year.[25]
Researchers have developed a swift, straightforward, and precise method for detecting Infectious Bovine Rhinotracheitis Virus (IBRV) in cattle—a virus known for causing chronic infections and substantial economic impacts. This method integrates recombinant polymerase amplification (RPA) with a vertical flow visualization strip (VF) to form an RPA-VF assay that targets the thymidine kinase gene, ensuring fast detection, high specificity, and zero cross-reactivity with other pathogens.[26]
Large non-polymeric molecules
The visualization of nanoscale materials is crucial for understanding their structure-function relationships, and it typically requires advanced microscopy and analytical techniques that provide high-resolution and high-magnification images.
Mesoporous Silica Nanoparticle
Nanoparticles are tiny particles that measure in the range of 1 to 100 nanometers. Due to their small size and high surface area to volume ratio, they exhibit unique chemical and physical properties. Visualization of nanoparticles is typically achieved using high-resolution techniques like Transmission Electron Microscopy (TEM), Scanning Electron Microscopy (SEM), Atomic Force Microscopy (AFM), and Dynamic Light Scattering (DLS) for size distribution analysis.[27][28]
Nanocomposite structure german
Nanocomposites are materials that incorporate nanoparticles within a matrix of another material, such as polymers, ceramics, or metals. These composites often exhibit enhanced properties, such as increased strength or electrical conductivity. Visualization of the distribution and interaction of nanoparticles within the matrix can be carried out using techniques like TEM, SEM, and X-ray diffraction (XRD).
Carbon nanotube
Nanotubes, specifically carbon nanotubes (CNTs), are cylindrical structures with diameters as small as 1 nanometer. They have remarkable mechanical, electrical, and thermal properties and are used in various applications from materials science to nanotechnology. Visualization of nanotubes typically requires TEM, SEM, or AFM.
Nanofibers
Nanofibers are fibers with diameters in the nanometer scale. They are created through processes like electrospinning and have applications in areas such as filtration, textiles, and biomedicine. Nanofibers can be visualized using SEM, which provides detailed images of their morphology and distribution.
Visualize the interactions between macromolecules
The interactions of protein-carbohydrae was visulazed by hydrogen atoms in a perdeuterated lectin-fucose complex.[29] Computational docking plays a vital role in structural biology, with software providing a user-friendly web platform for modeling various macromolecular interactions, such as flexible complexes and membrane-associated assemblies. This enhances accessibility and enriches the user experience within the structural biology community.[30]
Tools
PyMOL, Chimera, ChimeraX, Jmol, VMD, Swiss-PdbViewer, Coot, Biovia Discovery Studio, LightDock and Schrodinger's Maestro are key tools in molecular visualization, each offering unique capabilities ranging from high-quality 3D imaging and interactive analysis to support for virtual reality and large-scale simulations, catering to diverse needs in molecular modeling, publication, and education across both open-source and commercial platforms.
Systems biology
A metabolic network before and after flux-balance analysisA whole-body section of a mouse taken using mass spectrometry, with the green particles representing the distribution of drugs and metabolites within its system
Systems biology is a branch of biological data visualization dedicated to analyzing and modeling complex biological systems. Popular computational models used in systems biology include process calculi, such as stochastic π-calculus, and constraint-based reconstruction and analysis (COBRA), a paradigm that considers physical, enzymatic, and topological constraints underlying a phenotype in a metabolic network.[32][33]
Most data visualization in systems biology is done using mathematically generated models. Researchers will diagram all of the protein, gene, or metabolic pathways in a given biological system, then determine the speed of the reactions in that system using mass action kinetics or enzyme kinetics. These values are used as parameters to construct differential equations representing the system, which can then be used to determine the behavior of the things within that system. Alternative mathematical modeling solutions also exist; for instance, a COBRA method such as flux balance analysis could be used to analyze the flow of metabolites through a particular metabolic network.[34]
Another key imaging method in systems biology is mass spectrometry, which can be used to visualize the spatial distribution of compounds, biomarkers, metabolites, peptides, and/or proteins within the body. This is especially helpful in metabolomics, a branch of systems biology that uses mass spectrometry to measure metabolite distribution information, then uses the measured intensity to construct an image.[35]
Other than optical and electron microscopy, other techniques like scanning probe, ultraviolet, infrared, digital holographic, laser, and amateur are also utilize on Visualization.
Microbial imaging
New approaches There is study investigates the use of two-photon microscopy, a technique capable of imaging depths up to 800 μm through two-photon absorption, for visualizing microrobotic agents beneath biological tissue, demonstrating its transformative potential for both in vitro and in vivo microrobotics applications.[36]
Researchers used bright-field light microscopy with high-intensity pulsing LED illumination to capture detailed 12-bit-per-channel images of live cells, addressing data distortions caused by optical path interactions and sensor anomalies with a comprehensive spectroscopic calibration approach, allowing for visualization with minimal information loss in 8-bit intensity depth.[37]
Researchers explored a community-driven initiative focused on improving the depiction of light microscopy data in scientific publications by adhering to the 'FAIR Data Principles,' which aim to enhance data findability, accessibility, interoperability, and reproducibility. Despite persistent challenges related to data quality and communication, the initiative emphasizes the role of global scientific collaboration in advancing imaging standards and leverages historical insights to guide and promote future advancements in biological imaging.[38]
Magnetic resonance imaging (MRI) is a common form of biological data visualization used to form pictures of internal biological processes. Different settings of radiofrequency pulses and gradients result in different image appearances; these combinations are known as MRI sequences. A particularly notable subset of MRI is magnetic resonance angiography, which is a group of techniques used to image arteries and veins. MRI's imaging utility is further expanded upon by diffusion MRI and functional MRI, which can be used to capture neuronal tracts and blood flow respectively.
Diffusion MRI further relies on diffusion tensor imaging (DTI), which measures water molecule diffusion and directionality, and diffusion basis spectrum imaging (DBSI), which extracts multiple anisotropic and isotropic diffusion tensors.[39][40] Functional MRI relies on blood-oxygen-level dependent (BOLD) contrast, which measures the proportion of oxygenated hemoglobin in specific areas of the brain; this allows it to measure and model brain activity based on blood flow.[41] Further MRI techniques include saturation pulses (used to reduce motion artifacts), gradient echo (such as dynamic contrast enhancement), spin echo, and diffusion weighting (a signal contrast generation method based on differences in Brownian motion).[42][43][44]
Examples of T1-weighted, T2-weighted and PD-weighted MRI scans
To generate an observable image using MRI, the target is placed in a powerful magnetic field, such as that of an MRI machine. This causes the axes of the hydrogen protons inside the target, which are usually randomly aligned according to equilibrium, to be lined up in the same direction, creating a magnetic vector oriented along the magnet's axis. This orientation also allows the hydrogen protons' spin, or frequency of rotation, to be measured. The alignment is then disrupted using radiofrequency (RF) pulses (RF being a type of non-ionizing electromagnetic radiation).[45] When the magnetic field is removed, the hydrogen protons return to their equilibrium states in a process known as relaxation, and in doing so they emit RF energy.[46] Different tissues relax at different rates, which allows scientists to use specific RF pulse sequences to emphasize particular tissues or abnormalities.
After a period of time following the RF pulse, the RF energy signals emitted by the protons are measured to obtain frequency information from each location in the imaged plane. Then Fourier transformation is used to convert this frequency information into intensity levels, which are displayed as shades of grey in the generated image.
A FLAIR-weighted axial MRI section showing multiple white matter lesions in the cerebral hemispheres
In general, two aspects of the relaxation process are measured: the time taken for the magnetic vector to return to its resting state (also known as T1 or spin–lattice relaxation), and the time taken for the axial spin of the hydrogen protons to return to its resting state (also known as T2 or spin–spin relaxation).[47] To create a T1-weighted image, the MR signal is measured by changing the amount of time between RF pulses (also known as the time to repeat, or TR). To create a T2-weighted image, the MR signal is measured by changing the amount of time between delivering the RF pulse and receiving the RF energy signals from the hydrogen protons (also known as the time to echo, or TE). The dominant signal intensities of T1 image weighting are fluid (black due to low intensity), muscle (grey due to intermediate signal intensity), and fat (white due to high signal intensity). Fat suppression is applied to many T1 weighted sequences to suppress the brightness of the signal created by it. The dominant signal intensities of T2 image weighting are fluid (white), muscle (grey), and fat (white). T2 signals are also often emphasized or suppressed depending on what the goal of the imaging is; notable examples include fat suppression, fluid attenuation, and susceptibility weighting.
Also of note are proton density (PD) weighted images, which are generated using a long TR and a short TE. PD is useful for differentiating between fluid, hyaline cartilage and fibrocartilage, which makes it ideal for imaging joints. Outside of joint imaging it has largely been replaced by fluid attenuated inversion recovery (FLAIR), an inversion recovery sequence that removes the signal from cerebrospinal fluid.[48]
Tomography
A contrast CT of a pulmonary artery with an embolism. Note the contrast between the embolism (center, grey) and the surrounding blood (black). This is because the blood contains a negative radiocontrast agent; without the radiocontrast, the blood and the embolism may be indistinguishable.Scans of a bronchial tumor taken using CT, PET, PET-CT, and MIP PET
Computed tomography (CT) and positron emission tomography (PET) scans are similar to MRI, but rely on different imaging techniques (X-rays and ionizing radiation, respectively). A variation of CT known as contrast CT also requires the subject to take in a contrast medium called a radiocontrast (typically by oral consumption, enema, or injection). Positive radiocontrast agents such as barium sulfate increase the body's X-ray attenuation, causing the tissue containing them to appear whiter in the X-ray image. Meanwhile, negative agents such as carbon dioxide gas allow X-rays to pass through them easily, causing the tissues containing them to appear darker.[49]
Like magnetic resonance imaging, CT scans use numerous methods to display and measure data, including sequential CT (where the CT table steps from location to location), spiral CT (where the entire X-ray tube is spun around the subject), and electron beam tomography (where only the electron paths are spun using deflection coils). PET scanners don’t have quite as much hardware variation and instead use different radiotracers depending on what the imaging target is. Note that radiotracers are distinct from radiocontrasts; the former relies on radioactive decay to trace its path while the latter is absorbed into specific tissue and affects that tissue's X-ray attenuation. Because these methods are not mutually exclusive, PET and CT can be performed simultaneously using PET-CT scanners, which are used for the majority of modern PET scans.[50]
Either or both of these methods can be used in conjunction with maximum intensity projection (MIP) to convert the scan data into a 3D image. This can be difficult to accomplish due to artifacts created by respiration and bloodflow, which can appear as abnormalities to an untrained eye; however, it's possible to distinguish these artifacts from real disease so long as careful attention is paid to them.[51] When done well, CT and PET scans taken with MIP are excellent for identifying small abnormal tissue growths, especially in the lungs. Scans taken with MIP for this purpose tend to have higher significance than averaged images created with traditional CT.[52]
MIP imaging is also used with magnetic resonance angiography, and research has indicated that it could feasibly be used with MRI.[53] At least one study has shown that MIP MRI actually significantly outperforms single-slice MRI when used by neural networks to classify lesions based on malignancy.[54]
Alignment
A sequence alignment is a way of arranging the sequences of protein, RNA or DNA, to identify regions of similarity that may be a consequence of functional, structural, or evolutionary relationships between the sequences. The concept initially compares only two such sequences in the so called pairwise alignment. Global alignments, which attempt to align every residue in every sequence, are most useful when the sequences in the query set are similar and of roughly equal size. Local alignments are more useful for dissimilar sequences that are suspected to contain regions of similarity or similar sequence motifs within their larger sequence context. Multiple sequence alignment is an extension of pairwise alignment to incorporate more than two sequences at a time. Multiple alignment methods try to align all the sequences in each query set. Multiple alignments are often used in identifying conserved sequence regions across a group of sequences hypothesized to be evolutionarily related.
Purposes of Alignment Visualization:
Aid general understanding of large-scale DNA or protein alignments. When analyzing data, it is helpful to visualize it somehow, to be able to easily spot clear patters or relations.
Visualize alignments for figures and publication. It summarizes the multiple sequence alignment in an easy-to-digest form.
Manually edit and curate automatically generated alignments. Even though there are efficient algorithms, none is perfect and visualization tools provide a way to edit small discrepancies.
Multiple Sequence Alignment of the protein sequences to the left. Colors are used to display similarities among the sequences.
Regular multiple sequence alignment – Aligned sequences of nucleotide or amino acid residues are typically represented as rows within a matrix. Gaps are inserted between the residues so that identical or similar characters are aligned in successive columns. Many sequence visualization programs also use color to display information about the properties of the individual sequence elements; in DNA and RNA sequences, this equates to assigning each nucleotide its own color. In protein alignments color is often used to indicate amino acid properties to aid in judging the conservation of a given amino acid substitution. For multiple sequences the last row in each column is often the consensus sequence determined by the alignment; the consensus sequence is also often represented in graphical format with a sequence logo in which the size of each nucleotide or amino acid letter corresponds to its degree of conservation.
Circular Multiple Sequence Alignment where the start and end of protein sequences can vary to find better matches.
Circular multiple sequence alignment – A common assumption of multiple sequence alignment techniques is that the left- and right-most positions of the input sequences are relevant to the alignment. However, the position where a sequence starts or ends can be totally arbitrary. For instance, when linearizing a circular molecular structure, the start of the sequence is selected randomly. This is relevant, for instance, in the process of multiple sequence alignment of mitochondrial DNA, viroid, viral or other genomes, which have a circular molecular structure.
Spiral display of an alignment of multiple protein sequences.
Spiral multiple sequence alignment – Color is used to display information about the properties of the individual sequence elements. There can also be gaps that make the sequences fit better among themselves. In summary, the topology of the spiral sequence alignment is equivalent to a standard linear matrix, with the advantage that it summarizes very long sequences in a practical way. That means that each individual spiral represents one of the sequences being aligned.
3-dimensional multiple sequence alignment, produced on the 1D-3D Group Alignment Viewer, by RCSB Protein Data Bank.
3D visualization – A common, one-dimensional, representation of a protein sequence is a list of the amino acids that form it. However, 3-dimensional alignment displays the way sequences may match each other. The 1D-3D Group Alignment Viewer, from the RCSD Protein Data Bank, supports exploration of multiple sequence alignments (MSA) at sequence and structure levels for PDB experimental structures and Computed Structure Models (CSMs). It is possible to select proteins and/or residue regions from the MSA to view their 3D structures aligned.
RCSB.org clusters protein entities (PDB experimental structures and CSMs) by sequence identity threshold and UniProt accession. For each cluster, the MSA is calculated using Clustal Omega and displayed in the 1D-3D Group Alignment Viewer using specific color schemes. PDB protein sequence positions are represented in blue if residue was experimentally determined, and in gray if not. CSMs are colored according to their local pLDDT scores.[55]
Phylogenies
Phylogeny of Hoplocercinae
A phylogenetic tree is a branching diagram or a tree showing the evolutionary relationships among various biological species or other entities based upon similarities and differences in their physical or genetic characteristics. It is a visual representation that shows the evolutionary history between a set of species or taxa during a specific time.
Two things are implicitly occurring along the branches of a phylogenetic tree. The first is the passage of time. Deeper nodes are older than the shallower nodes to which they are connected. Thus, deeper nodes indicate both more distant relationships among the terminal taxa that they connect, and a greater age for the most recent common ancestor of those taxa. The second thing is evolutionary modification, or the accumulation of hereditary genetic and/or structural changes along these branches. The term "branch length" typically refers to the number of these changes. If the "branch lengths" of the tree measure these changes, we also call the tree a phylogram. Regular phylogenetic tree – Generally called a dendrogram, it is a diagram with straight lines representing a tree. It would show a column of nodes representing individual taxa, and the remaining nodes represent the clusters to which the data belong, with the arrows representing the distance: a way to measure how different they are (dissimilarity). The distance between merged clusters is monotone, increasing with the level of the merger: the height of each node in the plot is proportional to the value of the intergroup dissimilarity between its two branches.
Cladogram of Primates
Cladogram – It is also a diagram with straight lines representing a tree. The difference between a cladogram and an evolutionary tree is that the cladogram does not show how ancestors are related to descendants, nor does it show how much they have changed. This means that more than one evolutionary tree may correspond to the same cladogram.
Circular phylogenetic tree of environmental sequences of genera within the Marnaviridae
Circular phylogenetic tree – Circular trees are often used to illustrate relationships among members of major groups of extant organisms, and these trees may have many terminal taxa. It might seem counterintuitive, but the same information given in a regular phylogenetic tree is given in a circular genetic tree. The topology of the structure remains the same, and it only changes shape to better fit a lot of information in less space.
Both trees represent COG1222.
3D Visualization – In a phylogram, the evolutionary distance is represented on one of the axes and the genes on the other. For it to be possible to visualize the paralogs, a third axis can be added. In standard (2D) phylogeny layout it is not always easy to distinguish gene duplication events (paralogs) from speciation branching (species), because only one spatial axis (genes) is available to show the mix of these two kinds of information. By contrast, they can be easily distinguished in 3DPE, because it projects them onto two orthogonal axes: species (X) vs. paralogs (Z). For instance, the evolution of many paralogs is visually obvious in the 3DPE view (in the three eukaryote species, on the right), but this pattern is less clear in the 2D representation.[56]
↑ Frank J, Schlichting I (September 2004). "Time-resolved imaging of macromolecular processes and interactions". Journal of Structural Biology. 147 (3): 209–10. doi:10.1016/j.jsb.2004.06.003. PMID15450290.
↑ Waterhouse, A. M., Procter, J. B., Martin, D. M. A., Clamp, M., & Barton, G. J. (2009). Jalview Version 2—a multiple sequence alignment editor and analysis workbench. Bioinformatics, 25(9), 1189-1191.
↑ Katoh, K., & Standley, D. M. (2013). MAFFT multiple sequence alignment software version 7: improvements in performance and usability. Molecular biology and evolution, 30(4), 772-780.
↑ Kumar, S., Stecher, G., Li, M., Knyaz, C., & Tamura, K. (2018). MEGA X: Molecular Evolutionary Genetics Analysis across computing platforms. Molecular biology and evolution, 35(6), 1547-1549.
↑ Sievers, F., Wilm, A., Dineen, D., Gibson, T. J., Karplus, K., Li, W., ... & Higgins, D. G. (2011). Fast, scalable generation of high-quality protein multiple sequence alignments using Clustal Omega. Molecular systems biology, 7(1), 539.
↑ Altschul, S. F., Gish, W., Miller, W., Myers, E. W., & Lipman, D. J. (1990). Basic local alignment search tool. Journal of molecular biology, 215(3), 403-410.
↑ Schneider, T. D., & Stephens, R. M. (1990). Sequence logos: a new way to display consensus sequences. Nucleic Acids Research, 18(20), 6097-6100.
↑ Waterhouse, A. M., Procter, J. B., Martin, D. M. A., Clamp, M., & Barton, G. J. (2009). Jalview Version 2—a multiple sequence alignment editor and analysis workbench. Bioinformatics, 25(9), 1189-1191.
↑ Pettersen, E. F., Goddard, T. D., Huang, C. C., Couch, G. S., Greenblatt, D. M., Meng, E. C., & Ferrin, T. E. (2004). UCSF Chimera—a visualization system for exploratory research and analysis. Journal of computational chemistry, 25(13), 1605-1612.
↑ Kent, W. J., Sugnet, C. W., Furey, T. S., Roskin, K. M., Pringle, T. H., Zahler, A. M., & Haussler, D. (2002). The human genome browser at UCSC. Genome research, 12(6), 996-1006.
↑ Altschul, S. F., Gish, W., Miller, W., Myers, E. W., & Lipman, D. J. (1990). Basic local alignment search tool. Journal of molecular biology, 215(3), 403-410.
↑ McLaren, W., Gil, L., Hunt, S. E., Riat, H. S., Ritchie, G. R., Thormann, A., ... & Cunningham, F. (2016). The ensembl variant effect predictor. Genome biology, 17(1), 1-14.
↑ Felsenstein, J. (1985). Confidence limits on phylogenies: an approach using the bootstrap. Evolution, 39(4), 783-791.
↑ Khatri, P., Sirota, M., & Butte, A. J. (2012). Ten years of pathway analysis: current approaches and outstanding challenges. PLoS computational biology, 8(2), e1002375.
↑ Waterhouse, A. M., Procter, J. B., Martin, D. M. A., Clamp, M., & Barton, G. J. (2009). Jalview Version 2—a multiple sequence alignment editor and analysis workbench. Bioinformatics, 25(9), 1189-1191.
↑ Gajdos, L; Blakeley, M P; Kumar, A (2021). "Visualization of hydrogen atoms in a perdeuterated lectin-fucose complex reveals key details of protein-carbohydrate interactions". Structure. 29 (9): 1003–1013.e4. doi:10.1016/j.str.2021.03.003. PMID33765407.
↑ Labant, MaryAnn (November 1, 2013). "Raising the Bar in Preclinical Imaging". Genetic Engineering & Biotechnology News. Mary Ann Liebert, Inc. Retrieved April 24, 2024.
↑ Ananiadou, Sophia (October 12, 2006). "Text mining and its potential applications in systems biology". Trends in Biotechnology. 24 (12): 571–579. doi:10.1016/j.tibtech.2006.10.002. PMID17045684.
↑ "PET/CT". RadiologyInfo.org. Radiological Society of North America, Inc. May 1, 2023. Retrieved April 14, 2024.
↑ Prokop, M.; Shin, H.O.; Schanz, A.; Schaefer-Prokop, C.M. (March 1997). "Use of maximum intensity projections in CT angiography: a basic review". Radiographics. 17 (2). Board of Directors of the Radiological Society of North America, Inc.: 433–451. doi:10.1148/radiographics.17.2.9084083. PMID9084083.
This page is based on this Wikipedia article Text is available under the CC BY-SA 4.0 license; additional terms may apply. Images, videos and audio are available under their respective licenses.