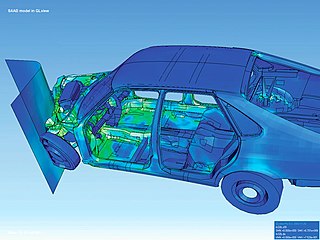
Scientific visualization is an interdisciplinary branch of science concerned with the visualization of scientific phenomena. It is also considered a subset of computer graphics, a branch of computer science. The purpose of scientific visualization is to graphically illustrate scientific data to enable scientists to understand, illustrate, and glean insight from their data. Research into how people read and misread various types of visualizations is helping to determine what types and features of visualizations are most understandable and effective in conveying information.

Visualization, also known as Graphics Visualization, is any technique for creating images, diagrams, or animations to communicate a message. Visualization through visual imagery has been an effective way to communicate both abstract and concrete ideas since the dawn of humanity. from history include cave paintings, Egyptian hieroglyphs, Greek geometry, and Leonardo da Vinci's revolutionary methods of technical drawing for engineering purposes that actively involve scientific requirements.
Thomas Albert "Tom" DeFanti is an American computer graphics researcher and pioneer. His work has ranged from early computer animation, to scientific visualization, virtual reality, and grid computing. He is a distinguished professor of Computer Science at the University of Illinois at Chicago, and a research scientist at the California Institute for Telecommunications and Information Technology (Calit2).

Patrick M. Hanrahan is an American computer graphics researcher, the Canon USA Professor of Computer Science and Electrical Engineering in the Computer Graphics Laboratory at Stanford University. His research focuses on rendering algorithms, graphics processing units, as well as scientific illustration and visualization. He has received numerous awards, including the 2019 Turing Award.
Jock D. Mackinlay is an American information visualization expert and Vice President of Research and Design at Tableau Software. With Stuart Card, George G. Robertson and others he invented a number of information visualization techniques.

Lawrence Jay Rosenblum is an American mathematician, and Program Director for Graphics and Visualization at the National Science Foundation.

Maxine D. Brown is an American computer scientist and retired director of the Electronic Visualization Laboratory (EVL) at the University of Illinois at Chicago (UIC). Along with Tom DeFanti and Bruce McCormick, she co-edited the 1987 NSF report, Visualization in Scientific Computing, which defined the field of scientific visualization.

The Scientific Computing and Imaging (SCI) Institute is a permanent research institute at the University of Utah that focuses on the development of new scientific computing and visualization techniques, tools, and systems with primary applications to biomedical engineering. The SCI Institute is noted worldwide in the visualization community for contributions by faculty, alumni, and staff. Faculty are associated primarily with the School of Computing, Department of Bioengineering, Department of Mathematics, and Department of Electrical and Computer Engineering, with auxiliary faculty in the Medical School and School of Architecture.
The Sidney Fernbach Award established in 1992 by the IEEE Computer Society, in memory of Sidney Fernbach, one of the pioneers in the development and application of high performance computers for the solution of large computational problems as the Division Chief for the Computation Division at Lawrence Livermore Laboratory from the late 1950s through the 1970s. A certificate and $2,000 are awarded for outstanding contributions in the application of high performance computers using innovative approaches. The nomination deadline is 1 July each year.
Sheelagh Carpendale is a Canadian artist and computer scientist working in the field of information visualization and human-computer interaction.
Social visualization is an interdisciplinary intersection of information visualization to study creating intuitive depictions of massive and complex social interactions for social purposes. By visualizing those interactions made not only in the cyberspace including social media but also the physical world, captured through sensors, it can reveal overall patterns of social memes or it highlights one individual's implicit behaviors in diverse social spaces. In particular, it is the study “primarily concerned with the visualization of text, audio, and visual interaction data to uncover social connections and interaction patterns in online and physical spaces. ACM Computing Classification System has classified this field of study under the category of Human-Centered Computing (1st) and Information Visualization (2nd) as a third level concept in a general sense.
Claudio Silva is a Brazilian American computer scientist and data scientist. He is a professor of computer science and engineering at the New York University Tandon School of Engineering, the head of disciplines at the NYU Center for Urban Science and Progress (CUSP) and affiliate faculty member at NYU's Courant Institute of Mathematical Sciences. He co-developed the open-source data-exploration system VisTrails with his wife Juliana Freire and many other collaborators. He is a former chair of the executive committee for the IEEE Computer Society Technical Committee on Visualization and Graphics.

The Kahlert School of Computing is a school within the College of Engineering at the University of Utah in Salt Lake City, Utah.

Bedrich Benes is a computer scientist and a researcher in computer graphics.
Gordon L. Kindlmann is an American computer scientist who works on information visualization and image analysis. He is recognized for his contributions in developing tools for tensor data visualization.
The IEEE Visualization Conference (VIS) is an annual conference on scientific visualization, information visualization, and visual analytics administrated by the IEEE Computer Society Technical Committee on Visualization and Graphics. As ranked by Google Scholar's h-index metric in 2016, VIS is the highest rated venue for visualization research and the second-highest rated conference for computer graphics over all. It has an 'A' rating from the Australian Ranking of ICT Conferences, an 'A' rating from the Brazilian ministry of education, and an 'A' rating from the China Computer Federation (CCF). The conference is highly selective with generally < 25% acceptance rates for all papers.
Charles "Chuck" D. Hansen is an American computer scientist at the University of Utah who works on scientific visualization. He is a Distinguished Professor, a Fellow of the IEEE and a founding faculty member of the Scientific Computing and Imaging Institute. He was an associate editor-in-chief of IEEE Transactions on Visualization and Graphics.

Hanspeter Pfister is a Swiss computer scientist. He is the An Wang Professor of Computer Science at the Harvard John A. Paulson School of Engineering and Applied Sciences and an affiliate faculty member of the Center for Brain Science at Harvard University. His research in visual computing lies at the intersection of scientific visualization, information visualization, computer graphics, and computer vision and spans a wide range of topics, including biomedical image analysis and visualization, image and video analysis, and visual analytics in data science.

Kwan-Liu Ma is an American computer scientist. He was born and grew up in Taipei, Taiwan and came to the United States pursuing advanced study in 1983. He is a distinguished professor of computer science at the University of California, Davis. His research interests include visualization, computer graphics, human computer interaction, and high-performance computing.
Jessica Hullman is a computer scientist and the Ginni Rometty professor of Computer Science at Northwestern University. She is known for her research in Information visualization and Uncertainty quantification.


