OpenDX stands for Open Data Explorer and is IBM's scientific data visualization software. It can handle complex domains along with measured or computed data. The data may be scalar, vector or tensor fields at different points of the object. The points at which data is measured don't have to be equally spaced and not need to be homogeneously spaced. The project started in 1991 as Visualization Data Explorer.

Scientific visualization is an interdisciplinary branch of science concerned with the visualization of scientific phenomena. It is also considered a subset of computer graphics, a branch of computer science. The purpose of scientific visualization is to graphically illustrate scientific data to enable scientists to understand, illustrate, and glean insight from their data. Research into how people read and misread various types of visualizations is helping to determine what types and features of visualizations are most understandable and effective in conveying information.

Visualization or visualisation is any technique for creating images, diagrams, or animations to communicate a message. Visualization through visual imagery has been an effective way to communicate both abstract and concrete ideas since the dawn of humanity. Examples from history include cave paintings, Egyptian hieroglyphs, Greek geometry, and Leonardo da Vinci's revolutionary methods of technical drawing for engineering and scientific purposes.

In scientific visualization and computer graphics, volume rendering is a set of techniques used to display a 2D projection of a 3D discretely sampled data set, typically a 3D scalar field.
Volume is the quantity of space an object occupies in a 3D space.

Marching cubes is a computer graphics algorithm, published in the 1987 SIGGRAPH proceedings by Lorensen and Cline, for extracting a polygonal mesh of an isosurface from a three-dimensional discrete scalar field. The applications of this algorithm are mainly concerned with medical visualizations such as CT and MRI scan data images, and special effects or 3-D modelling with what is usually called metaballs or other metasurfaces. The marching cubes algorithm is meant to be used for 3-D; the 2-D version of this algorithm is called the marching squares algorithm.

ParaView is an open-source multiple-platform application for interactive, scientific visualization. It has a client–server architecture to facilitate remote visualization of datasets, and generates level of detail (LOD) models to maintain interactive frame rates for large datasets. It is an application built on top of the Visualization Toolkit (VTK) libraries. ParaView is an application designed for data parallelism on shared-memory or distributed-memory multicomputers and clusters. It can also be run as a single-computer application.

An implicit k-d tree is a k-d tree defined implicitly above a rectilinear grid. Its split planes' positions and orientations are not given explicitly but implicitly by some recursive splitting-function defined on the hyperrectangles belonging to the tree's nodes. Each inner node's split plane is positioned on a grid plane of the underlying grid, partitioning the node's grid into two subgrids.
VisIt is an open-source interactive parallel visualization and graphical analysis tool for viewing scientific data. It can be used to visualize scalar and vector fields defined on 2D and 3D structured and unstructured meshes. VisIt was designed to handle very large data set sizes in the terascale range and yet can also handle small data sets in the kilobyte range.
Visualization Library (VL) is an open source C++ middleware for 2D/3D graphics applications based on OpenGL 4, designed to develop portable applications for the Microsoft Windows, Linux and Mac OS X operating systems.

Lawrence Jay Rosenblum is an American mathematician, and Program Director for Graphics and Visualization at the National Science Foundation.

The Scientific Computing and Imaging (SCI) Institute is a permanent research institute at the University of Utah that focuses on the development of new scientific computing and visualization techniques, tools, and systems with primary applications to biomedical engineering. The SCI Institute is noted worldwide in the visualization community for contributions by faculty, alumni, and staff. Faculty are associated primarily with the School of Computing, Department of Bioengineering, Department of Mathematics, and Department of Electrical and Computer Engineering, with auxiliary faculty in the Medical School and School of Architecture.

Voreen is an open-source volume visualization library and development platform. Through the use of GPU-based volume rendering techniques it allows high frame rates on standard graphics hardware to support interactive volume exploration.

Christopher Ray Johnson is an American computer scientist. He is a distinguished professor of computer science at the University of Utah, and founding director of the Scientific Computing and Imaging Institute (SCI). His research interests are in the areas of scientific computing and scientific visualization.
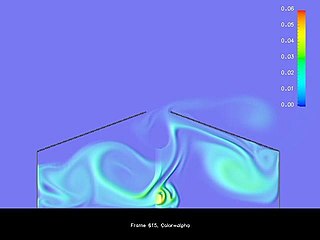
In scientific visualization, Lagrangian–Eulerian advection is a technique mainly used for the visualization of unsteady flows. The computer graphics generated by the technique can help scientists visualize changes in velocity fields. This technique uses a hybrid Lagrangian and Eulerian specification of the flow field. It is a special case of a line integral convolution.
In scientific visualization a tensor glyph is an object that can visualize all or most of the nine degrees of freedom, such as acceleration, twist, or shear – of a matrix. It is used for tensor field visualization, where a data-matrix is available at every point in the grid. "Glyphs, or icons, depict multiple data values by mapping them onto the shape, size, orientation, and surface appearance of a base geometric primitive." Tensor glyphs are a particular case of multivariate data glyphs.

Amira is a software platform for 3D and 4D data visualization, processing, and analysis. It is being actively developed by Thermo Fisher Scientific in collaboration with the Zuse Institute Berlin (ZIB), and commercially distributed by Thermo Fisher Scientific.
Gordon L. Kindlmann is an American computer scientist who works on information visualization and image analysis. He is recognized for his contributions in developing tools for tensor data visualization.
The IEEE Visualization Conference (VIS) is an annual conference on scientific visualization, information visualization, and visual analytics administrated by the IEEE Computer Society Technical Committee on Visualization and Graphics. As ranked by Google Scholar's h-index metric in 2016, VIS is the highest rated venue for visualization research and the second-highest rated conference for computer graphics over all. It has an 'A' rating from the Australian Ranking of ICT Conferences, an 'A' rating from the Brazilian ministry of education, and an 'A' rating from the China Computer Federation (CCF). The conference is highly selective with generally < 25% acceptance rates for all papers.

Hanspeter Pfister is a Swiss computer scientist. He is the An Wang Professor of Computer Science at the Harvard John A. Paulson School of Engineering and Applied Sciences and an affiliate faculty member of the Center for Brain Science at Harvard University. His research in visual computing lies at the intersection of scientific visualization, information visualization, computer graphics, and computer vision and spans a wide range of topics, including biomedical image analysis and visualization, image and video analysis, and visual analytics in data science.
