Computer animation is the process used for digitally generating moving images. The more general term computer-generated imagery (CGI) encompasses both still images and moving images, while computer animation only refers to moving images. Modern computer animation usually uses 3D computer graphics.
Autodesk 3ds Max, formerly 3D Studio and 3D Studio Max, is a professional 3D computer graphics program for making 3D animations, models, games and images. It is developed and produced by Autodesk Media and Entertainment. It has modeling capabilities and a flexible plugin architecture and must be used on the Microsoft Windows platform. It is frequently used by video game developers, many TV commercial studios, and architectural visualization studios. It is also used for movie effects and movie pre-visualization. 3ds Max features shaders, dynamic simulation, particle systems, radiosity, normal map creation and rendering, global illumination, a customizable user interface, and its own scripting language.

A particle system is a technique in game physics, motion graphics, and computer graphics that uses many minute sprites, 3D models, or other graphic objects to simulate certain kinds of "fuzzy" phenomena, which are otherwise very hard to reproduce with conventional rendering techniques – usually highly chaotic systems, natural phenomena, or processes caused by chemical reactions.

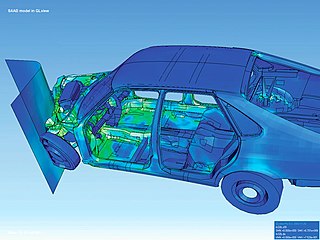
Scientific visualization is an interdisciplinary branch of science concerned with the visualization of scientific phenomena. It is also considered a subset of computer graphics, a branch of computer science. The purpose of scientific visualization is to graphically illustrate scientific data to enable scientists to understand, illustrate, and glean insight from their data. Research into how people read and misread various types of visualizations is helping to determine what types and features of visualizations are most understandable and effective in conveying information.

Visualization, also known as Graphics Visualization, is any technique for creating images, diagrams, or animations to communicate a message. Visualization through visual imagery has been an effective way to communicate both abstract and concrete ideas since the dawn of humanity. from history include cave paintings, Egyptian hieroglyphs, Greek geometry, and Leonardo da Vinci's revolutionary methods of technical drawing for engineering purposes that actively involve scientific requirements.

In scientific visualization and computer graphics, volume rendering is a set of techniques used to display a 2D projection of a 3D discretely sampled data set, typically a 3D scalar field.

Crowd simulation is the process of simulating the movement of a large number of entities or characters. It is commonly used to create virtual scenes for visual media like films and video games, and is also used in crisis training, architecture and urban planning, and evacuation simulation.
Bill Hibbard is a scientist at the University of Wisconsin–Madison Space Science and Engineering Center working on visualization and machine intelligence. He is principal author of the Vis5D, Cave5D, and VisAD open-source visualization systems. Vis5D was the first system to produce fully interactive animated 3D displays of time-dynamic volumetric data sets and the first open-source 3D visualization system.

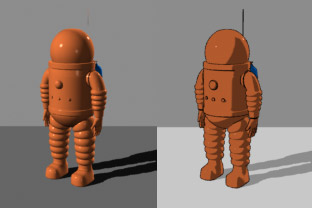
Non-photorealistic rendering (NPR) is an area of computer graphics that focuses on enabling a wide variety of expressive styles for digital art, in contrast to traditional computer graphics, which focuses on photorealism. NPR is inspired by other artistic modes such as painting, drawing, technical illustration, and animated cartoons. NPR has appeared in movies and video games in the form of cel-shaded animation as well as in scientific visualization, architectural illustration and experimental animation.
Digital puppetry is the manipulation and performance of digitally animated 2D or 3D figures and objects in a virtual environment that are rendered in real-time by computers. It is most commonly used in filmmaking and television production but has also been used in interactive theme park attractions and live theatre.

Motion graphics are pieces of animation or digital footage that create the illusion of motion or rotation, and are usually combined with audio for use in multimedia projects. Motion graphics are usually displayed via electronic media technology, but may also be displayed via manual powered technology. The term distinguishes static graphics from those with a transforming appearance over time, without over-specifying the form. While any form of experimental or abstract animation can be called motion graphics, the term typically more explicitly refers to the commercial application of animation and effects to video, film, TV, and interactive applications.
Interactive skeleton-driven simulation is a scientific computer simulation technique used to approximate realistic physical deformations of dynamic bodies in real-time. It involves using elastic dynamics and mathematical optimizations to decide the body-shapes during motion and interaction with forces. It has various applications within realistic simulations for medicine, 3D computer animation and virtual reality.

Fluid animation refers to computer graphics techniques for generating realistic animations of fluids such as water and smoke. Fluid animations are typically focused on emulating the qualitative visual behavior of a fluid, with less emphasis placed on rigorously correct physical results, although they often still rely on approximate solutions to the Euler equations or Navier–Stokes equations that govern real fluid physics. Fluid animation can be performed with different levels of complexity, ranging from time-consuming, high-quality animations for films, or visual effects, to simple and fast animations for real-time animations like computer games.
Sirius is a molecular modelling and analysis system developed at San Diego Supercomputer Center. Sirius is designed to support advanced user requirements that go beyond simple display of small molecules and proteins. Sirius supports high quality interactive 3D graphics, structure building, displaying protein or DNA primary sequences, access to remote data sources, and visualizing molecular dynamics trajectories. It can be used for scientific visualization and analysis, and chemistry and biology instruction.

Computer graphics deals with generating images and art with the aid of computers. Computer graphics is a core technology in digital photography, film, video games, digital art, cell phone and computer displays, and many specialized applications. A great deal of specialized hardware and software has been developed, with the displays of most devices being driven by computer graphics hardware. It is a vast and recently developed area of computer science. The phrase was coined in 1960 by computer graphics researchers Verne Hudson and William Fetter of Boeing. It is often abbreviated as CG, or typically in the context of film as computer generated imagery (CGI). The non-artistic aspects of computer graphics are the subject of computer science research.

ArcGIS CityEngine is a commercial three-dimensional (3D) modeling program developed by Esri R&D Center Zurich and specialises in the generation of 3D urban environments. Using a procedural modeling approach, it supports the creation of detailed large-scale 3D city models. CityEngine works with architectural object placement and arrangement in the same manner that software like VUE manages terrain, ecosystems and atmosphere mapping. Unlike the traditional 3D modeling methodology which uses Computer-Aided Design (CAD) tools and techniques, CityEngine takes a different approach to shape generation via a rule-based system. It can also use Geographic Information System (GIS) datasets due to its integration with the wider Esri/ArcGIS platform. Due to this unique feature set, CityEngine has been used in academic research and built environment professions, e.g., urban planning, architecture, visualization, game development, entertainment, archeology, military and cultural heritage. CityEngine can be used within Building Information Model (BIM) workflows as well as visualizing the data of buildings in a larger urban context, enhancing its working scenario toward real construction projects.
VisAD is a Java component library for interactive and collaborative visualization and analysis of numerical data. It combines a flexible data model and distributed objects to support sharing of data, visualizations and user interfaces between different data sources, different computers and different scientific disciplines. It is licensed under the GNU LGPL.

Computer-generated imagery (CGI) is a specific-technology or application of computer graphics for creating or improving images in art, printed media, simulators, videos and video games. These images are either static or dynamic. CGI both refers to 2D computer graphics and 3D computer graphics with the purpose of designing characters, virtual worlds, or scenes and special effects. The application of CGI for creating/improving animations is called computer animation, or CGI animation.
Physically based animation is an area of interest within computer graphics concerned with the simulation of physically plausible behaviors at interactive rates. Advances in physically based animation are often motivated by the need to include complex, physically inspired behaviors in video games, interactive simulations, and movies. Although off-line simulation methods exist to solve most all of the problems studied in physically-based animation, these methods are intended for applications that necessitate physical accuracy and slow, detailed computations. In contrast to methods common in offline simulation, techniques in physically based animation are concerned with physical plausibility, numerical stability, and visual appeal over physical accuracy. Physically based animation is often limited to loose approximations of physical behaviors because of the strict time constraints imposed by interactive applications. The target frame rate for interactive applications such as games and simulations is often 25-60 hertz, with only a small fraction of the time allotted to an individual frame remaining for physical simulation. Simplified models of physical behaviors are generally preferred if they are more efficient, easier to accelerate, or satisfy desirable mathematical properties. Fine details are not important when the overriding goal of a visualization is aesthetic appeal or the maintenance of player immersion since these details are often difficult for humans to notice or are otherwise impossible to distinguish at human scales.

A virtual human is a software fictional character or human being. Virtual humans have been created as tools and artificial companions in simulation, video games, film production, human factors and ergonomic and usability studies in various industries, clothing industry, telecommunications (avatars), medicine, etc. These applications require domain-dependent simulation fidelity. A medical application might require an exact simulation of specific internal organs; film industry requires highest aesthetic standards, natural movements, and facial expressions; ergonomic studies require faithful body proportions for a particular population segment and realistic locomotion with constraints, etc.


