Related Research Articles

A stock market, equity market, or share market is the aggregation of buyers and sellers of stocks, which represent ownership claims on businesses; these may include securities listed on a public stock exchange as well as stock that is only traded privately, such as shares of private companies that are sold to investors through equity crowdfunding platforms. Investments are usually made with an investment strategy in mind.

A stock market crash is a sudden dramatic decline of stock prices across a major cross-section of a stock market, resulting in a significant loss of paper wealth. Crashes are driven by panic selling and underlying economic factors. They often follow speculation and economic bubbles.
A market trend is a perceived tendency of the financial markets to move in a particular direction over time. Analysts classify these trends as secular for long time-frames, primary for medium time-frames, and secondary for short time-frames. Traders attempt to identify market trends using technical analysis, a framework which characterizes market trends as predictable price tendencies within the market when price reaches support and resistance levels, varying over time.
In finance, technical analysis is an analysis methodology for analysing and forecasting the direction of prices through the study of past market data, primarily price and volume. As a type of active management, it stands in contradiction to much of modern portfolio theory. The efficacy of technical analysis is disputed by the efficient-market hypothesis, which states that stock market prices are essentially unpredictable, and research on whether technical analysis offers any benefit has produced mixed results. It is distinguished from fundamental analysis, which considers a company's financial statements, health, and the overall state of the market and economy.

In finance, being short in an asset means investing in such a way that the investor will profit if the market value of the asset falls. This is the opposite of the more common long position, where the investor will profit if the market value of the asset rises. An investor that sells an asset short is, as to that asset, a short seller.

Day trading is a form of speculation in securities in which a trader buys and sells a financial instrument within the same trading day, so that all positions are closed before the market closes for the trading day to avoid unmanageable risks and negative price gaps between one day's close and the next day's price at the open. Traders who trade in this capacity are generally classified as speculators. Day trading contrasts with the long-term trades underlying buy-and-hold and value investing strategies. Day trading may require fast trade execution, sometimes as fast as milli-seconds in scalping, therefore direct-access day trading software is often needed.
The Dow theory on stock price movement is a form of technical analysis that includes some aspects of sector rotation. The theory was derived from 255 editorials in The Wall Street Journal written by Charles H. Dow (1851–1902), journalist, founder and first editor of The Wall Street Journal and co-founder of Dow Jones and Company. Following Dow's death, William Peter Hamilton, Robert Rhea and E. George Schaefer organized and collectively represented Dow theory, based on Dow's editorials. Dow himself never used the term Dow theory nor presented it as a trading system.

In finance, a dead cat bounce is a small, brief recovery in the price of a declining stock. Derived from the idea that "even a dead cat will bounce if it falls from a great height", the phrase is also popularly applied to any case where a subject experiences a brief resurgence during or following a severe decline. This may also be known as a "sucker rally".
The January effect is a hypothesis that there is a seasonal anomaly in the financial market where securities' prices increase in the month of January more than in any other month. This calendar effect would create an opportunity for investors to buy stocks for lower prices before January and sell them after their value increases. As with all calendar effects, if true, it would suggest that the market is not efficient, as market efficiency would suggest that this effect should disappear.
Market timing is the strategy of making buying or selling decisions of financial assets by attempting to predict future market price movements. The prediction may be based on an outlook of market or economic conditions resulting from technical or fundamental analysis. This is an investment strategy based on the outlook for an aggregate market rather than for a particular financial asset.

A stock trader or equity trader or share trader, also called a stock investor, is a person or company involved in trading equity securities and attempting to profit from the purchase and sale of those securities. Stock traders may be an investor, agent, hedger, arbitrageur, speculator, or stockbroker. Such equity trading in large publicly traded companies may be through a stock exchange. Stock shares in smaller public companies may be bought and sold in over-the-counter (OTC) markets or in some instances in equity crowdfunding platforms.
Momentum investing is a system of buying stocks or other securities that have had high returns over the past three-to-twelve months, and selling those that have had poor returns over the same period.

Santa Claus is a legendary figure originating in Western Christian culture who is said to bring gifts during the late evening and overnight hours on Christmas Eve. Christmas elves are said to make the gifts in Santa's workshop, while flying reindeer pull his sleigh through the air.
The Nasdaq Composite is a stock market index that includes almost all stocks listed on the Nasdaq stock exchange. Along with the Dow Jones Industrial Average and S&P 500, it is one of the three most-followed stock market indices in the United States. The composition of the NASDAQ Composite is heavily weighted towards companies in the information technology sector. The Nasdaq-100, which includes 100 of the largest non-financial companies in the Nasdaq Composite, accounts for about 80% of the index weighting of the Nasdaq Composite.

Freeform's 25 Days of Christmas is an American annual seasonal event of Christmas programming broadcast during the month of December by the U.S. cable network Freeform. The event was first held in 1996, and has been an annual fixture of the channel through its various incarnations, including The Family Channel, Fox Family, ABC Family, and Freeform. The brand covers airings of classic holiday specials as well as new Christmas-themed television movies each year; generally few of the network's original series air during the time period, outside of Christmas-themed episodes. In 2006, the lineup has also included airings of general, family films that Freeform holds rights to, which included the Harry Potter films until January 2017, and other Walt Disney Studios Motion Pictures films. In 2007, the block was extended to November with a Countdown to 25 Days of Christmas block. 25 Days of Christmas programming often attracts major surges in viewership for Freeform, with higher-profile film airings often attracting 3–4 million viewers or more.

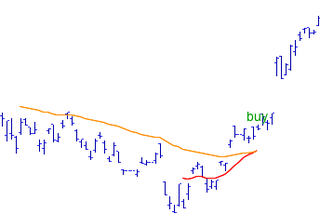
In the statistics of time series, and in particular the stock market technical analysis, a moving-average crossover occurs when, on plotting two moving averages each based on different degrees of smoothing, the traces of these moving averages cross. It does not predict future direction but shows trends. This indicator uses two moving averages, a slower moving average and a faster moving average. The faster moving average is a short term moving average. For end-of-day stock markets, for example, it may be 5-, 10- or 25-day period while the slower moving average is medium or long term moving average. A short term moving average is faster because it only considers prices over short period of time and is thus more reactive to daily price changes. On the other hand, a long term moving average is deemed slower as it encapsulates prices over a longer period and is more lethargic. However, it tends to smooth out price noises which are often reflected in short term moving averages.
The Congressional effect is a stock market phenomenon or calendar effect, where stock prices tend to show a correlation in performance and volatility to the operating schedules of the US Congress. The phenomenon was coined as “The Congressional effect” by Eric T. Singer, a New York based finance professional and mutual fund manager.

Mark J. Hulbert is an American finance analyst, journalist, and author with a focus on expectations of stock market investment newsletters, contrarian investing, and quantitive or technical analysis.
Best Christmas Ever is a seasonal program block on AMC, an American cable and satellite network. The block, launched in 2018, airs Christmas-themed television specials and feature films from late November until the day after Christmas.
In January 2021, a short squeeze of the stock of the American video game retailer GameStop and other securities took place, causing major financial consequences for certain hedge funds and large losses for short sellers. Approximately 140 percent of GameStop's public float had been sold short, and the rush to buy shares to cover those positions as the price rose caused it to rise even further. The short squeeze was initially and primarily triggered by users of the subreddit r/wallstreetbets, an Internet forum on the social news website Reddit, although a number of hedge funds also participated. At its height, on January 28, the short squeeze caused the retailer's stock price to reach a pre-market value of over US$500 per share, nearly 30 times the $17.25 valuation at the beginning of the month. The price of many other heavily shorted securities and cryptocurrencies also increased.
References
- ↑ Ro, Sam (December 24, 2020). "Santa Claus Rally". Yahoo .
- 1 2 3 4 5 KENTON, WILL (November 8, 2018). "Santa Claus Rally". Investopedia .
- 1 2 3 4 Pisani, Bob (December 21, 2018). "The Santa Claus rally: No ho-ho-ho". CNBC .
- ↑ Hulbert, Mark (November 21, 2018). "Opinion: Santa Claus Rally is just another Christmas story". MarketWatch .
- ↑ Agrrawal, Pankaj; Skaves, Matthew (31 August 2015). "Seasonality in Stock and Bond ETFs (2001—2014): The Months Are Getting Mixed Up but Santa Delivers on Time". The Journal of Investing. 24 (3): 129–143. doi:10.3905/joi.2015.24.3.129. S2CID 155997185.
- ↑ Nesto, Matt (December 18, 2012). "The Santa Claus Rally: It's Not Make Believe".
- ↑ Hulbert, Mark (January 2, 2019). "Opinion: 2018's stock-market Santa rally is leaving this message for 2019". MarketWatch .