In a chemical reaction, chemical equilibrium is the state in which both the reactants and products are present in concentrations which have no further tendency to change with time, so that there is no observable change in the properties of the system. This state results when the forward reaction proceeds at the same rate as the reverse reaction. The reaction rates of the forward and backward reactions are generally not zero, but they are equal. Thus, there are no net changes in the concentrations of the reactants and products. Such a state is known as dynamic equilibrium.
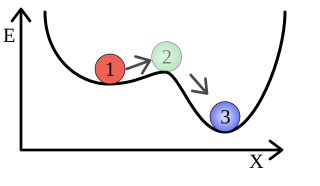
In chemistry and physics, metastability is an intermediate energetic state within a dynamical system other than the system's state of least energy. A ball resting in a hollow on a slope is a simple example of metastability. If the ball is only slightly pushed, it will settle back into its hollow, but a stronger push may start the ball rolling down the slope. Bowling pins show similar metastability by either merely wobbling for a moment or tipping over completely. A common example of metastability in science is isomerisation. Higher energy isomers are long lived because they are prevented from rearranging to their preferred ground state by barriers in the potential energy.
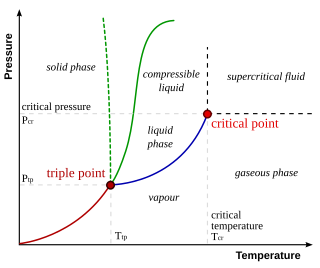
In thermodynamics, the triple point of a substance is the temperature and pressure at which the three phases of that substance coexist in thermodynamic equilibrium. It is that temperature and pressure at which the sublimation, fusion, and vaporisation curves meet. For example, the triple point of mercury occurs at a temperature of −38.8 °C (−37.8 °F) and a pressure of 0.165 mPa.
In chemistry, Le Chatelier's principle is a principle used to predict the effect of a change in conditions on chemical equilibrium. Other names include Chatelier's principle, Braun–Le Chatelier principle, Le Chatelier–Braun principle or the equilibrium law.
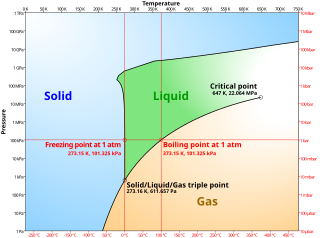
A phase diagram in physical chemistry, engineering, mineralogy, and materials science is a type of chart used to show conditions at which thermodynamically distinct phases occur and coexist at equilibrium.

The phase space of a physical system is the set of all possible physical states of the system when described by a given parameterization. Each possible state corresponds uniquely to a point in the phase space. For mechanical systems, the phase space usually consists of all possible values of the position and momentum parameters. It is the direct product of direct space and reciprocal space. The concept of phase space was developed in the late 19th century by Ludwig Boltzmann, Henri Poincaré, and Josiah Willard Gibbs.

In thermodynamics, the Gibbs free energy is a thermodynamic potential that can be used to calculate the maximum amount of work, other than pressure–volume work, that may be performed by a thermodynamically closed system at constant temperature and pressure. It also provides a necessary condition for processes such as chemical reactions that may occur under these conditions. The Gibbs free energy is expressed as where:
In thermodynamics, the phase rule is a general principle governing multi-component, multi-phase systems in thermodynamic equilibrium. For a system without chemical reactions, it relates the number of freely varying intensive properties to the number of components, the number of phases, and number of ways of performing work on the system :

In economics, an Edgeworth box, sometimes referred to as an Edgeworth-Bowley box, is a graphical representation of a market with just two commodities, X and Y, and two consumers. The dimensions of the box are the total quantities Ωx and Ωy of the two goods.

In electrochemistry, and more generally in solution chemistry, a Pourbaix diagram, also known as a potential/pH diagram, EH–pH diagram or a pE/pH diagram, is a plot of possible thermodynamically stable phases of an aqueous electrochemical system. Boundaries (50 %/50 %) between the predominant chemical species are represented by lines. As such a Pourbaix diagram can be read much like a standard phase diagram with a different set of axes. Similarly to phase diagrams, they do not allow for reaction rate or kinetic effects. Beside potential and pH, the equilibrium concentrations are also dependent upon, e.g., temperature, pressure, and concentration. Pourbaix diagrams are commonly given at room temperature, atmospheric pressure, and molar concentrations of 10−6 and changing any of these parameters will yield a different diagram.
An Ellingham diagram is a graph showing the temperature dependence of the stability of compounds. This analysis is usually used to evaluate the ease of reduction of metal oxides and sulfides. These diagrams were first constructed by Harold Ellingham in 1944. In metallurgy, the Ellingham diagram is used to predict the equilibrium temperature between a metal, its oxide, and oxygen — and by extension, reactions of a metal with sulfur, nitrogen, and other non-metals. The diagrams are useful in predicting the conditions under which an ore will be reduced to its metal. The analysis is thermodynamic in nature and ignores reaction kinetics. Thus, processes that are predicted to be favourable by the Ellingham diagram can still be slow.

Hammond's postulate, is a hypothesis in physical organic chemistry which describes the geometric structure of the transition state in an organic chemical reaction. First proposed by George Hammond in 1955, the postulate states that:
If two states, as, for example, a transition state and an unstable intermediate, occur consecutively during a reaction process and have nearly the same energy content, their interconversion will involve only a small reorganization of the molecular structures.
Thermodynamic databases contain information about thermodynamic properties for substances, the most important being enthalpy, entropy, and Gibbs free energy. Numerical values of these thermodynamic properties are collected as tables or are calculated from thermodynamic datafiles. Data is expressed as temperature-dependent values for one mole of substance at the standard pressure of 101.325 kPa, or 100 kPa. Both of these definitions for the standard condition for pressure are in use.

In theoretical chemistry, an energy profile is a theoretical representation of a chemical reaction or process as a single energetic pathway as the reactants are transformed into products. This pathway runs along the reaction coordinate, which is a parametric curve that follows the pathway of the reaction and indicates its progress; thus, energy profiles are also called reaction coordinate diagrams. They are derived from the corresponding potential energy surface (PES), which is used in computational chemistry to model chemical reactions by relating the energy of a molecule(s) to its structure.
In chemistry, chemical stability is the thermodynamic stability of a chemical system, in particular a chemical compound or a polymer.

In thermodynamic equilibrium, a necessary condition for stability is that pressure, , does not increase with volume, or molar volume, ; this is expressed mathematically as , where is the temperature. This basic stability requirement, and similar ones for other conjugate pairs of variables, is violated in analytic models of first order phase transitions. The most famous case is the van der Waals equation,
George Simms Hammond was an American scientist and theoretical chemist who developed "Hammond's postulate", and fathered organic photochemistry,–the general theory of the geometric structure of the transition state in an organic chemical reaction. Hammond's research is also known for its influence on the philosophy of science. His research garnered him the Norris Award in 1968, the Priestley Medal in 1976, the National Medal of Science in 1994, and the Othmer Gold Medal in 2003. He served as the executive chairman of the Allied Chemical Corporation from 1979 to 1989.

In thermodynamics, the limit of local stability against phase separation with respect to small fluctuations is clearly defined by the condition that the second derivative of Gibbs free energy is zero.
Unimolecular ion decomposition is the fragmentation of a gas phase ion in a reaction with a molecularity of one. Ions with sufficient internal energy may fragment in a mass spectrometer, which in some cases may degrade the mass spectrometer performance, but in other cases, such as tandem mass spectrometry, the fragmentation can reveal information about the structure of the ion.
In physics, geometrothermodynamics (GTD) is a formalism developed in 2007 by Hernando Quevedo to describe the properties of thermodynamic systems in terms of concepts of differential geometry.
