
The speed of sound is the distance travelled per unit of time by a sound wave as it propagates through an elastic medium. More simply, the speed of sound is how fast vibrations travel. At 20 °C (68 °F), the speed of sound in air, is about 343 m/s, or 1 km in 2.91 s or one mile in 4.69 s. It depends strongly on temperature as well as the medium through which a sound wave is propagating.

Echo sounding or depth sounding is the use of sonar for ranging, normally to determine the depth of water (bathymetry). It involves transmitting acoustic waves into water and recording the time interval between emission and return of a pulse; the resulting time of flight, along with knowledge of the speed of sound in water, allows determining the distance between sonar and target. This information is then typically used for navigation purposes or in order to obtain depths for charting purposes.
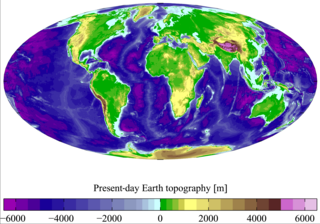
Physical oceanography is the study of physical conditions and physical processes within the ocean, especially the motions and physical properties of ocean waters.
The mesopelagiczone, also known as the middle pelagic or twilight zone, is the part of the pelagic zone that lies between the photic epipelagic and the aphotic bathypelagic zones. It is defined by light, and begins at the depth where only 1% of incident light reaches and ends where there is no light; the depths of this zone are between approximately 200 to 1,000 meters below the ocean surface.

A thermocline is a distinct layer based on temperature within a large body of fluid with a high gradient of distinct temperature differences associated with depth. In the ocean, the thermocline divides the upper mixed layer from the calm deep water below.

The surface layer is the layer of a turbulent fluid most affected by interaction with a solid surface or the surface separating a gas and a liquid where the characteristics of the turbulence depend on distance from the interface. Surface layers are characterized by large normal gradients of tangential velocity and large concentration gradients of any substances transported to or from the interface.
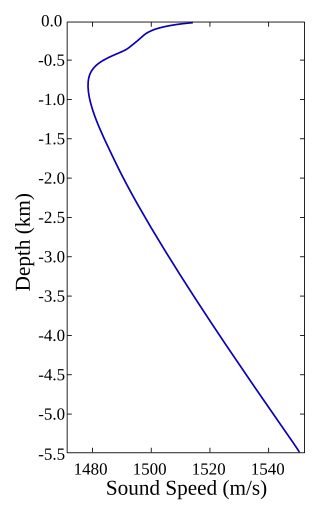
The SOFAR channel, or deep sound channel (DSC), is a horizontal layer of water in the ocean at which depth the speed of sound is at its minimum. The SOFAR channel acts as a waveguide for sound, and low frequency sound waves within the channel may travel thousands of miles before dissipating. An example was reception of coded signals generated by the US Navy-chartered ocean surveillance vessel Cory Chouest off Heard Island, located in the southern Indian Ocean, by hydrophones in portions of all five major ocean basins and as distant as the North Atlantic and North Pacific.
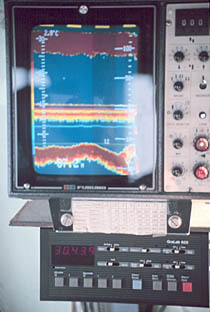
A fishfinder or sounder (Australia) is a sonar instrument used on boats to identify aquatic animals, underwater topography and other objects by detecting reflected pulses of sound energy, usually during fishing activities. A modern fishfinder displays measurements of reflected sound on a graphical display, allowing an operator to interpret information to locate schools of fish, underwater debris and snags, and the bottom of a body of water. Fishfinder instruments are used both by recreational and commercial fishermen, as well as by marine biologists. Modern electronics allow a high degree of integration between the fishfinder system, marine radar, compass and GPS navigation systems.

A pycnocline is the cline or layer where the density gradient is greatest within a body of water. An ocean current is generated by the forces such as breaking waves, temperature and salinity differences, wind, Coriolis effect, and tides caused by the gravitational pull of celestial bodies. In addition, the physical properties in a pycnocline driven by density gradients also affect the flows and vertical profiles in the ocean. These changes can be connected to the transport of heat, salt, and nutrients through the ocean, and the pycnocline diffusion controls upwelling.
Isopycnals are layers within the ocean that are stratified based on their densities and can be shown as a line connecting points of a specific density or potential density on a graph. Isopycnals are often displayed graphically to help visualize "layers" of the water in the ocean or gases in the atmosphere in a similar manner to how contour lines are used in topographic maps to help visualize topography.
The (oceanic) water column is a concept used in oceanography to describe the physical and chemical characteristics of seawater at different depths for a defined geographical point. Generally, vertical profiles are made of temperature, salinity, chemical parameters at a defined point along the water column. The water column is the largest, yet one of the most under-explored, habitats on the planet; it is explored to better understand the ocean as a whole, including the huge biomass that lives there and its importance to the global carbon and other biogeochemical cycles. Studying the water column also provides understanding on the links between living organisms and environmental parameters, large-scale water circulation and the transfer of matter between water masses.

Underwater acoustics is the study of the propagation of sound in water and the interaction of the mechanical waves that constitute sound with the water, its contents and its boundaries. The water may be in the ocean, a lake, a river or a tank. Typical frequencies associated with underwater acoustics are between 10 Hz and 1 MHz. The propagation of sound in the ocean at frequencies lower than 10 Hz is usually not possible without penetrating deep into the seabed, whereas frequencies above 1 MHz are rarely used because they are absorbed very quickly.
Ocean dynamics define and describe the flow of water within the oceans. Ocean temperature and motion fields can be separated into three distinct layers: mixed (surface) layer, upper ocean, and deep ocean.
RAFOS floats are submersible devices used to map ocean currents well below the surface. They drift with these deep currents and listen for acoustic "pongs" emitted at designated times from multiple moored sound sources. By analyzing the time required for each pong to reach a float, researchers can pinpoint its position by trilateration. The floats are able to detect the pongs at ranges of hundreds of kilometers because they generally target a range of depths known as the SOFAR channel, which acts as a waveguide for sound. The name "RAFOS" derives from the earlier SOFAR floats, which emitted sounds that moored receivers picked up, allowing real-time underwater tracking. When the transmit and receive roles were reversed, so was the name: RAFOS is SOFAR spelled backward. Listening for sound requires far less energy than transmitting it, so RAFOS floats are cheaper and longer lasting than their predecessors, but they do not provide information in real-time: instead they store it on board, and upon completing their mission, drop a weight, rise to the surface, and transmit the data to shore by satellite.
A sound velocity probe is a device that is used for measuring the speed of sound, specifically in the water column, for oceanographic and hydrographic research purposes.

In oceanography, temperature-salinity diagrams, sometimes called T-S diagrams, are used to identify water masses. In a T-S diagram, rather than plotting each water property as a separate "profile," with pressure or depth as the vertical coordinate, potential temperature is plotted versus salinity. Temperature and salinity combine to determine the potential density of seawater; contours of constant potential density are often shown in T-S diagrams. Each contour is known as an isopycnal, or a region of constant density. These isopycnals appear curved because of the nonlinearity of the equation of state of seawater. The thermal expansion coefficient, αT, and the haline contraction coefficient, βS, vary with temperature and salinity because both properties affect the potential density of seawater.

A float is an oceanographic instrument platform used for making subsurface measurements in the ocean without the need for a ship, propeller, or a person operating it. Floats measure the physical and chemical aspects of the ocean in detail, such as measuring the direction and speed of water or the temperature and salinity. A float will descend to a predetermined depth where it will be neutrally buoyant. Once a certain amount of time has passed, most floats will rise back to the surface by increasing its buoyancy so it can transmit the data it collected to a satellite. A float can collect data while it is neutrally buoyant or moving through the water column. Often, floats are treated as disposable, as the expense of recovering them from remote areas of the ocean is prohibitive; when the batteries fail, a float ceases to function, and drifts at depth until it runs aground or floods and sinks. In other cases, floats are deployed for a short time and recovered.

The Global Drifter Program (GDP) was conceived by Prof. Peter Niiler, with the objective of collecting measurements of surface ocean currents, sea surface temperature and sea-level atmospheric pressure using drifters. It is the principal component of the Global Surface Drifting Buoy Array, a branch of NOAA's Global Ocean Observations and a scientific project of the Data Buoy Cooperation Panel (DBCP). The project originated in February 1979 as part of the TOGA/Equatorial Pacific Ocean Circulation Experiment (EPOCS) and the first large-scale deployment of drifters was in 1988 with the goal of mapping the tropical Pacific Ocean's surface circulation. The current goal of the project is to use 1250 satellite-tracked surface drifting buoys to make accurate and globally dense in-situ observations of mixed layer currents, sea surface temperature, atmospheric pressure, winds and salinity, and to create a system to process the data. Horizontal transports in the oceanic mixed layer measured by the GDP are relevant to biological and chemical processes as well as physical ones.
TEOS-10 is the international standard for the use and calculation of the thermodynamic properties of seawater, humid air and ice. It supersedes the former standard EOS-80. TEOS-10 is used by oceanographers and climate scientists to calculate and model properties of the oceans such as heat content in an internationally comparable way.

Seismic oceanography is a form of acoustic oceanography, in which sound waves are used to study the physical properties and dynamics of the ocean. It provides images of changes in the temperature and salinity of seawater. Unlike most oceanographic acoustic imaging methods, which use sound waves with frequencies greater than 10,000 Hz, seismic oceanography uses sound waves with frequencies lower than 500 Hz. Use of low-frequency sound means that seismic oceanography is unique in its ability to provide highly detailed images of oceanographic structure that span horizontal distances of hundreds of kilometres and which extend from the sea surface to the seabed. Since its inception in 2003, seismic oceanography has been used to image a wide variety of oceanographic phenomena, including fronts, eddies, thermohaline staircases, turbid layers and cold methane seeps. In addition to providing spectacular images, seismic oceanographic data have given quantitative insight into processes such as movement of internal waves and turbulent mixing of seawater.
