Python is a high-level, general-purpose programming language. Its design philosophy emphasizes code readability with the use of significant indentation.

SciPy is a free and open-source Python library used for scientific computing and technical computing.

NumPy is a library for the Python programming language, adding support for large, multi-dimensional arrays and matrices, along with a large collection of high-level mathematical functions to operate on these arrays. The predecessor of NumPy, Numeric, was originally created by Jim Hugunin with contributions from several other developers. In 2005, Travis Oliphant created NumPy by incorporating features of the competing Numarray into Numeric, with extensive modifications. NumPy is open-source software and has many contributors. NumPy is a NumFOCUS fiscally sponsored project.

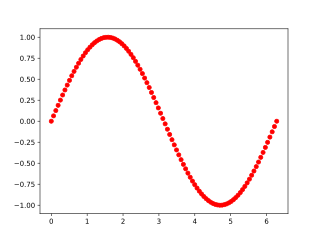
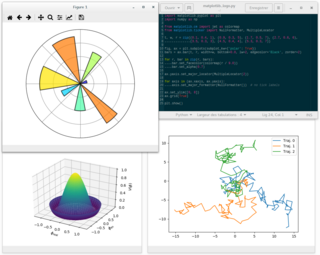
Matplotlib is a plotting library for the Python programming language and its numerical mathematics extension NumPy. It provides an object-oriented API for embedding plots into applications using general-purpose GUI toolkits like Tkinter, wxPython, Qt, or GTK. There is also a procedural "pylab" interface based on a state machine, designed to closely resemble that of MATLAB, though its use is discouraged. SciPy makes use of Matplotlib.
In statistics, the Breusch–Pagan test, developed in 1979 by Trevor Breusch and Adrian Pagan, is used to test for heteroskedasticity in a linear regression model. It was independently suggested with some extension by R. Dennis Cook and Sanford Weisberg in 1983. Derived from the Lagrange multiplier test principle, it tests whether the variance of the errors from a regression is dependent on the values of the independent variables. In that case, heteroskedasticity is present.
In statistics, an augmented Dickey–Fuller test (ADF) tests the null hypothesis that a unit root is present in a time series sample. The alternative hypothesis is different depending on which version of the test is used, but is usually stationarity or trend-stationarity. It is an augmented version of the Dickey–Fuller test for a larger and more complicated set of time series models.
The Ljung–Box test is a type of statistical test of whether any of a group of autocorrelations of a time series are different from zero. Instead of testing randomness at each distinct lag, it tests the "overall" randomness based on a number of lags, and is therefore a portmanteau test.
In statistics, and especially in biostatistics, cophenetic correlation is a measure of how faithfully a dendrogram preserves the pairwise distances between the original unmodeled data points. Although it has been most widely applied in the field of biostatistics, it can also be used in other fields of inquiry where raw data tend to occur in clumps, or clusters. This coefficient has also been proposed for use as a test for nested clusters.

SymPy is an open-source Python library for symbolic computation. It provides computer algebra capabilities either as a standalone application, as a library to other applications, or live on the web as SymPy Live or SymPy Gamma. SymPy is simple to install and to inspect because it is written entirely in Python with few dependencies. This ease of access combined with a simple and extensible code base in a well known language make SymPy a computer algebra system with a relatively low barrier to entry.
In statistics, a generalized linear mixed model (GLMM) is an extension to the generalized linear model (GLM) in which the linear predictor contains random effects in addition to the usual fixed effects. They also inherit from GLMs the idea of extending linear mixed models to non-normal data.
In statistics, the Breusch–Godfrey test is used to assess the validity of some of the modelling assumptions inherent in applying regression-like models to observed data series. In particular, it tests for the presence of serial correlation that has not been included in a proposed model structure and which, if present, would mean that incorrect conclusions would be drawn from other tests or that sub-optimal estimates of model parameters would be obtained.

SOFA Statistics is an open-source statistical package. The name stands for Statistics Open For All. It has a graphical user interface and can connect directly to MySQL, PostgreSQL, SQLite, MS Access (map), and Microsoft SQL Server. Data can also be imported from CSV and Tab-Separated files or spreadsheets. The main statistical tests available are Independent and Paired t-tests, Wilcoxon signed ranks, Mann–Whitney U, Pearson's chi squared, Kruskal Wallis H, one-way ANOVA, Spearman's R, and Pearson's R. Nested tables can be produced with row and column percentages, totals, standard deviation, mean, median, lower and upper quartiles, and sum.

NetworkX is a Python library for studying graphs and networks. NetworkX is free software released under the BSD-new license.
In statistics, the Jarque–Bera test is a goodness-of-fit test of whether sample data have the skewness and kurtosis matching a normal distribution. The test is named after Carlos Jarque and Anil K. Bera. The test statistic is always nonnegative. If it is far from zero, it signals the data do not have a normal distribution.

Pandas is a software library written for the Python programming language for data manipulation and analysis. In particular, it offers data structures and operations for manipulating numerical tables and time series. It is free software released under the three-clause BSD license. The name is derived from the term "panel data", an econometrics term for data sets that include observations over multiple time periods for the same individuals, as well as a play on the phrase "Python data analysis". Wes McKinney started building what would become Pandas at AQR Capital while he was a researcher there from 2007 to 2010.


