Related Research Articles

A Cartesian coordinate system in a plane is a coordinate system that specifies each point uniquely by a pair of numerical coordinates, which are the signed distances to the point from two fixed perpendicular oriented lines called coordinate line is called a coordinate axis or just axis of the system, and the point where they meet is the origin and has (0, 0) as coordinates.

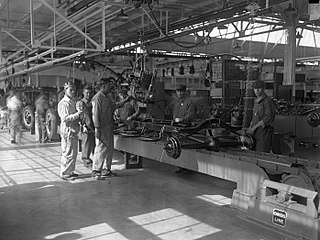
Lean manufacturing is a production method aimed primarily at reducing times within the production system as well as response times from suppliers and to customers. It is closely related to another concept called just-in-time manufacturing. Just-in-time manufacturing tries to match production to demand by only supplying goods which have been ordered and focuses on efficiency, productivity and reduction of "wastes" for the producer and supplier of goods. Lean manufacturing adopts the just-in-time approach and additionally focuses on reducing cycle, flow and throughput times by further eliminating activities which do not add any value for the customer. Lean manufacturing also involves people who work outside of the manufacturing process, such as in marketing and customer service.

A scatter plot is a type of plot or mathematical diagram using Cartesian coordinates to display values for typically two variables for a set of data. If the points are coded (color/shape/size), one additional variable can be displayed. The data are displayed as a collection of points, each having the value of one variable determining the position on the horizontal axis and the value of the other variable determining the position on the vertical axis.
In linear algebra, linear transformations can be represented by matrices. If is a linear transformation mapping to and is a column vector with entries, then

The Zachman Framework is an enterprise ontology and is a fundamental structure for enterprise architecture which provides a formal and structured way of viewing and defining an enterprise. The ontology is a two dimensional classification schema that reflects the intersection between two historical classifications. The first are primitive interrogatives: What, How, When, Who, Where, and Why. The second is derived from the philosophical concept of reification, the transformation of an abstract idea into an instantiation. The Zachman Framework reification transformations are: identification, definition, representation, specification, configuration and instantiation.
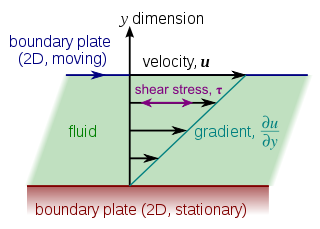
In plane geometry, a shear mapping is a linear map that displaces each point in a fixed direction, by an amount proportional to its signed distance from the line that is parallel to that direction and goes through the origin. This type of mapping is also called shear transformation, transvection, or just shearing.
Lean software development is a translation of lean manufacturing principles and practices to the software development domain. Adapted from the Toyota Production System, it is emerging with the support of a pro-lean subculture within the agile community. Lean offers a solid conceptual framework, values and principles, as well as good practices, derived from experience, that support agile organizations.
Operations management is an area of management concerned with designing and controlling the process of production and redesigning business operations in the production of goods or services. It involves the responsibility of ensuring that business operations are efficient in terms of using as few resources as needed and effective in meeting customer requirements.
Single-minute digit exchange of die (SMED) is one of the many lean production methods for reducing inefficiencies in a manufacturing process. It provides a rapid and efficient way of converting a manufacturing process from running the current product to running the next product. This rapid changeover is key to reducing production lot sizes, and thereby reducing uneven flow (Mura), production loss and output variability.

Value-stream mapping, also known as material- and information-flow mapping, is a lean-management method for analyzing the current state and designing a future state for the series of events that take a product or service from the beginning of the specific process until it reaches the customer. A value stream map is a visual tool that displays all critical steps in a specific process and easily quantifies the time and volume taken at each stage. Value stream maps show the flow of both materials and information as they progress through the process.
In differential geometry, an equiareal map, sometimes called an authalic map, is a smooth map from one surface to another that preserves the areas of figures.
The logic alphabet, also called the X-stem Logic Alphabet (XLA), constitutes an iconic set of symbols that systematically represents the sixteen possible binary truth functions of logic. The logic alphabet was developed by Shea Zellweger. The major emphasis of his iconic "logic alphabet" is to provide a more cognitively ergonomic notation for logic. Zellweger's visually iconic system more readily reveals, to the novice and expert alike, the underlying symmetry relationships and geometric properties of the sixteen binary connectives within Boolean algebra.
The Forrester effect map is a business technique used to analyse the disturbance on the supply chain of reorder activity.
Value-stream-mapping software is a type of software that helps prepare and/or analyze value stream maps. The software typically helps design maps through utilizing a series of symbols representing activity and information/material flow, and as a supplement to manual calculations
A lean laboratory is one which is focused on processes, procedures, and infrastructure that deliver results in the most efficient way in terms of cost, speed, or both. Lean laboratory is a management and organization process derived from the concept of lean manufacturing and the Toyota Production System (TPS). The goal of a lean laboratory is to reduce resource usage and costs while improving productivity, staff morale, and laboratory-driven outcomes.
Lean Six Sigma is a method that uses a collaborative team effort to improve performance by systematically removing waste and reducing variation. It combines lean manufacturing/lean enterprise and Six Sigma to eliminate the eight kinds of waste (muda).
Lean IT is the extension of lean manufacturing and lean services principles to the development and management of information technology (IT) products and services. Its central concern, applied in the context of IT, is the elimination of waste, where waste is work that adds no value to a product or service.
A time/memory/data tradeoff attack is a type of cryptographic attack where an attacker tries to achieve a situation similar to the space–time tradeoff but with the additional parameter of data, representing the amount of data available to the attacker. An attacker balances or reduces one or two of those parameters in favor of the other one or two. This type of attack is very difficult, so most of the ciphers and encryption schemes in use were not designed to resist it.
The product of exponentials (POE) method is a robotics convention for mapping the links of a spatial kinematic chain. It is an alternative to Denavit–Hartenberg parameterization. While the latter method uses the minimal number of parameters to represent joint motions, the former method has a number of advantages: uniform treatment of prismatic and revolute joints, definition of only two reference frames, and an easy geometric interpretation from the use of screw axes for each joint.
Daniel T. Jones is an English author and researcher. He won the Shingo Prize for Operational Excellence in the Research and Professional Publication category multiple times for his books The Machine that Changed the World, Lean Thinking: Banish Waste and Create Wealth in Your Organization and Seeing the Whole: Mapping the Extended Value Stream.
References
- ↑ The Lean Enterprise: Designing and Managing Strategic Processes for Customer-winning Performance By Dan Dimancescu, Nick Rich, Peter Hines ISBN 0-585-02486-3