The propagation constant of a sinusoidal electromagnetic wave is a measure of the change undergone by the amplitude and phase of the wave as it propagates in a given direction. The quantity being measured can be the voltage, the current in a circuit, or a field vector such as electric field strength or flux density. The propagation constant itself measures the change per unit length, but it is otherwise dimensionless. In the context of two-port networks and their cascades, propagation constant measures the change undergone by the source quantity as it propagates from one port to the next.
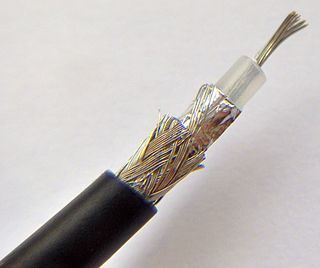
In electrical engineering, a transmission line is a specialized cable or other structure designed to conduct electromagnetic waves in a contained manner. The term applies when the conductors are long enough that the wave nature of the transmission must be taken into account. This applies especially to radio-frequency engineering because the short wavelengths mean that wave phenomena arise over very short distances. However, the theory of transmission lines was historically developed to explain phenomena on very long telegraph lines, especially submarine telegraph cables.

In probability theory and statistics, the Rayleigh distribution is a continuous probability distribution for nonnegative-valued random variables. Up to rescaling, it coincides with the chi distribution with two degrees of freedom.
A resistor–capacitor circuit, or RC filter or RC network, is an electric circuit composed of resistors and capacitors. It may be driven by a voltage or current source and these will produce different responses. A first order RC circuit is composed of one resistor and one capacitor and is the simplest type of RC circuit.
Chebyshev filters are analog or digital filters having a steeper roll-off than Butterworth filters, and have passband ripple or stopband ripple. Chebyshev filters have the property that they minimize the error between the idealized and the actual filter characteristic over the range of the filter, but with ripples in the passband. This type of filter is named after Pafnuty Chebyshev because its mathematical characteristics are derived from Chebyshev polynomials. Type I Chebyshev filters are usually referred to as "Chebyshev filters", while type II filters are usually called "inverse Chebyshev filters".

The Smith chart, invented by Phillip H. Smith (1905–1987) and independently by Mizuhashi Tosaku, is a graphical calculator or nomogram designed for electrical and electronics engineers specializing in radio frequency (RF) engineering to assist in solving problems with transmission lines and matching circuits. The Smith chart can be used to simultaneously display multiple parameters including impedances, admittances, reflection coefficients, scattering parameters, noise figure circles, constant gain contours and regions for unconditional stability, including mechanical vibrations analysis. The Smith chart is most frequently used at or within the unity radius region. However, the remainder is still mathematically relevant, being used, for example, in oscillator design and stability analysis. While the use of paper Smith charts for solving the complex mathematics involved in matching problems has been largely replaced by software based methods, the Smith chart is still a very useful method of showing how RF parameters behave at one or more frequencies, an alternative to using tabular information. Thus most RF circuit analysis software includes a Smith chart option for the display of results and all but the simplest impedance measuring instruments can plot measured results on a Smith chart display.
The Heaviside condition, named for Oliver Heaviside (1850–1925), is the condition an electrical transmission line must meet in order for there to be no distortion of a transmitted signal. Also known as the distortionless condition, it can be used to improve the performance of a transmission line by adding loading to the cable.
Ripple in electronics is the residual periodic variation of the DC voltage within a power supply which has been derived from an alternating current (AC) source. This ripple is due to incomplete suppression of the alternating waveform after rectification. Ripple voltage originates as the output of a rectifier or from generation and commutation of DC power.

An attenuator is an electronic device that reduces the power of a signal without appreciably distorting its waveform.
The telegrapher's equations are a pair of coupled, linear partial differential equations that describe the voltage and current on an electrical transmission line with distance and time. The equations come from Oliver Heaviside who developed the transmission line model starting with an August 1876 paper, On the Extra Current. The model demonstrates that the electromagnetic waves can be reflected on the wire, and that wave patterns can form along the line.

An L pad is a network composed of two impedances that typically resemble the letter capital "L" when drawn on a schematic. It is commonly used for attenuation and for impedance matching.

The Π pad is a specific type of attenuator circuit in electronics whereby the topology of the circuit is formed in the shape of the Greek capital letter pi (Π).
Image impedance is a concept used in electronic network design and analysis and most especially in filter design. The term image impedance applies to the impedance seen looking into a port of a network. Usually a two-port network is implied but the concept can be extended to networks with more than two ports. The definition of image impedance for a two-port network is the impedance, Zi 1, seen looking into port 1 when port 2 is terminated with the image impedance, Zi 2, for port 2. In general, the image impedances of ports 1 and 2 will not be equal unless the network is symmetrical with respect to the ports.
Constant k filters, also k-type filters, are a type of electronic filter designed using the image method. They are the original and simplest filters produced by this methodology and consist of a ladder network of identical sections of passive components. Historically, they are the first filters that could approach the ideal filter frequency response to within any prescribed limit with the addition of a sufficient number of sections. However, they are rarely considered for a modern design, the principles behind them having been superseded by other methodologies which are more accurate in their prediction of filter response.
m-derived filters or m-type filters are a type of electronic filter designed using the image method. They were invented by Otto Zobel in the early 1920s. This filter type was originally intended for use with telephone multiplexing and was an improvement on the existing constant k type filter. The main problem being addressed was the need to achieve a better match of the filter into the terminating impedances. In general, all filters designed by the image method fail to give an exact match, but the m-type filter is a big improvement with suitable choice of the parameter m. The m-type filter section has a further advantage in that there is a rapid transition from the cut-off frequency of the passband to a pole of attenuation just inside the stopband. Despite these advantages, there is a drawback with m-type filters; at frequencies past the pole of attenuation, the response starts to rise again, and m-types have poor stopband rejection. For this reason, filters designed using m-type sections are often designed as composite filters with a mixture of k-type and m-type sections and different values of m at different points to get the optimum performance from both types.
Filters designed using the image impedance methodology suffer from a peculiar flaw in the theory. The predicted characteristics of the filter are calculated assuming that the filter is terminated with its own image impedances at each end. This will not usually be the case; the filter will be terminated with fixed resistances. This causes the filter response to deviate from the theoretical. This article explains how the effects of image filter end terminations can be taken into account.

A signal travelling along an electrical transmission line will be partly, or wholly, reflected back in the opposite direction when the travelling signal encounters a discontinuity in the characteristic impedance of the line, or if the far end of the line is not terminated in its characteristic impedance. This can happen, for instance, if two lengths of dissimilar transmission lines are joined together.
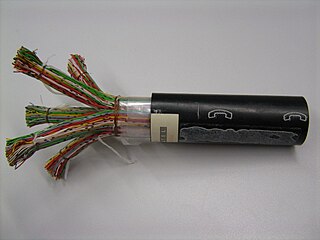
The primary line constants are parameters that describe the characteristics of conductive transmission lines, such as pairs of copper wires, in terms of the physical electrical properties of the line. The primary line constants are only relevant to transmission lines and are to be contrasted with the secondary line constants, which can be derived from them, and are more generally applicable. The secondary line constants can be used, for instance, to compare the characteristics of a waveguide to a copper line, whereas the primary constants have no meaning for a waveguide.

An RLC circuit is an electrical circuit consisting of a resistor (R), an inductor (L), and a capacitor (C), connected in series or in parallel. The name of the circuit is derived from the letters that are used to denote the constituent components of this circuit, where the sequence of the components may vary from RLC.
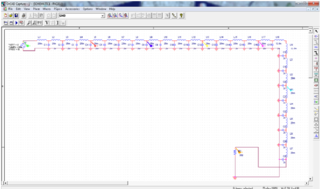
Performance modelling is the abstraction of a real system into a simplified representation to enable the prediction of performance. The creation of a model can provide insight into how a proposed or actual system will or does work. This can, however, point towards different things to people belonging to different fields of work.


