Related Research Articles

This is a demography of the population of Cambodia including population density, ethnicity, education level, health of the populace, economic status, religious affiliations and other aspects of the population.

Life expectancy is a statistical measure of the average time an organism is expected to live, based on the year of its birth, current age, and other demographic factors like sex. The most commonly used measure is life expectancy at birth (LEB), which can be defined in two ways. Cohort LEB is the mean length of life of a birth cohort and can be computed only for cohorts born so long ago that all their members have died. Period LEB is the mean length of life of a hypothetical cohort assumed to be exposed, from birth through death, to the mortality rates observed at a given year.
This article is about the demographics of Saint Helena, Ascension and Tristan da Cunha, a British overseas territory in the south Atlantic Ocean.
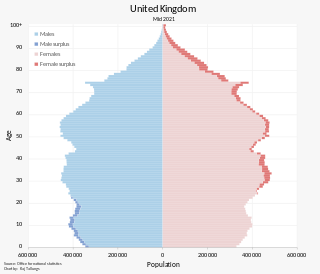
The population of the United Kingdom was estimated at over 67.0 million in 2020. It is the 21st most populated country in the world and has a population density of 270 people per square kilometre, with England having significantly greater density than Wales, Scotland, and Northern Ireland. Almost a third of the population lives in South East England, which is predominantly urban and suburban, with about 9 million in the capital city, London, whose population density is just over 5,200 per square kilometre.
Demography is the statistical study of populations, especially human beings.
The Physical Quality of Life Index (PQLI) is an attempt to measure the quality of life or well-being of a country. The value is the average of three statistics: basic literacy rate, infant mortality, and life expectancy at age one, all equally weighted on a 1 to 100 scale.

According to data from the 1989 Soviet census, the population of the USSR was 70% East Slavs, 17% Turkic peoples, and all other ethnic groups below 2%. Alongside the atheist majority of 60% there were sizable minorities of Russian Orthodox Christians and Muslims.

Ulpian was a Roman jurist born in Tyre. He was considered one of the great legal authorities of his time and was one of the five jurists upon whom decisions were to be based according to the Law of Citations of Valentinian III.
The pater familias, also written as paterfamilias, was the head of a Roman family. The pater familias was the oldest living male in a household, and could legally exercise autocratic authority over his extended family. The term is Latin for "father of the family" or the "owner of the family estate". The form is archaic in Latin, preserving the old genitive ending in -ās, whereas in classical Latin the normal first declension genitive singular ending was -ae. The pater familias always had to be a Roman citizen.

In actuarial science and demography, a life table is a table which shows, for each age, what the probability is that a person of that age will die before their next birthday. In other words, it represents the survivorship of people from a certain population. They can also be explained as a long-term mathematical way to measure a population's longevity. Tables have been created by demographers including Graunt, Reed and Merrell, Keyfitz, and Greville.

Marriage in ancient Rome was a strictly monogamous institution: a Roman citizen by law could have only one spouse at a time. The practice of monogamy distinguished the Greeks and Romans from other ancient civilizations, in which elite males typically had multiple wives. Greco-Roman monogamy may have arisen from the egalitarianism of the democratic and republican political systems of the city-states. It is one aspect of ancient Roman culture that was embraced by early Christianity, which in turn perpetuated it as an ideal in later Western culture.
In the United States, an annuity is a financial product which offers tax-deferred growth and which usually offers benefits such as an income for life. Typically these are offered as structured (insurance) products that each state approves and regulates in which case they are designed using a mortality table and mainly guaranteed by a life insurer. There are many different varieties of annuities sold by carriers. In a typical scenario, an investor will make a single cash premium to own an annuity. After the policy is issued the owner may elect to annuitize the contract for a chosen period of time. This process is called annuitization and can also provide a predictable, guaranteed stream of future income during retirement until the death of the annuitant. Alternatively, an investor can defer annuitizing their contract to get larger payments later, hedge long-term care cost increases, or maximize a lump sum death benefit for a named beneficiary.
Under European Union law, an annuity is a financial contract which provides an income stream in return for an initial payment with specific parameters. It is the opposite of a settlement funding. A Swiss annuity is not considered a European annuity for tax reasons.
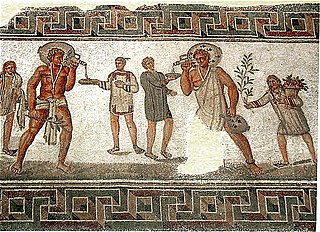
Slavery in ancient Rome played an important role in society and the economy. Besides manual labour, slaves performed many domestic services and might be employed at highly skilled jobs and professions. Accountants and physicians were often slaves. Slaves of Greek origin in particular might be highly educated. Unskilled slaves, or those sentenced to slavery as punishment, worked on farms, in mines, and at mills.
Substantially equal periodic payments (SEPP) are one of the exceptions in the United States Internal Revenue Code that allows a retiree to receive payments before age 591⁄2 from a retirement plan or deferred annuity without the 10% early distribution penalty under certain circumstances.
A life annuity is an annuity, or series of payments at fixed intervals, paid while the purchaser is alive. The majority of life annuities are insurance products sold or issued by life insurance companies however substantial case law indicates that annuity products are not necessarily insurance products.

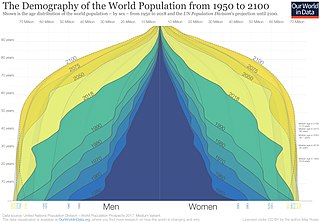
The ageing of Europe, also known as the greying of Europe, is a demographic phenomenon in Europe characterised by a decrease in fertility, a decrease in mortality rate, and a higher life expectancy among European populations. Low birth rates and higher life expectancy contribute to the transformation of Europe's population pyramid shape. The most significant change is the transition towards a much older population structure, resulting in a decrease in the proportion of the working age while the number of the retired population increases. The total number of the older population is projected to increase greatly within the coming decades, with rising proportions of the post-war baby-boom generations reaching retirement. This will cause a high burden on the working age population as they provide for the increasing number of the older population.
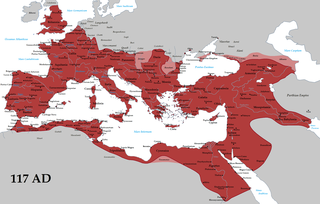
Demographically, as in other more recent and thus better documented pre-modern societies, papyrus evidence from Roman Egypt suggests the demographic profile of the Roman Empire had high infant mortality, a low marriage age, and high fertility within marriage. Perhaps half of the Roman subjects died by the age of 5. Of those still alive at age 10, half would die by the age of 50.
References
- ↑ Digest 35.2.68; Frier, "Roman life expectancy", 214.
- ↑ Duncan-Jones, Structure and Scale, 100–101.
- ↑ Frier, "Roman life expectancy", 214.
- ↑ Frier, "Roman life expectancy", 215.
- ↑ Frier, "Roman life expectancy", 217–19.
- ↑ Frier, "Roman life expectancy", 217.
- ↑ Frier, "Demography", 790.
- ↑ Frier, "Roman life expectancy", 219–20; Duncan-Jones, Structure and Scale, 98.
- ↑ Frier, "Roman life expectancy", 219–20.
- ↑ Frier, "Roman life expectancy", 220–22.
- ↑ Frier, "Roman life expectancy", 222–23.
- ↑ Frier, "Roman life expectancy", 229–30, 230 n. 43.
- ↑ Frier, "Roman life expectancy", 229, 233, 249.
- ↑ Frier, "Roman life expectancy", 230–31, 247–49.
- ↑ Hopkins, "Probable age structure", 264 n. 32.
- ↑ Saller, "Men's age at marriage", 31 n. 27.
- ↑ Duncan-Jones, Structure and Scale, 99–100.
- ↑ Duncan-Jones, Structure and Scale, 100–101.
- ↑ Duncan-Jones, Structure and Scale, 101 n. 16.
- ↑ Duncan-Jones, Structure and Scale, 101.
- ↑ Latin text from Frier, "Roman life expectancy", 215.
Ancient sources
- Digest.
- Scott, S.P., trans. The Digest or Pandects in The Civil Law. 17 vols. Cincinnati: Central Trust Company, 1932. Online at the Constitution Society. Accessed 31 August 2009.
Modern sources
- Duncan-Jones, Richard. Structure and Scale in the Roman Economy, (Cambridge: Cambridge University Press, 1990).
- Frier, Bruce W. "Roman Life Expectancy: Ulpian's Evidence", Harvard Studies in Classical Philology 86 (1982), 213–51.
- Frier, Bruce W. "Demography", in Alan K. Bowman, Peter Garnsey, and Dominic Rathbone, eds., The Cambridge Ancient History XI: The High Empire, A.D. 70–192, (Cambridge: Cambridge University Press, 2000), 827–54.
- Hopkins, Keith. "On the Probable Age Structure of the Roman Population", Population Studies 20:2 (1966), 245–64.
- Saller, Richard P. "Men's Age at Marriage and its Consequences in the Roman Family", Classical Philology 82:1 (1987), 21–34.