Related Research Articles

In statistics, a power law is a functional relationship between two quantities, where a relative change in one quantity results in a relative change in the other quantity proportional to a power of the change, independent of the initial size of those quantities: one quantity varies as a power of another. For instance, considering the area of a square in terms of the length of its side, if the length is doubled, the area is multiplied by a factor of four. The rate of change exhibited in these relationships is said to be multiplicative.

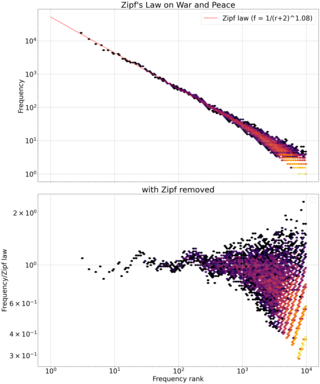
Zipf's law is an empirical law that often holds, approximately, when a list of measured values is sorted in decreasing order. It states that the value of the nth entry is inversely proportional to n.

The Pareto distribution, named after the Italian civil engineer, economist, and sociologist Vilfredo Pareto, is a power-law probability distribution that is used in description of social, quality control, scientific, geophysical, actuarial, and many other types of observable phenomena; the principle originally applied to describing the distribution of wealth in a society, fitting the trend that a large portion of wealth is held by a small fraction of the population. The Pareto principle or "80-20 rule" stating that 80% of outcomes are due to 20% of causes was named in honour of Pareto, but the concepts are distinct, and only Pareto distributions with shape value of log45 ≈ 1.16 precisely reflect it. Empirical observation has shown that this 80-20 distribution fits a wide range of cases, including natural phenomena and human activities.

In statistical physics and mathematics, percolation theory describes the behavior of a network when nodes or links are added. This is a geometric type of phase transition, since at a critical fraction of addition the network of small, disconnected clusters merge into significantly larger connected, so-called spanning clusters. The applications of percolation theory to materials science and in many other disciplines are discussed here and in the articles Network theory and Percolation.
In probability theory and statistics, the Zipf–Mandelbrot law is a discrete probability distribution. Also known as the Pareto–Zipf law, it is a power-law distribution on ranked data, named after the linguist George Kingsley Zipf who suggested a simpler distribution called Zipf's law, and the mathematician Benoit Mandelbrot, who subsequently generalized it.

In linguistics, Heaps' law is an empirical law which describes the number of distinct words in a document as a function of the document length. It can be formulated as

George Kingsley Zipf, was an American linguist and philologist who studied statistical occurrences in different languages.
In probability and statistics, the parabolic fractal distribution is a type of discrete probability distribution in which the logarithm of the frequency or size of entities in a population is a quadratic polynomial of the logarithm of the rank. This can markedly improve the fit over a simple power-law relationship.

Central place theory is an urban geographical theory that seeks to explain the number, size and range of market services in a commercial system or human settlements in a residential system. It was introduced in 1933 to explain the spatial distribution of cities across the landscape. The theory was first analyzed by German geographer Walter Christaller, who asserted that settlements simply functioned as 'central places' providing economic services to surrounding areas. Christaller explained that a large number of small settlements will be situated relatively close to one another for efficiency, and because people don't want to travel far for everyday needs, like getting bread from a bakery. But people would travel further for more expensive and infrequent purchases or specialized goods and services which would be located in larger settlements that are farther apart.

In statistics and business, a long tail of some distributions of numbers is the portion of the distribution having many occurrences far from the "head" or central part of the distribution. The distribution could involve popularities, random numbers of occurrences of events with various probabilities, etc. The term is often used loosely, with no definition or an arbitrary definition, but precise definitions are possible.
Gibrat's law, sometimes called Gibrat's rule of proportionate growth or the law of proportionate effect, is a rule defined by Robert Gibrat (1904–1980) in 1931 stating that the proportional rate of growth of a firm is independent of its absolute size. The law of proportionate growth gives rise to a firm size distribution that is log-normal.

A primate city is a city that is the largest in its country, province, state, or region, and disproportionately larger than any others in the urban hierarchy. A primate city distribution is a rank-size distribution that has one very large city with many much smaller cities and towns and no intermediate-sized urban centers, creating a statistical king effect.
In applied probability theory, the Simon model is a class of stochastic models that results in a power-law distribution function. It was proposed by Herbert A. Simon to account for the wide range of empirical distributions following a power-law. It models the dynamics of a system of elements with associated counters. In this model the dynamics of the system is based on constant growth via addition of new elements as well as incrementing the counters at a rate proportional to their current values.

Rank–size distribution is the distribution of size by rank, in decreasing order of size. For example, if a data set consists of items of sizes 5, 100, 5, and 8, the rank-size distribution is 100, 8, 5, 5. This is also known as the rank–frequency distribution, when the source data are from a frequency distribution. These are particularly of interest when the data vary significantly in scales, such as city size or word frequency. These distributions frequently follow a power law distribution, or less well-known ones such as a stretched exponential function or parabolic fractal distribution, at least approximately for certain ranges of ranks; see below.
Mark Newman is an English–American physicist and Anatol Rapoport Distinguished University Professor of Physics at the University of Michigan, as well as an external faculty member of the Santa Fe Institute. He is known for his fundamental contributions to the fields of complex networks and complex systems, for which he was awarded the 2014 Lagrange Prize.
An empirical statistical law or a law of statistics represents a type of behaviour that has been found across a number of datasets and, indeed, across a range of types of data sets. Many of these observances have been formulated and proved as statistical or probabilistic theorems and the term "law" has been carried over to these theorems. There are other statistical and probabilistic theorems that also have "law" as a part of their names that have not obviously derived from empirical observations. However, both types of "law" may be considered instances of a scientific law in the field of statistics. What distinguishes an empirical statistical law from a formal statistical theorem is the way these patterns simply appear in natural distributions, without a prior theoretical reasoning about the data.
Quantitative linguistics (QL) is a sub-discipline of general linguistics and, more specifically, of mathematical linguistics. Quantitative linguistics deals with language learning, language change, and application as well as structure of natural languages. QL investigates languages using statistical methods; its most demanding objective is the formulation of language laws and, ultimately, of a general theory of language in the sense of a set of interrelated languages laws. Synergetic linguistics was from its very beginning specifically designed for this purpose. QL is empirically based on the results of language statistics, a field which can be interpreted as statistics of languages or as statistics of any linguistic object. This field is not necessarily connected to substantial theoretical ambitions. Corpus linguistics and computational linguistics are other fields which contribute important empirical evidence.

In statistics, economics, and econophysics, the king effect is the phenomenon in which the top one or two members of a ranked set show up as clear outliers. These top one or two members are unexpectedly large because they do not conform to the statistical distribution or rank-distribution which the remainder of the set obeys.
In physics and electrical engineering, the universal dielectric response, or UDR, refers to the observed emergent behaviour of the dielectric properties exhibited by diverse solid state systems. In particular this widely observed response involves power law scaling of dielectric properties with frequency under conditions of alternating current, AC. First defined in a landmark article by A. K. Jonscher in Nature published in 1977, the origins of the UDR were attributed to the dominance of many-body interactions in systems, and their analogous RC network equivalence.

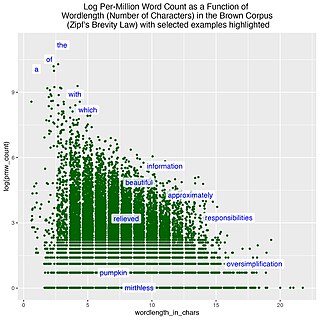
In linguistics, the brevity law is a linguistic law that qualitatively states that the more frequently a word is used, the shorter that word tends to be, and vice versa; the less frequently a word is used, the longer it tends to be. This is a statistical regularity that can be found in natural languages and other natural systems and that claims to be a general rule.
References
- 1 2 Krugman, Paul (December 1996). "Confronting the Mystery of Urban Hierarchy". Journal of the Japanese and International Economies. 10 (4): 399–418. doi: 10.1006/jjie.1996.0023 .
- ↑ Zipf, George, Kingsley (1949). Human Behaviour and the Principle of Least Effort. Reading MA: Addison-Wesley. p. 5.
{{cite book}}: CS1 maint: multiple names: authors list (link) - ↑ Carroll, Glenn (1982). "National city-size distributions what do we know after 67 years of research?". Progress in Human Geography. 6 (1): 1–43. doi:10.1177/030913258200600101. S2CID 153703477.
- ↑ Angel, Shlomo (2012). Planet of cities. Cambridge, Mass.: Lincoln Institute of Land Policy. ISBN 978-1-55844-249-8.
- ↑ Henderson, J. V. (1974). "The sizes and types of cities". The American Economic Review. 64 (4): 640–656. JSTOR 1813316.
- ↑ Jefferson, Mark (1989). "Why geography? The law of the primate city". Geographical Review. 79 (2): 226–232. Bibcode:1989GeoRv..79..226J. doi:10.2307/215528. JSTOR 215528.