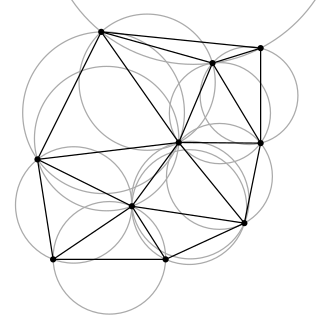
In mathematics and computational geometry, a Delaunay triangulation (DT), also known as a Delone triangulation, for a given set {pi} of discrete points pi in general position is a triangulation such that no point pi is inside the circumcircle of any triangle in the DT. Delaunay triangulations maximize the minimum of all the angles of the triangles in the triangulation; they tend to avoid sliver triangles. The triangulation is named after Boris Delaunay for his work on this topic from 1934.

In mathematics, a Voronoi diagram is a partition of a plane into regions close to each of a given set of objects. It can be classified also as a tessellation. In the simplest case, these objects are just finitely many points in the plane. For each seed there is a corresponding region, called a Voronoi cell, consisting of all points of the plane closer to that seed than to any other. The Voronoi diagram of a set of points is dual to that set's Delaunay triangulation.

A tessellation or tiling is the covering of a surface, often a plane, using one or more geometric shapes, called tiles, with no overlaps and no gaps. In mathematics, tessellation can be generalized to higher dimensions and a variety of geometries.
Given a topological space and a group acting on it, the images of a single point under the group action form an orbit of the action. A fundamental domain or fundamental region is a subset of the space which contains exactly one point from each of these orbits. It serves as a geometric realization for the abstract set of representatives of the orbits.
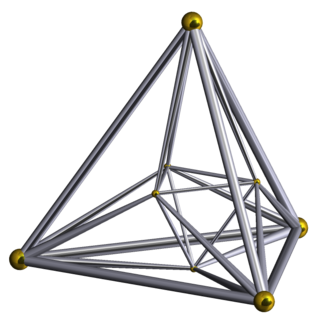
In geometry, the 16-cell is the regular convex 4-polytope (four-dimensional analogue of a Platonic solid) with Schläfli symbol {3,3,4}. It is one of the six regular convex 4-polytopes first described by the Swiss mathematician Ludwig Schläfli in the mid-19th century. It is also called C16, hexadecachoron, or hexdecahedroid [sic?].
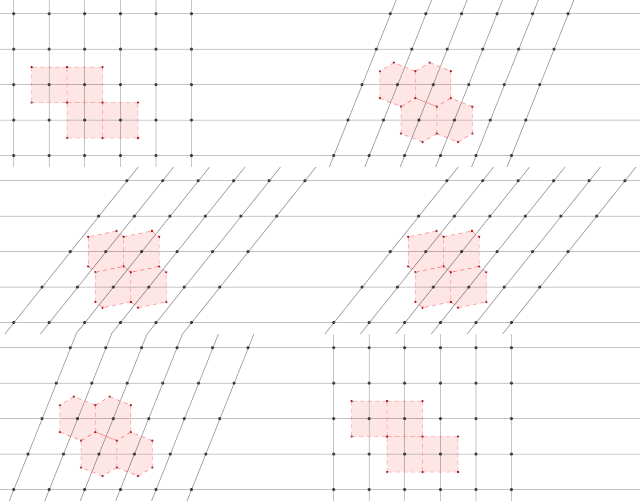
The Wigner–Seitz cell, named after Eugene Wigner and Frederick Seitz, is a primitive cell which has been constructed by applying Voronoi decomposition to a crystal lattice. It is used in the study of crystalline materials in crystallography.

A spatial network is a graph in which the vertices or edges are spatial elements associated with geometric objects, i.e., the nodes are located in a space equipped with a certain metric. The simplest mathematical realization of spatial network is a lattice or a random geometric graph, where nodes are distributed uniformly at random over a two-dimensional plane; a pair of nodes are connected if the Euclidean distance is smaller than a given neighborhood radius. Transportation and mobility networks, Internet, mobile phone networks, power grids, social and contact networks and biological neural networks are all examples where the underlying space is relevant and where the graph's topology alone does not contain all the information. Characterizing and understanding the structure, resilience and the evolution of spatial networks is crucial for many different fields ranging from urbanism to epidemiology.

In the mathematical discipline of graph theory, the dual graph of a planar graph G is a graph that has a vertex for each face of G. The dual graph has an edge for each pair of faces in G that are separated from each other by an edge, and a self-loop when the same face appears on both sides of an edge. Thus, each edge e of G has a corresponding dual edge, whose endpoints are the dual vertices corresponding to the faces on either side of e. The definition of the dual depends on the choice of embedding of the graph G, so it is a property of plane graphs rather than planar graphs. For planar graphs generally, there may be multiple dual graphs, depending on the choice of planar embedding of the graph.

In electrical engineering and computer science, Lloyd's algorithm, also known as Voronoi iteration or relaxation, is an algorithm named after Stuart P. Lloyd for finding evenly spaced sets of points in subsets of Euclidean spaces and partitions of these subsets into well-shaped and uniformly sized convex cells. Like the closely related k-means clustering algorithm, it repeatedly finds the centroid of each set in the partition and then re-partitions the input according to which of these centroids is closest. In this setting, the mean operation is an integral over a region of space, and the nearest centroid operation results in Voronoi diagrams.
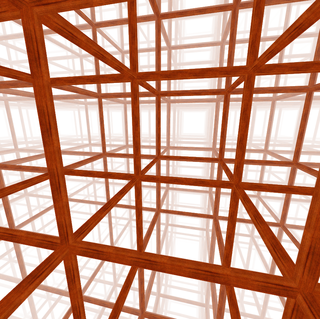
The cubic honeycomb or cubic cellulation is the only proper regular space-filling tessellation in Euclidean 3-space made up of cubic cells. It has 4 cubes around every edge, and 8 cubes around each vertex. Its vertex figure is a regular octahedron. It is a self-dual tessellation with Schläfli symbol {4,3,4}. John Horton Conway called this honeycomb a cubille.

The tetrahedral-octahedral honeycomb, alternated cubic honeycomb is a quasiregular space-filling tessellation in Euclidean 3-space. It is composed of alternating regular octahedra and tetrahedra in a ratio of 1:2.

In geometry, a honeycomb is a space filling or close packing of polyhedral or higher-dimensional cells, so that there are no gaps. It is an example of the more general mathematical tiling or tessellation in any number of dimensions. Its dimension can be clarified as n-honeycomb for a honeycomb of n-dimensional space.

Natural neighbor interpolation is a method of spatial interpolation, developed by Robin Sibson. The method is based on Voronoi tessellation of a discrete set of spatial points. This has advantages over simpler methods of interpolation, such as nearest-neighbor interpolation, in that it provides a smoother approximation to the underlying "true" function.
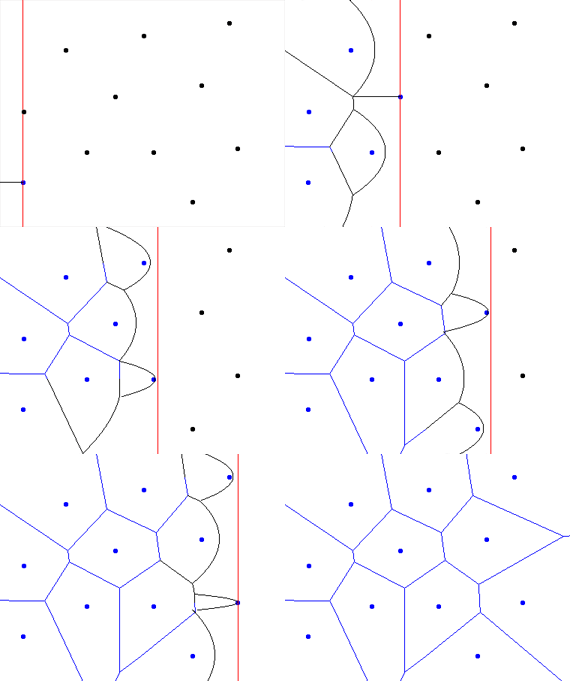
Fortune's algorithm is a sweep line algorithm for generating a Voronoi diagram from a set of points in a plane using O(n log n) time and O(n) space. It was originally published by Steven Fortune in 1986 in his paper "A sweepline algorithm for Voronoi diagrams."

In geometry, a centroidal Voronoi tessellation (CVT) is a special type of Voronoi tessellation in which the generating point of each Voronoi cell is also its centroid. It can be viewed as an optimal partition corresponding to an optimal distribution of generators. A number of algorithms can be used to generate centroidal Voronoi tessellations, including Lloyd's algorithm for K-means clustering or Quasi-Newton methods like BFGS.
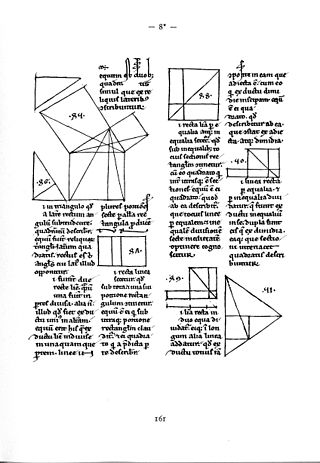
Mathematical diagrams, such as charts and graphs, are mainly designed to convey mathematical relationships—for example, comparisons over time.
A zone diagram is a certain geometric object which a variation on the notion of Voronoi diagram. It was introduced by Tetsuo Asano, Jiří Matoušek, and Takeshi Tokuyama in 2007.
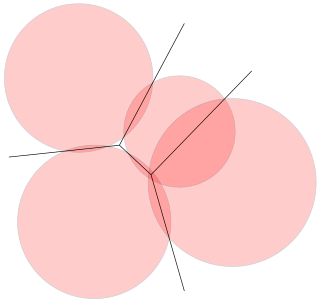
In computational geometry, a power diagram, also called a Laguerre–Voronoi diagram, Dirichlet cell complex, radical Voronoi tesselation or a sectional Dirichlet tesselation, is a partition of the Euclidean plane into polygonal cells defined from a set of circles. The cell for a given circle C consists of all the points for which the power distance to C is smaller than the power distance to the other circles. The power diagram is a form of generalized Voronoi diagram, and coincides with the Voronoi diagram of the circle centers in the case that all the circles have equal radii.
In geometry, a plesiohedron is a special kind of space-filling polyhedron, defined as the Voronoi cell of a symmetric Delone set. Three-dimensional Euclidean space can be completely filled by copies of any one of these shapes, with no overlaps. The resulting honeycomb will have symmetries that take any copy of the plesiohedron to any other copy.


