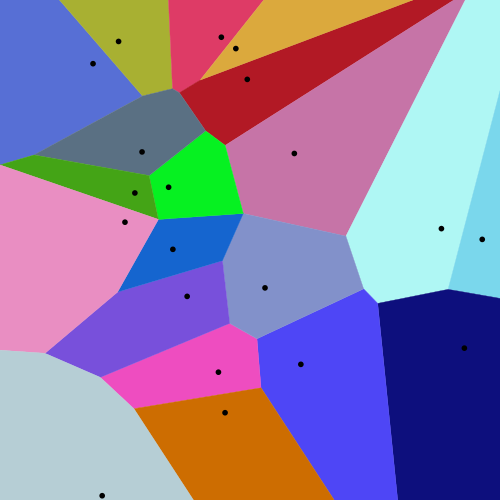
20 points and their Voronoi cells (larger version below)
In mathematics, a Voronoi diagram is a partition of a plane into regions close to each of a given set of objects. It can be classified also as a tessellation. In the simplest case, these objects are just finitely many points in the plane (called seeds, sites, or generators). For each seed there is a corresponding region, called a Voronoi cell, consisting of all points of the plane closer to that seed than to any other. The Voronoi diagram of a set of points is dual to that set's Delaunay triangulation.
The Voronoi diagram is named after mathematician Georgy Voronoy, and is also called a Voronoi tessellation, a Voronoi decomposition, a Voronoi partition, or a Dirichlet tessellation (after Peter Gustav Lejeune Dirichlet). Voronoi cells are also known as Thiessen polygons, after Alfred H. Thiessen.[1][2][3] Voronoi diagrams have practical and theoretical applications in many fields, mainly in science and technology, but also in visual art.[4][5]
Simplest case
In the simplest case, shown in the first picture, we are given a finite set of points in the Euclidean plane. In this case, each point has a corresponding cell consisting of the points in the Euclidean plane for which is the nearest site: the distance to is less than or equal to the minimum distance to any other site . For one other site , the points that are closer to than to , or equally distant, form a closed half-space, whose boundary is the perpendicular bisector of line segment . Cell is the intersection of all of these half-spaces, and hence it is a convex polygon.[6] When two cells in the Voronoi diagram share a boundary, it is a line segment, ray, or line, consisting of all the points in the plane that are equidistant to their two nearest sites. The vertices of the diagram, where three or more of these boundaries meet, are the points that have three or more equally distant nearest sites.
Formal definition
Let be a metric space with distance function . Let be a set of indices and let be a tuple (indexed collection) of nonempty subsets (the sites) in the space . The Voronoi cell, or Voronoi region, , associated with the site is the set of all points in whose distance to is not greater than their distance to the other sites , where is any index different from . In other words, if denotes the distance between the point and the subset , then
The Voronoi diagram is simply the tuple of cells . In principle, some of the sites can intersect and even coincide (an application is described below for sites representing shops), but usually they are assumed to be disjoint. In addition, infinitely many sites are allowed in the definition (this setting has applications in geometry of numbers and crystallography), but again, in many cases only finitely many sites are considered.
In the particular case where the space is a finite-dimensionalEuclidean space, each site is a point, there are finitely many points and all of them are different, then the Voronoi cells are convex polytopes and they can be represented in a combinatorial way using their vertices, sides, two-dimensional faces, etc. Sometimes the induced combinatorial structure is referred to as the Voronoi diagram. In general however, the Voronoi cells may not be convex or even connected.
In the usual Euclidean space, we can rewrite the formal definition in usual terms. Each Voronoi polygon is associated with a generator point . Let be the set of all points in the Euclidean space. Let be a point that generates its Voronoi region , that generates , and that generates , and so on. Then, as expressed by Tran et al,[7] "all locations in the Voronoi polygon are closer to the generator point of that polygon than any other generator point in the Voronoi diagram in Euclidean plane".
Illustration
As a simple illustration, consider a group of shops in a city. Suppose we want to estimate the number of customers of a given shop. With all else being equal (price, products, quality of service, etc.), it is reasonable to assume that customers choose their preferred shop simply by distance considerations: they will go to the shop located nearest to them. In this case the Voronoi cell of a given shop can be used for giving a rough estimate on the number of potential customers going to this shop (which is modeled by a point in our city).
For most cities, the distance between points can be measured using the familiar Euclidean distance:
If the setting is the Euclidean plane and a discrete set of points is given, then two points of the set are adjacent on the convex hull if and only if their Voronoi cells share an infinitely long side.
If the space is a normed space and the distance to each site is attained (e.g., when a site is a compact set or a closed ball), then each Voronoi cell can be represented as a union of line segments emanating from the sites.[8] As shown there, this property does not necessarily hold when the distance is not attained.
Under relatively general conditions (the space is a possibly infinite-dimensional uniformly convex space, there can be infinitely many sites of a general form, etc.) Voronoi cells enjoy a certain stability property: a small change in the shapes of the sites, e.g., a change caused by some translation or distortion, yields a small change in the shape of the Voronoi cells. This is the geometric stability of Voronoi diagrams.[9] As shown there, this property does not hold in general, even if the space is two-dimensional (but non-uniformly convex, and, in particular, non-Euclidean) and the sites are points.
History and research
Informal use of Voronoi diagrams can be traced back to Descartes in 1644.[10]Peter Gustav Lejeune Dirichlet used two-dimensional and three-dimensional Voronoi diagrams in his study of quadratic forms in 1850. British physician John Snow used a Voronoi-like diagram in 1854 to illustrate how the majority of people who died in the Broad Street cholera outbreak lived closer to the infected Broad Street pump than to any other water pump.
Voronoi diagrams are named after Georgy Feodosievych Voronoy who defined and studied the general n-dimensional case in 1908.[11] Voronoi diagrams that are used in geophysics and meteorology to analyse spatially distributed data are called Thiessen polygons after American meteorologist Alfred H. Thiessen, who used them to estimate rainfall from scattered measurements in 1911. Other equivalent names for this concept (or particular important cases of it): Voronoi polyhedra, Voronoi polygons, domain(s) of influence, Voronoi decomposition, Voronoi tessellation(s), Dirichlet tessellation(s).
Examples
This is a slice of the Voronoi diagram of a random set of points in a 3D box. In general, a cross section of a 3D Voronoi tessellation is a power diagram, a weighted form of a 2d Voronoi diagram, rather than being an unweighted Voronoi diagram.
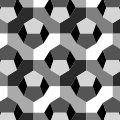
Voronoi tessellations of regular lattices of points in two or three dimensions give rise to many familiar tessellations.
A 2D lattice gives an irregular honeycomb tessellation, with equal hexagons with point symmetry; in the case of a regular triangular lattice it is regular; in the case of a rectangular lattice the hexagons reduce to rectangles in rows and columns; a square lattice gives the regular tessellation of squares; note that the rectangles and the squares can also be generated by other lattices (for example the lattice defined by the vectors (1,0) and (1/2,1/2) gives squares).
For the set of points (x,y) with x in a discrete set X and y in a discrete set Y, we get rectangular tiles with the points not necessarily at their centers.
Higher-order Voronoi diagrams
Although a normal Voronoi cell is defined as the set of points closest to a single point in S, an nth-order Voronoi cell is defined as the set of points having a particular set of n points in S as its n nearest neighbors. Higher-order Voronoi diagrams also subdivide space.
Higher-order Voronoi diagrams can be generated recursively. To generate the nth-order Voronoi diagram from setS, start with the (n−1)th-order diagram and replace each cell generated by X={x1,x2,...,xn−1} with a Voronoi diagram generated on the setS−X.
Farthest-point Voronoi diagram
For a set of n points, the (n−1)th-order Voronoi diagram is called a farthest-point Voronoi diagram.
For a given set of points S={p1,p2,...,pn}, the farthest-point Voronoi diagram divides the plane into cells in which the same point of P is the farthest point. A point of P has a cell in the farthest-point Voronoi diagram if and only if it is a vertex of the convex hull of P. Let H={h1,h2,...,hk} be the convex hull of P; then the farthest-point Voronoi diagram is a subdivision of the plane into k cells, one for each point in H, with the property that a point q lies in the cell corresponding to a site hi if and only if d(q, hi) > d(q, pj) for each pj∈S with hi ≠ pj, where d(p, q) is the Euclidean distance between two points p andq.[12][13]
The boundaries of the cells in the farthest-point Voronoi diagram have the structure of a topological tree, with infinite rays as its leaves. Every finite tree is isomorphic to the tree formed in this way from a farthest-point Voronoi diagram.[14]
Generalizations and variations
As implied by the definition, Voronoi cells can be defined for metrics other than Euclidean, such as the Mahalanobis distance or Manhattan distance. However, in these cases the boundaries of the Voronoi cells may be more complicated than in the Euclidean case, since the equidistant locus for two points may fail to be subspace of codimension 1, even in the two-dimensional case.
Approximate Voronoi diagram of a set of points. Notice the blended colors in the fuzzy boundary of the Voronoi cells.
A weighted Voronoi diagram is the one in which the function of a pair of points to define a Voronoi cell is a distance function modified by multiplicative or additive weights assigned to generator points. In contrast to the case of Voronoi cells defined using a distance which is a metric, in this case some of the Voronoi cells may be empty. A power diagram is a type of Voronoi diagram defined from a set of circles using the power distance; it can also be thought of as a weighted Voronoi diagram in which a weight defined from the radius of each circle is added to the squared Euclidean distance from the circle's center.[15]
The Voronoi diagram of points in -dimensional space can have vertices, requiring the same bound for the amount of memory needed to store an explicit description of it. Therefore, Voronoi diagrams are often not feasible for moderate or high dimensions. A more space-efficient alternative is to use approximate Voronoi diagrams.[16]
It is used in meteorology and engineering hydrology to find the weights for precipitation data of stations over an area (watershed). The points generating the polygons are the various station that record precipitation data. Perpendicular bisectors are drawn to the line joining any two stations. This results in the formation of polygons around the stations. The area touching station point is known as influence area of the station. The average precipitation is calculated by the formula
In classical archaeology, specifically art history, the symmetry of statue heads is analyzed to determine the type of statue a severed head may have belonged to. An example of this that made use of Voronoi cells was the identification of the Sabouroff head, which made use of a high-resolution polygon mesh.[17][18]
In dialectometry, Voronoi cells are used to indicate a supposed linguistic continuity between survey points.
In political science, Voronoi diagrams have been used to study multi-dimensional, multi-party competition.[19]
Natural sciences
A Voronoi tessellation emerges by radial growth from seeds outward.
In biology, Voronoi diagrams are used to model a number of different biological structures, including cells[20] and bone microarchitecture.[21] Indeed, Voronoi tessellations work as a geometrical tool to understand the physical constraints that drive the organization of biological tissues.[22]
In hydrology, Voronoi diagrams are used to calculate the rainfall of an area, based on a series of point measurements. In this usage, they are generally referred to as Thiessen polygons.
In ecology, Voronoi diagrams are used to study the growth patterns of forests and forest canopies, and may also be helpful in developing predictive models for forest fires.
In computational chemistry, ligand-binding sites are transformed into Voronoi diagrams for machine learning applications (e.g., to classify binding pockets in proteins).[23] In other applications, Voronoi cells defined by the positions of the nuclei in a molecule are used to compute atomic charges. This is done using the Voronoi deformation density method.
In astrophysics, Voronoi diagrams are used to generate adaptative smoothing zones on images, adding signal fluxes on each one. The main objective of these procedures is to maintain a relatively constant signal-to-noise ratio on all the images.
In computational fluid dynamics, the Voronoi tessellation of a set of points can be used to define the computational domains used in finite volume methods, e.g. as in the moving-mesh cosmology code AREPO.[24]
In medical diagnosis, models of muscle tissue, based on Voronoi diagrams, can be used to detect neuromuscular diseases.[22]
In epidemiology, Voronoi diagrams can be used to correlate sources of infections in epidemics. One of the early applications of Voronoi diagrams was implemented by John Snow to study the 1854 Broad Street cholera outbreak in Soho, England. He showed the correlation between residential areas on the map of Central London whose residents had been using a specific water pump, and the areas with the most deaths due to the outbreak.[26]
Engineering
In polymer physics, Voronoi diagrams can be used to represent free volumes of polymers.
In materials science, polycrystalline microstructures in metallic alloys are commonly represented using Voronoi tessellations.
In aviation, Voronoi diagrams are superimposed on oceanic plotting charts to identify the nearest airfield for in-flight diversion (see ETOPS), as an aircraft progresses through its flight plan.
In urban planning, Voronoi diagrams can be used to evaluate the Freight Loading Zone system.[33]
In mining, Voronoi polygons are used to estimate the reserves of valuable materials, minerals, or other resources. Exploratory drillholes are used as the set of points in the Voronoi polygons.
In robotics, some of the control strategies and path planning algorithms[35] of multi-robot systems are based on the Voronoi partitioning of the environment.[36][37]
Mathematics
A point location data structure can be built on top of the Voronoi diagram in order to answer nearest neighbor queries, where one wants to find the object that is closest to a given query point. Nearest neighbor queries have numerous applications. For example, one might want to find the nearest hospital or the most similar object in a database. A large application is vector quantization, commonly used in data compression.
In geometry, Voronoi diagrams can be used to find the largest empty circle amid a set of points, and in an enclosing polygon; e.g. to build a new supermarket as far as possible from all the existing ones, lying in a certain city.
Voronoi diagrams together with farthest-point Voronoi diagrams are used for efficient algorithms to compute the roundness of a set of points.[12] The Voronoi approach is also put to use in the evaluation of circularity/roundness while assessing the dataset from a coordinate-measuring machine.
Zeroes of iterated derivatives of a rational function on the complex plane accumulate on the edges of the Voronoi diagam of the set of the poles (Pólya's shires theorem[38]).
In computer graphics, Voronoi diagrams are used to calculate 3D shattering / fracturing geometry patterns. It is also used to procedurally generate organic or lava-looking textures.
In autonomous robot navigation, Voronoi diagrams are used to find clear routes. If the points are obstacles, then the edges of the graph will be the routes furthest from obstacles (and theoretically any collisions).
In global scene reconstruction, including with random sensor sites and unsteady wake flow, geophysical data, and 3D turbulence data, Voronoi tesselations are used with deep learning.[40]
In user interface development, Voronoi patterns can be used to compute the best hover state for a given point.[41]
Algorithms
Several efficient algorithms are known for constructing Voronoi diagrams, either directly (as the diagram itself) or indirectly by starting with a Delaunay triangulation and then obtaining its dual. Direct algorithms include Fortune's algorithm, an O(n log(n)) algorithm for generating a Voronoi diagram from a set of points in a plane. Bowyer–Watson algorithm, an O(n log(n)) to O(n2) algorithm for generating a Delaunay triangulation in any number of dimensions, can be used in an indirect algorithm for the Voronoi diagram. The Jump Flooding Algorithm can generate approximate Voronoi diagrams in constant time and is suited for use on commodity graphics hardware.[42][43]
Lloyd's algorithm and its generalization via the Linde–Buzo–Gray algorithm (aka k-means clustering) use the construction of Voronoi diagrams as a subroutine. These methods alternate between steps in which one constructs the Voronoi diagram for a set of seed points, and steps in which the seed points are moved to new locations that are more central within their cells. These methods can be used in spaces of arbitrary dimension to iteratively converge towards a specialized form of the Voronoi diagram, called a Centroidal Voronoi tessellation, where the sites have been moved to points that are also the geometric centers of their cells.
Voronoi in 3D
Voronoi meshes can also be generated in 3D.
Random points in 3D for forming a 3D Voronoi partition
3D Voronoi mesh of 25 random points
3D Voronoi mesh of 25 random points with 0.3 opacity and points
3D Voronoi mesh of 25 random points convex polyhedra pieces
↑Skyum, Sven (18 February 1991). "A simple algorithm for computing the smallest enclosing circle". Information Processing Letters. 37 (3): 121–125. doi:10.1016/0020-0190(91)90030-L., contains a simple algorithm to compute the farthest-point Voronoi diagram.
↑Biedl, Therese; Grimm, Carsten; Palios, Leonidas; Shewchuk, Jonathan; Verdonschot, Sander (2016). "Realizing farthest-point Voronoi diagrams". Proceedings of the 28th Canadian Conference on Computational Geometry (CCCG 2016).
↑Edelsbrunner, Herbert (2012) [1987]. "13.6 Power Diagrams". Algorithms in Combinatorial Geometry. EATCS Monographs on Theoretical Computer Science. Vol.10. Springer-Verlag. pp.327–328. ISBN978-3-642-61568-9.
↑Hui Li (2012). Baskurt, Atilla M; Sitnik, Robert (eds.). "Spatial Modeling of Bone Microarchitecture". Three-Dimensional Image Processing (3Dip) and Applications II. 8290: 82900P. Bibcode:2012SPIE.8290E..0PL. doi:10.1117/12.907371. S2CID1505014.
↑Feinstein, Joseph; Shi, Wentao; Ramanujam, J.; Brylinski, Michal (2021). "Bionoi: A Voronoi Diagram-Based Representation of Ligand-Binding Sites in Proteins for Machine Learning Applications". In Ballante, Flavio (ed.). Protein-Ligand Interactions and Drug Design. Methods in Molecular Biology. Vol.2266. New York, NY: Springer US. pp.299–312. doi:10.1007/978-1-0716-1209-5_17. ISBN978-1-0716-1209-5. PMID33759134. S2CID232338911.
Okabe, Atsuyuki; Boots, Barry; Sugihara, Kokichi; Chiu, Sung Nok (2000). Spatial Tessellations — Concepts and Applications of Voronoi Diagrams (2nded.). Wiley. ISBN0-471-98635-6.
Reem, Daniel (2009). "An Algorithm for Computing Voronoi Diagrams of General Generators in General Normed Spaces". 2009 Sixth International Symposium on Voronoi Diagrams. pp.144–152. doi:10.1109/ISVD.2009.23. ISBN978-1-4244-4769-5.
This page is based on this Wikipedia article Text is available under the CC BY-SA 4.0 license; additional terms may apply. Images, videos and audio are available under their respective licenses.