Wigner distribution function

Last updated
WDF (in red and yellow) vs FIR bank (in green) time-frequency distribution analysis. Winger ville vs FIR Bank sonogram.jpg
WDF (in red and yellow) vs FIR bank (in green) time-frequency distribution analysis.

The Wigner distribution function (WDF) is used in signal processing as a transform in time-frequency analysis.

Contents

The WDF was first proposed in physics to account for quantum corrections to classical statistical mechanics in 1932 by Eugene Wigner, and it is of importance in quantum mechanics in phase space (see, by way of comparison: Wigner quasi-probability distribution , also called the Wigner function or the Wigner–Ville distribution).

Given the shared algebraic structure between position-momentum and time-frequency conjugate pairs, it also usefully serves in signal processing, as a transform in time-frequency analysis, the subject of this article. Compared to a short-time Fourier transform, such as the Gabor transform, the Wigner distribution function provides the highest possible temporal vs frequency resolution which is mathematically possible within the limitations of the uncertainty principle. The downside is the introduction of large cross terms between every pair of signal components and between positive and negative frequencies, which makes the original formulation of the function a poor fit for most analysis applications. Subsequent modifications have been proposed which preserve the sharpness of the Wigner distribution function but largely suppress cross terms.

Mathematical definition

There are several different definitions for the Wigner distribution function. The definition given here is specific to time-frequency analysis. Given the time series , its non-stationary auto-covariance function is given by

where denotes the average over all possible realizations of the process and is the mean, which may or may not be a function of time. The Wigner function is then given by first expressing the autocorrelation function in terms of the average time and time lag , and then Fourier transforming the lag.

So for a single (mean-zero) time series, the Wigner function is simply given by

The motivation for the Wigner function is that it reduces to the spectral density function at all times for stationary processes, yet it is fully equivalent to the non-stationary autocorrelation function. Therefore, the Wigner function tells us (roughly) how the spectral density changes in time.

Time-frequency analysis example

Here are some examples illustrating how the WDF is used in time-frequency analysis.

Constant input signal

When the input signal is constant, its time-frequency distribution is a horizontal line along the time axis. For example, if x(t) = 1, then

Sinusoidal input signal

When the input signal is a sinusoidal function, its time-frequency distribution is a horizontal line parallel to the time axis, displaced from it by the sinusoidal signal's frequency. For example, if x(t) = e i2πkt, then

Chirp input signal

When the input signal is a linear chirp function, the instantaneous frequency is a linear function. This means that the time frequency distribution should be a straight line. For example, if

,

then its instantaneous frequency is

and its WDF

Delta input signal

When the input signal is a delta function, since it is only non-zero at t=0 and contains infinite frequency components, its time-frequency distribution should be a vertical line across the origin. This means that the time frequency distribution of the delta function should also be a delta function. By WDF

The Wigner distribution function is best suited for time-frequency analysis when the input signal's phase is 2nd order or lower. For those signals, WDF can exactly generate the time frequency distribution of the input signal.

Boxcar function

,

the rectangular function

Cross term property

The Wigner distribution function is not a linear transform. A cross term ("time beats") occurs when there is more than one component in the input signal, analogous in time to frequency beats. [1] In the ancestral physics Wigner quasi-probability distribution, this term has important and useful physics consequences, required for faithful expectation values. By contrast, the short-time Fourier transform does not have this feature. Negative features of the WDF are reflective of the Gabor limit of the classical signal and physically unrelated to any possible underlay of quantum structure.

The following are some examples that exhibit the cross-term feature of the Wigner distribution function.

In order to reduce the cross-term difficulty, several approaches have been proposed in the literature, [2] [3] some of them leading to new transforms as the modified Wigner distribution function, the Gabor–Wigner transform, the Choi-Williams distribution function and Cohen's class distribution.

Properties of the Wigner distribution function

The Wigner distribution function has several evident properties listed in the following table.

Projection property
Energy property
Recovery property
Mean condition frequency and mean condition time
Moment properties
Real properties
Region properties
Multiplication theorem
Convolution theorem
Correlation theorem
Time-shifting covariance
Modulation covariance
Scale covariance

Windowed Wigner Distribution Function

When a signal is not time limited, its Wigner Distribution Function is hard to implement. Thus, we add a new function(mask) to its integration part, so that we only have to implement part of the original function instead of integrating all the way from negative infinity to positive infinity. Original function: Function with mask: is real and time-limited

Implementation

According to definition:
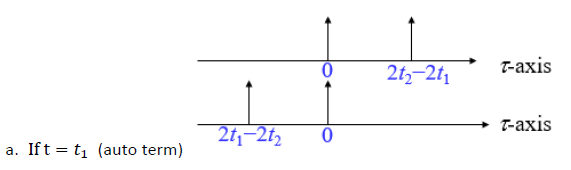
Suppose that for for and
We take as example
where is a real function
And then we compare the difference between two conditions.
X(t) 5.png
Ideal:
When mask function , which means no mask function.
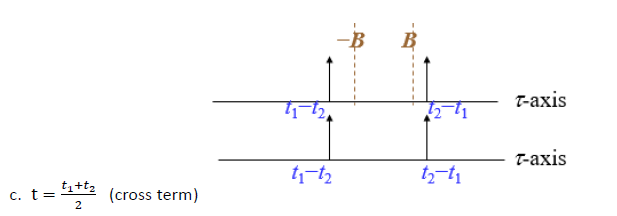
X(t) 123.png

3 Conditions

CCT 3.png
CCT 1.png
Then we consider the condition with mask function:
CCT 2.png
Crossterm 1.png
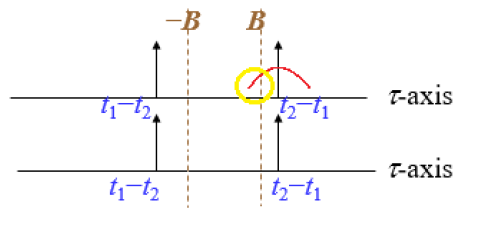
We can see that have value only between –B to B, thus conducting with can remove cross term of the function. But if x(t) is not a Delta function nor a narrow frequency function, instead, it is a function with wide frequency or ripple. The edge of the signal may still exist between –B and B, which still cause the cross term problem.
for example:
PhotoCCT15.png

See also

Related Research Articles

<span class="mw-page-title-main">Dirac delta function</span> Generalized function whose value is zero everywhere except at zero

In mathematical analysis, the Dirac delta distribution, also known as the unit impulse, is a generalized function or distribution over the real numbers, whose value is zero everywhere except at zero, and whose integral over the entire real line is equal to one.

<span class="mw-page-title-main">Fourier transform</span> Mathematical transform that expresses a function of time as a function of frequency

In physics, engineering and mathematics, the Fourier transform (FT) is an integral transform that converts a function into a form that describes the frequencies present in the original function. The output of the transform is a complex-valued function of frequency. The term Fourier transform refers to both this complex-valued function and the mathematical operation. When a distinction needs to be made the Fourier transform is sometimes called the frequency domain representation of the original function. The Fourier transform is analogous to decomposing the sound of a musical chord into the intensities of its constituent pitches.

In mathematics, the convolution theorem states that under suitable conditions the Fourier transform of a convolution of two functions is the pointwise product of their Fourier transforms. More generally, convolution in one domain equals point-wise multiplication in the other domain. Other versions of the convolution theorem are applicable to various Fourier-related transforms.

<span class="mw-page-title-main">Fourier series</span> Decomposition of periodic functions into sums of simpler sinusoidal forms

A Fourier series is an expansion of a periodic function into a sum of trigonometric functions. The Fourier series is an example of a trigonometric series, but not all trigonometric series are Fourier series. By expressing a function as a sum of sines and cosines, many problems involving the function become easier to analyze because trigonometric functions are well understood. For example, Fourier series were first used by Joseph Fourier to find solutions to the heat equation. This application is possible because the derivatives of trigonometric functions fall into simple patterns. Fourier series cannot be used to approximate arbitrary functions, because most functions have infinitely many terms in their Fourier series, and the series do not always converge. Well-behaved functions, for example smooth functions, have Fourier series that converge to the original function. The coefficients of the Fourier series are determined by integrals of the function multiplied by trigonometric functions, described in Common forms of the Fourier series below.

<span class="mw-page-title-main">Heaviside step function</span> Indicator function of positive numbers

The Heaviside step function, or the unit step function, usually denoted by H or θ, is a step function named after Oliver Heaviside, the value of which is zero for negative arguments and one for positive arguments. It is an example of the general class of step functions, all of which can be represented as linear combinations of translations of this one.

<span class="mw-page-title-main">Spectral density</span> Relative importance of certain frequencies in a composite signal

The power spectrum of a time series describes the distribution of power into frequency components composing that signal. According to Fourier analysis, any physical signal can be decomposed into a number of discrete frequencies, or a spectrum of frequencies over a continuous range. The statistical average of any sort of signal as analyzed in terms of its frequency content, is called its spectrum.

<span class="mw-page-title-main">Short-time Fourier transform</span> Fourier-related transform suited to signals that change rather quickly in time

The short-time Fourier transform (STFT), is a Fourier-related transform used to determine the sinusoidal frequency and phase content of local sections of a signal as it changes over time. In practice, the procedure for computing STFTs is to divide a longer time signal into shorter segments of equal length and then compute the Fourier transform separately on each shorter segment. This reveals the Fourier spectrum on each shorter segment. One then usually plots the changing spectra as a function of time, known as a spectrogram or waterfall plot, such as commonly used in software defined radio (SDR) based spectrum displays. Full bandwidth displays covering the whole range of an SDR commonly use fast Fourier transforms (FFTs) with 2^24 points on desktop computers.

In mathematics, the Poisson summation formula is an equation that relates the Fourier series coefficients of the periodic summation of a function to values of the function's continuous Fourier transform. Consequently, the periodic summation of a function is completely defined by discrete samples of the original function's Fourier transform. And conversely, the periodic summation of a function's Fourier transform is completely defined by discrete samples of the original function. The Poisson summation formula was discovered by Siméon Denis Poisson and is sometimes called Poisson resummation.

In signal processing, time–frequency analysis comprises those techniques that study a signal in both the time and frequency domains simultaneously, using various time–frequency representations. Rather than viewing a 1-dimensional signal and some transform, time–frequency analysis studies a two-dimensional signal – a function whose domain is the two-dimensional real plane, obtained from the signal via a time–frequency transform.

Stransform as a time–frequency distribution was developed in 1994 for analyzing geophysics data. In this way, the S transform is a generalization of the short-time Fourier transform (STFT), extending the continuous wavelet transform and overcoming some of its disadvantages. For one, modulation sinusoids are fixed with respect to the time axis; this localizes the scalable Gaussian window dilations and translations in S transform. Moreover, the S transform doesn't have a cross-term problem and yields a better signal clarity than Gabor transform. However, the S transform has its own disadvantages: the clarity is worse than Wigner distribution function and Cohen's class distribution function.

In pulsed radar and sonar signal processing, an ambiguity function is a two-dimensional function of propagation delay and Doppler frequency , . It represents the distortion of a returned pulse due to the receiver matched filter of the return from a moving target. The ambiguity function is defined by the properties of the pulse and of the filter, and not any particular target scenario.

<span class="mw-page-title-main">Rectangular function</span> Function whose graph is 0, then 1, then 0 again, in an almost-everywhere continuous way

The rectangular function is defined as

<span class="mw-page-title-main">Dirac comb</span> Periodic distribution ("function") of "point-mass" Dirac delta sampling

In mathematics, a Dirac comb is a periodic function with the formula

<span class="mw-page-title-main">Linear time-invariant system</span> Mathematical model which is both linear and time-invariant

In system analysis, among other fields of study, a linear time-invariant (LTI) system is a system that produces an output signal from any input signal subject to the constraints of linearity and time-invariance; these terms are briefly defined below. These properties apply (exactly or approximately) to many important physical systems, in which case the response y(t) of the system to an arbitrary input x(t) can be found directly using convolution: y(t) = (xh)(t) where h(t) is called the system's impulse response and ∗ represents convolution (not to be confused with multiplication). What's more, there are systematic methods for solving any such system (determining h(t)), whereas systems not meeting both properties are generally more difficult (or impossible) to solve analytically. A good example of an LTI system is any electrical circuit consisting of resistors, capacitors, inductors and linear amplifiers.

<span class="mw-page-title-main">Gabor transform</span>

The Gabor transform, named after Dennis Gabor, is a special case of the short-time Fourier transform. It is used to determine the sinusoidal frequency and phase content of local sections of a signal as it changes over time. The function to be transformed is first multiplied by a Gaussian function, which can be regarded as a window function, and the resulting function is then transformed with a Fourier transform to derive the time-frequency analysis. The window function means that the signal near the time being analyzed will have higher weight. The Gabor transform of a signal x(t) is defined by this formula:

A Modified Wigner distribution function is a variation of the Wigner distribution function (WD) with reduced or removed cross-terms.

The Gabor transform, named after Dennis Gabor, and the Wigner distribution function, named after Eugene Wigner, are both tools for time-frequency analysis. Since the Gabor transform does not have high clarity, and the Wigner distribution function has a "cross term problem", a 2007 study by S. C. Pei and J. J. Ding proposed a new combination of the two transforms that has high clarity and no cross term problem. Since the cross term does not appear in the Gabor transform, the time frequency distribution of the Gabor transform can be used as a filter to filter out the cross term in the output of the Wigner distribution function.

Bilinear time–frequency distributions, or quadratic time–frequency distributions, arise in a sub-field of signal analysis and signal processing called time–frequency signal processing, and, in the statistical analysis of time series data. Such methods are used where one needs to deal with a situation where the frequency composition of a signal may be changing over time; this sub-field used to be called time–frequency signal analysis, and is now more often called time–frequency signal processing due to the progress in using these methods to a wide range of signal-processing problems.

The cone-shape distribution function, also known as the Zhao–Atlas–Marks time-frequency distribution,, is one of the members of Cohen's class distribution function. It was first proposed by Yunxin Zhao, Les E. Atlas, and Robert J. Marks II in 1990. The distribution's name stems from the twin cone shape of the distribution's kernel function on the plane. The advantage of the cone kernel function is that it can completely remove the cross-term between two components having the same center frequency. Cross-term results from components with the same time center, however, cannot be completely removed by the cone-shaped kernel.

Time–frequency analysis for music signals is one of the applications of time–frequency analysis. Musical sound can be more complicated than human vocal sound, occupying a wider band of frequency. Music signals are time-varying signals; while the classic Fourier transform is not sufficient to analyze them, time–frequency analysis is an efficient tool for such use. Time–frequency analysis is extended from the classic Fourier approach. Short-time Fourier transform (STFT), Gabor transform (GT) and Wigner distribution function (WDF) are famous time–frequency methods, useful for analyzing music signals such as notes played on a piano, a flute or a guitar.

References

  1. F. Hlawatsch and P. Flandrin, "The interference structure of the Wigner distribution and related time-frequency signal representations", in W. Mecklenbräuker and F. Hlawatsch, The Wigner Distribution - Theory and Applications in Signal Processing
  2. B. Boashah (Ed.), Time Frequency Signal Analysis and Processing, Elsevier, 2003
  3. P. Flandrin, Time-Frequency/Time-Scale Analysis, Elsevier, 1998

Further reading