Analysis of variance (ANOVA) is a collection of statistical models and their associated estimation procedures used to analyze the differences among means. ANOVA was developed by the statistician Ronald Fisher. ANOVA is based on the law of total variance, where the observed variance in a particular variable is partitioned into components attributable to different sources of variation. In its simplest form, ANOVA provides a statistical test of whether two or more population means are equal, and therefore generalizes the t-test beyond two means. In other words, the ANOVA is used to test the difference between two or more means.

A descriptive statistic is a summary statistic that quantitatively describes or summarizes features from a collection of information, while descriptive statistics is the process of using and analysing those statistics. Descriptive statistic is distinguished from inferential statistics by its aim to summarize a sample, rather than use the data to learn about the population that the sample of data is thought to represent. This generally means that descriptive statistics, unlike inferential statistics, is not developed on the basis of probability theory, and are frequently nonparametric statistics. Even when a data analysis draws its main conclusions using inferential statistics, descriptive statistics are generally also presented. For example, in papers reporting on human subjects, typically a table is included giving the overall sample size, sample sizes in important subgroups, and demographic or clinical characteristics such as the average age, the proportion of subjects of each sex, the proportion of subjects with related co-morbidities, etc.
Engineering statistics combines engineering and statistics using scientific methods for analyzing data. Engineering statistics involves data concerning manufacturing processes such as: component dimensions, tolerances, type of material, and fabrication process control. There are many methods used in engineering analysis and they are often displayed as histograms to give a visual of the data as opposed to being just numerical. Examples of methods are:
- Design of Experiments (DOE) is a methodology for formulating scientific and engineering problems using statistical models. The protocol specifies a randomization procedure for the experiment and specifies the primary data-analysis, particularly in hypothesis testing. In a secondary analysis, the statistical analyst further examines the data to suggest other questions and to help plan future experiments. In engineering applications, the goal is often to optimize a process or product, rather than to subject a scientific hypothesis to test of its predictive adequacy. The use of optimal designs reduces the cost of experimentation.
- Quality control and process control use statistics as a tool to manage conformance to specifications of manufacturing processes and their products.
- Time and methods engineering use statistics to study repetitive operations in manufacturing in order to set standards and find optimum manufacturing procedures.
- Reliability engineering which measures the ability of a system to perform for its intended function and has tools for improving performance.
- Probabilistic design involving the use of probability in product and system design
- System identification uses statistical methods to build mathematical models of dynamical systems from measured data. System identification also includes the optimal design of experiments for efficiently generating informative data for fitting such models.
Observational error is the difference between a measured value of a quantity and its true value. In statistics, an error is not necessarily a "mistake". Variability is an inherent part of the results of measurements and of the measurement process.

Statistical inference is the process of using data analysis to infer properties of an underlying distribution of probability. Inferential statistical analysis infers properties of a population, for example by testing hypotheses and deriving estimates. It is assumed that the observed data set is sampled from a larger population.
The theory of statistics provides a basis for the whole range of techniques, in both study design and data analysis, that are used within applications of statistics. The theory covers approaches to statistical-decision problems and to statistical inference, and the actions and deductions that satisfy the basic principles stated for these different approaches. Within a given approach, statistical theory gives ways of comparing statistical procedures; it can find a best possible procedure within a given context for given statistical problems, or can provide guidance on the choice between alternative procedures.

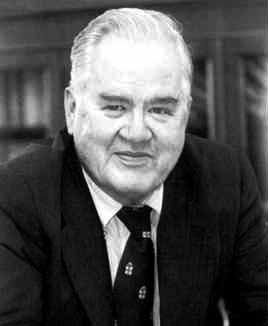
John Wilder Tukey was an American mathematician and statistician, best known for the development of the fast Fourier Transform (FFT) algorithm and box plot. The Tukey range test, the Tukey lambda distribution, the Tukey test of additivity, and the Teichmüller–Tukey lemma all bear his name. He is also credited with coining the term 'bit' and the first published use of the word 'software'.
In statistics, exploratory data analysis (EDA) is an approach of analyzing data sets to summarize their main characteristics, often using statistical graphics and other data visualization methods. A statistical model can be used or not, but primarily EDA is for seeing what the data can tell us beyond the formal modeling and thereby contrasts traditional hypothesis testing. Exploratory data analysis has been promoted by John Tukey since 1970 to encourage statisticians to explore the data, and possibly formulate hypotheses that could lead to new data collection and experiments. EDA is different from initial data analysis (IDA), which focuses more narrowly on checking assumptions required for model fitting and hypothesis testing, and handling missing values and making transformations of variables as needed. EDA encompasses IDA.

Dependent and independent variables are variables in mathematical modeling, statistical modeling and experimental sciences. Dependent variables receive this name because, in an experiment, their values are studied under the supposition or demand that they depend, by some law or rule, on the values of other variables. Independent variables, in turn, are not seen as depending on any other variable in the scope of the experiment in question. In this sense, some common independent variables are time, space, density, mass, fluid flow rate, and previous values of some observed value of interest to predict future values.
Taguchi methods are statistical methods, sometimes called robust design methods, developed by Genichi Taguchi to improve the quality of manufactured goods, and more recently also applied to engineering, biotechnology, marketing and advertising. Professional statisticians have welcomed the goals and improvements brought about by Taguchi methods, particularly by Taguchi's development of designs for studying variation, but have criticized the inefficiency of some of Taguchi's proposals.

Mathematical statistics is the application of probability theory, a branch of mathematics, to statistics, as opposed to techniques for collecting statistical data. Specific mathematical techniques which are used for this include mathematical analysis, linear algebra, stochastic analysis, differential equations, and measure theory.

In the design of experiments, optimal designs are a class of experimental designs that are optimal with respect to some statistical criterion. The creation of this field of statistics has been credited to Danish statistician Kirstine Smith.

Sir David Roxbee Cox was a British statistician and educator. His wide-ranging contributions to the field of statistics included introducing logistic regression, the proportional hazards model and the Cox process, a point process named after him.

In statistics, response surface methodology (RSM) explores the relationships between several explanatory variables and one or more response variables. The method was introduced by George E. P. Box and K. B. Wilson in 1951. The main idea of RSM is to use a sequence of designed experiments to obtain an optimal response. Box and Wilson suggest using a second-degree polynomial model to do this. They acknowledge that this model is only an approximation, but they use it because such a model is easy to estimate and apply, even when little is known about the process.
Brian David Ripley FRSE is a British statistician. From 1990, he was professor of applied statistics at the University of Oxford and is also a professorial fellow at St Peter's College. He retired August 2014 due to ill health.

Computational statistics, or statistical computing, is the bond between statistics and computer science. It means statistical methods that are enabled by using computational methods. It is the area of computational science specific to the mathematical science of statistics. This area is also developing rapidly, leading to calls that a broader concept of computing should be taught as part of general statistical education.
Peter J. Rousseeuw is a statistician known for his work on robust statistics and cluster analysis. He obtained his PhD in 1981 at the Vrije Universiteit Brussel, following research carried out at the ETH in Zurich, which led to a book on influence functions. Later he was professor at the Delft University of Technology, The Netherlands, at the University of Fribourg, Switzerland, and at the University of Antwerp, Belgium. Next he was a senior researcher at Renaissance Technologies. He then returned to Belgium as professor at KU Leuven, until becoming emeritus in 2022. His former PhD students include Annick Leroy, Hendrik Lopuhaä, Geert Molenberghs, Christophe Croux, Mia Hubert, Stefan Van Aelst, Tim Verdonck and Jakob Raymaekers.

In non-parametric statistics, the Theil–Sen estimator is a method for robustly fitting a line to sample points in the plane by choosing the median of the slopes of all lines through pairs of points. It has also been called Sen's slope estimator, slope selection, the single median method, the Kendall robust line-fit method, and the Kendall–Theil robust line. It is named after Henri Theil and Pranab K. Sen, who published papers on this method in 1950 and 1968 respectively, and after Maurice Kendall because of its relation to the Kendall tau rank correlation coefficient.
Pranab Kumar Sen is a statistician, a professor of statistics and the Cary C. Boshamer Professor of Biostatistics at the University of North Carolina at Chapel Hill.
Fang Kaitai, also known as Kai-Tai Fang, is a Chinese mathematician and statistician who has helped to develop generalized multivariate analysis, which extends classical multivariate analysis beyond the multivariate normal distribution to more general elliptical distributions. He has also contributed to the design of experiments.


