Federal elections were held in Germany on 21 February 1887. The National Liberal Party became the largest party in the Reichstag by winning 98 of the 397 seats, whilst the Centre Party, formerly the largest party, was reduced to 98 seats. Voter turnout was 77.5%.

Federal elections were held in Germany on 25 January 1907. Despite the Social Democratic Party (SPD) receiving a clear plurality of votes, they were hampered by the unequal constituency sizes that favoured rural seats. As a result, the Centre Party remained the largest party in the Reichstag after winning 101 of the 397 seats, whilst the SPD won only 43. Voter turnout was 84.7%.

Folketing elections were held in Denmark on 28 October 1947, except in the Faroe Islands where they were held on 18 February 1948. The Social Democratic Party remained the largest in the Folketing, with 57 of the 150 seats. Voter turnout was 86% in Denmark proper and 60% in the Faroes.
The Russian Party in Estonia was a minor political party in Estonia.
Federal elections were held in Switzerland on 28 October 1928. Although the Social Democratic Party received the most votes, the Free Democratic Party remained the largest party in the National Council, winning 58 of the 198 seats.
Federal elections were held in Switzerland on 25 October 1931. Although the Social Democratic Party received the most votes, the Free Democratic Party remained the largest party in the National Council, winning 52 of the 187 seats.
Federal elections were held in Switzerland on 23 October 1983. The Free Democratic Party emerged as the largest party in the National Council, winning 54 of the 200 seats. It was the first time the Social Democratic Party had not received the most votes in a federal election since 1925.
Federal elections were held in Switzerland on 27 October 1963. The Social Democratic Party emerged as the largest party in the National Council, winning 53 of the 200 seats.
Federal elections were held in Switzerland on 25 October 1959. The Social Democratic Party and the Free Democratic Party emerged as the largest parties in the National Council, each winning 51 of the 196 seats.
Federal elections were held in Switzerland on 30 October 1955. The Social Democratic Party emerged as the largest party in the National Council, winning 53 of the 196 seats.
Federal elections were held in Switzerland on 28 October 1951. Although the Social Democratic Party received the most votes, the Free Democratic Party remained the largest party in the National Council, winning 51 of the 196 seats.
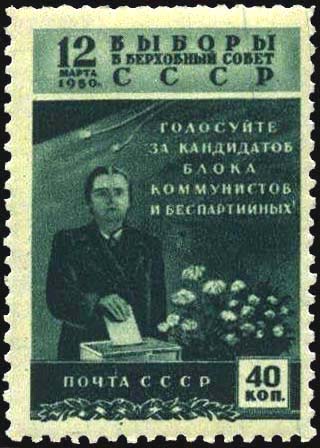
Elections to the Supreme Soviet were held in the Soviet Union on 12 March 1950.

General elections were held in Portugal on 28 April 1918, following a coup by Sidónio Pais in December 1917. The elections were boycotted by the Democratic Party, the Evolutionist Party and the Republican Union, who had won over 90% of the seats in the 1915 elections.

Parliamentary elections were held in Portugal on 16 December 1934, the first following the establishment of the one-party state known as the Estado Novo. The National Union was the only party to contest the elections, and no opposition candidates were allowed to run. It subsequently won all seats in the National Assembly, three of which were taken by women.
Parliamentary elections were held in Portugal on 1 November 1942. The country was a one-party state at the time and the National Union was the only party to contest the elections, with no opposition candidates allowed to run.
Federal elections were held in Switzerland on 29 October 1922. The Free Democratic Party remained the largest party in the National Council, winning 60 of the 198 seats.
Federal elections were held in Switzerland on 27 October 1935. The Social Democratic Party emerged as the largest party in the National Council, winning 50 of the 187 seats.
Federal elections were held in Switzerland on 29 October 1939. The Free Democratic Party emerged as the largest party in the National Council, winning 49 of the 187 seats. Due to the outbreak of World War II, there were no elections in nine of the 25 cantons; Appenzell Ausserrhoden, Lucerne, Neuchâtel, Schwyz, Solothurn, Ticino, Valais, Vaud and Zug. In what became known as "silent elections", a total of 55 candidates were elected unopposed.
The United Labour Social Democratic Party was a political party in Bulgaria.
The Tenants' Union was a political party in Estonia.