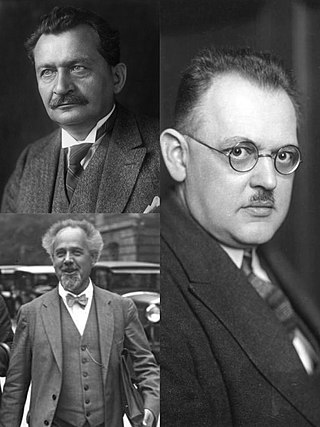
General elections were held in the Netherlands on 5 July 1922. They were the first elections held under universal suffrage, which became reality after the acceptance of a proposal by Henri Marchant in 1919 that gave women full voting rights. Almost all major parties had a woman elected. The number of female representatives increased from one to seven. Only the Anti-Revolutionary Party principally excluded women from the House of Representatives. Another amendment to the electoral law increased the electoral threshold from 0.5% to 0.75%, after six parties had won seats with less than 0.75% of the vote in the previous elections.

Snap federal elections were held in Germany on 7 December 1924, the second that year after the Reichstag had been dissolved on 20 October. The Social Democratic Party remained the largest party in the Reichstag, receiving an increased share of the vote and winning 131 of the 493 seats. Voter turnout was 78.8%.

Federal elections were held in Germany on 12 January 1912. Although the Social Democratic Party (SPD) had received the most votes in every election since 1890, it had never won the most seats, and in the 1907 elections, it had won fewer than half the seats won by the Centre Party despite receiving over a million more votes. However, the 1912 elections saw the SPD retain its position as the most voted-for party and become the largest party in the Reichstag, winning 110 of the 397 seats.

Federal elections were held in Germany on 4 May 1924, after the Reichstag had been dissolved on 13 March. The Social Democratic Party remained the largest party, winning 100 of the 472 seats. Voter turnout was 77.4%.

General elections were held in Sweden on 15 September 1940. The Swedish Social Democratic Party remained the largest party, winning 134 of the 230 seats in the Andra kammaren of the Riksdag. It is one of two general elections in Swedish history where a single party received more than half of the vote.

General elections were held in Sweden on 15 September 1985. The Swedish Social Democratic Party remained the largest party in the Riksdag, winning 159 of the 349 seats. Its leader, Olof Palme, kept his position as Prime Minister. He would retain this position successfully until his assassination in 1986.

General elections were held in Sweden on 18 September 1994. The Swedish Social Democratic Party remained the largest party in the Riksdag, winning 161 of the 349 seats. Led by Ingvar Carlsson, the party returned to power and formed a minority government after the election. This was the final time the Social Democrats recorded above 40% of the vote before the party's vote share steeply declined four years later and never recovered. The Greens also returned to the Riksdag after a three-year absence.

General elections were held in Luxembourg on 13 June 1999, alongside European Parliament elections. The Christian Social People's Party remained the largest party, winning 19 of the 60 seats in the Chamber of Deputies. It formed a coalition government with the Democratic Party.

Folketing elections were held in Denmark on 23 March 1943 alongside Landsting elections, except in the Faroe Islands where they were held on 3 May. They were the first and only parliamentary elections held during the German occupation, and although many people feared how the Germans might react, they took place peacefully.
The Russian Party in Estonia was a minor political party in Estonia.

Federal elections were held in Switzerland on 24 October 1999. Although the Swiss People's Party received the most votes for the first time in the party's history, the Social Democratic Party remained the largest party in the National Council, winning 51 of the 200 seats.
Federal elections were held in Switzerland on 28 October 1928. Although the Social Democratic Party received the most votes, the Free Democratic Party remained the largest party in the National Council, winning 58 of the 198 seats.
Federal elections were held in Switzerland on 25 October 1931. Although the Social Democratic Party received the most votes, the Free Democratic Party remained the largest party in the National Council, winning 52 of the 187 seats.
Federal elections were held in Switzerland on 23 October 1983. The Free Democratic Party emerged as the largest party in the National Council, winning 54 of the 200 seats. It was the first time the Social Democratic Party had not received the most votes in a federal election since 1925.
Federal elections were held in Switzerland on 31 October 1971. Although the Social Democratic Party received the most votes, the Free Democratic Party emerged as the largest party in the National Council, winning 49 of the 200 seats. They were the first federal elections in which women were allowed to vote, following a referendum earlier in the year that introduced universal suffrage for federal elections.
Federal elections were held in Switzerland on 25 October 1959. The Social Democratic Party and the Free Democratic Party emerged as the largest parties in the National Council, each winning 51 of the 196 seats.
Federal elections were held in Switzerland on 28 October 1951. Although the Social Democratic Party received the most votes, the Free Democratic Party remained the largest party in the National Council, winning 51 of the 196 seats.
Federal elections were held in Switzerland on 26 October 1947. Although the Social Democratic Party received the most votes, the Free Democratic Party emerged as the largest party in the National Council, winning 52 of the 194 seats.
Federal elections were held in Switzerland on 26 October 1919. The Free Democratic Party emerged as the largest party in the National Council, winning 60 of the 189 seats.

The National Democratic Group was a political party in Andorra.


