| |||||||||||||||||||||||||||||||
35 of the 96 seats in the United States Senate 49 seats needed for a majority | |||||||||||||||||||||||||||||||
---|---|---|---|---|---|---|---|---|---|---|---|---|---|---|---|---|---|---|---|---|---|---|---|---|---|---|---|---|---|---|---|
| |||||||||||||||||||||||||||||||
Results of the elections: Democratic gain Democratic hold Republican gain Republican hold No election | |||||||||||||||||||||||||||||||
|
The 1916 United States Senate elections were elections that coincided with the re-election of President Woodrow Wilson. This was the first election since the enactment of the Seventeenth Amendment that all 32 Class 1 Senators were selected by direct or popular elections instead of state legislatures. Republicans gained a net of two seats from the Democrats, and then a furthered seat through mid-term vacancies thereby reducing Democrats to a 53-43 majority.
Four Republicans and two Democrats retired instead of seeking re-election.
Nine Democrats and five Republicans sought re-election but lost in the primary or general election.
Seven Democrats and two Republicans died during the 65th Congress, and initially were all replaced by appointees.
State | Senator | Replaced by |
---|---|---|
Idaho (Class 3) | James H. Brady | John F. Nugent |
Kentucky (Class 2) | Ollie Murray James | George B. Martin |
Louisiana (Class 3) | Robert F. Broussard | Walter Guion |
Missouri (Class 3) | William J. Stone | Xenophon P. Wilfley |
Nevada (Class 3) | Francis G. Newlands | Charles Henderson |
New Hampshire (Class 3) | Jacob H. Gallinger | Irving W. Drew |
New Jersey (Class 2) | William Hughes | David Baird Sr. |
Oregon (Class 2) | Harry Lane | Charles L. McNary |
South Carolina (Class 2) | Benjamin Tillman | Christie Benet |
D1 | D2 | D3 | D4 | D5 | D6 | D7 | D8 | ||
D18 | D17 | D16 | D15 | D14 | D13 | D12 | D11 | D10 | D9 |
D19 | D20 | D21 | D22 | D23 | D24 | D25 | D26 | D27 | D28 |
D38 Ariz. Ran | D37 | D36 | D35 | D34 | D33 | D32 | D31 | D30 | D29 |
D39 Ark. (sp) Died | D40 Ind. (sp) Ran | D41 Fla. Ran | D42 Ind. (reg) Ran | D43 Maine (reg) Ran | D44 Md. Ran | D45 Miss. Ran | D46 Mo. Ran | D47 Mont. Ran | D48 Neb. Ran |
Majority → | D49 Nev. Ran | ||||||||
R39 Wis. Ran | R40 Wyo. Ran | D56 W.Va. Ran | D55 Va. Ran | D54 Texas Ran | D53 Tenn. Ran | D52 Ohio Ran | D51 N.Y. Retired | D50 N.J. Ran | |
R38 Wash. Ran | R37 Vt. Ran | R36 Utah Ran | R35 R.I. Ran | R34 Pa. Retired | R33 N.D. Ran | R32 N.M. Retired | R31 Minn. Ran | R30 Mich. Ran | R29 Mass. Ran |
R19 | R20 | R21 | R22 | R23 | R24 | R25 Calif. Retired | R26 Conn. Ran | R27 Del. Ran | R28 Maine (sp) Died |
R18 | R17 | R16 | R15 | R14 | R13 | R12 | R11 | R10 | R9 |
R1 | R2 | R3 | R4 | R5 | R6 | R7 | R8 |
D1 | D2 | D3 | D4 | D5 | D6 | D7 | D8 | ||
D18 | D17 | D16 | D15 | D14 | D13 | D12 | D11 | D10 | D9 |
D19 | D20 | D21 | D22 | D23 | D24 | D25 | D26 | D27 | D28 |
D38 Ariz. Re-elected | D37 | D36 | D35 | D34 | D33 | D32 | D31 | D30 | D29 |
D39 Ark. (sp) Hold | D40 Del. Gain | D41 Fla. Hold | D42 Miss. Re-elected | D43 Mo. Re-elected | D44 Mont. Re-elected | D45 Neb. Re-elected | D46 Nev. Re-elected | D47 N.M. Gain | D48 Ohio Re-elected |
Majority → | D49 R.I. Gain | ||||||||
R39 Vt. Re-elected | R40 Wash. Re-elected | R41 W.Va. Gain | R42 Wis. Re-elected | D54 Wyo. Gain | D53 Va. Re-elected | D52 Utah Gain | D51 Texas Re-elected | D50 Tenn. Hold | |
R38 Pa. Hold | R37 N.D. Re-elected | R36 N.Y. Gain | R35 N.J. Gain | R34 Minn. Hold | R33 Mich. Re-elected | R32 Mass. Re-elected | R31 Md. Gain | R30 Maine (sp) Hold | R29 Maine (reg) Gain |
R19 | R20 | R21 | R22 | R23 | R24 | R25 Calif. Hold | R26 Conn. Re-elected | R27 Ind. (reg) Gain | R28 Ind. (sp) Gain [lower-alpha 4] |
R18 | R17 | R16 | R15 | R14 | R13 | R12 | R11 | R10 | R9 |
R1 | R2 | R3 | R4 | R5 | R6 | R7 | R8 |
Key |
|
---|
In these special elections, the winner was seated during 1916 or before March 4, 1917; ordered by election date.
State | Incumbent | Results | Candidates | ||
---|---|---|---|---|---|
Senator | Party | Electoral history | |||
Maine (Class 2) | Edwin C. Burleigh | Republican | 1913 | Incumbent died June 16, 1916. A new senator elected September 11, 1916. Republican hold. |
|
Arkansas (Class 3) | James P. Clarke | Democratic | 1903 1909 1914 | Incumbent died October 1, 1916. New senator elected November 7, 1916. Democratic hold. |
|
Indiana (Class 3) | Thomas Taggart | Democratic | 1916 (Appointed) | Interim appointee lost election to finish term. New senator elected November 7, 1916. Republican gain. |
|
In these general elections, the winners were elected for the term beginning March 4, 1917; ordered by state.
All of the elections involved the Class 1 seats.
State | Incumbent | Results | Candidates | ||
---|---|---|---|---|---|
Senator | Party | Electoral history | |||
Arizona | Henry F. Ashurst | Democratic | 1912 (New state) | Incumbent re-elected. |
|
California | John D. Works | Republican | 1911 | Incumbent retired. New senator elected. Republican hold. |
|
Connecticut | George P. McLean | Republican | 1911 | Incumbent re-elected. |
|
Delaware | Henry A. du Pont | Republican | 1906 (special) 1911 | Incumbent lost re-election. New senator elected. Democratic gain. |
|
Florida | Nathan P. Bryan | Democratic | 1911 (Appointed) 1911 (Late) | Incumbent lost renomination. New senator elected. Democratic hold. |
|
Indiana | John W. Kern | Democratic | 1911 | Incumbent lost re-election. New senator elected. Republican gain. |
|
Maine | Charles F. Johnson | Democratic | 1911 | Incumbent lost re-election. New senator elected September 11, 1916. Republican gain. |
|
Maryland | Blair Lee I | Democratic | 1913 (special) | Incumbent lost renomination. New senator elected. Republican gain. |
|
Massachusetts | Henry Cabot Lodge | Republican | 1893 1899 1905 1911 | Incumbent re-elected |
|
Michigan | Charles E. Townsend | Republican | 1911 | Incumbent re-elected. [13] |
|
Minnesota | Moses E. Clapp | Republican | 1901 (special) 1905 1911 | Incumbent lost renomination. New senator elected. Republican hold. |
|
Mississippi | John Sharp Williams | Democratic | 1908 (Early) | Incumbent re-elected. |
|
Missouri | James A. Reed | Democratic | 1911 | Incumbent re-elected. |
|
Montana | Henry L. Myers | Democratic | 1911 | Incumbent re-elected. |
|
Nebraska | Gilbert Hitchcock | Democratic | 1911 | Incumbent re-elected. |
|
Nevada | Key Pittman | Democratic | 1913 (special) | Incumbent re-elected. |
|
New Jersey | James E. Martine | Democratic | 1911 | Incumbent lost re-election. New senator elected. Republican gain. |
|
New Mexico | Thomas B. Catron | Republican | 1912 (New state) | Incumbent retired. New senator elected. Democratic gain. |
|
New York | James A. O'Gorman | Democratic | 1911 | Incumbent retired. New senator elected. Republican gain. |
|
North Dakota | Porter J. McCumber | Republican | 1911 | Incumbent re-elected. |
|
Ohio | Atlee Pomerene | Democratic | 1911 | Incumbent re-elected. |
|
Pennsylvania | George T. Oliver | Republican | 1909 (special) 1911 | Incumbent retired. New senator elected. Republican hold. |
|
Rhode Island | Henry F. Lippitt | Republican | 1911 | Incumbent lost re-election. New senator elected. Democratic gain. |
|
Tennessee | Luke Lea | Democratic | 1911 | Incumbent lost renomination. New senator elected. [25] Democratic hold. |
|
Texas | Charles A. Culberson | Democratic | 1899 1905 1911 | Incumbent re-elected. |
|
Utah | George Sutherland | Republican | 1905 1911 | Incumbent lost re-election. New senator elected. Democratic gain. |
|
Vermont | Carroll S. Page | Republican | 1908 (special) 1910 | Incumbent re-elected. |
|
Virginia | Claude A. Swanson | Democratic | 1910 (Appointed) 1911 (Appointed) 1912 (special) | Incumbent re-elected. |
|
Washington | Miles Poindexter | Republican | 1911 | Incumbent re-elected. |
|
West Virginia | William E. Chilton | Democratic | 1911 | Incumbent lost re-election. New senator elected. Republican gain. |
|
Wisconsin | Robert M. La Follette | Republican | 1905 1911 | Incumbent re-elected. |
|
Wyoming | Clarence D. Clark | Republican | 1911 | Incumbent lost re-election. New senator elected. Democratic gain. |
|
Eighteen races had a margin of victory under 10%:
State | Party of winner | Margin |
---|---|---|
Indiana (special) | Republican (flip) | 1.37% |
Indiana | Republican (flip) | 1.63% |
Maryland | Republican (flip) | 1.7% |
West Virginia | Republican (flip) | 1.97% |
Missouri | Democratic | 3.12% |
Ohio | Democratic | 3.14% |
Connecticut | Republican | 3.93% |
Nebraska | Democratic | 4.1% |
Delaware | Democratic (flip) | 4.9% |
New Mexico | Democratic (flip) | 5.06% |
Wyoming | Democratic (flip) | 6.0% |
Massachusetts | Republican | 6.37% |
Nevada | Democratic | 6.53% |
Maine | Republican (flip) | 6.63% [lower-alpha 5] |
Motana | Democratic | 7.66% |
Maine (special) | Republican | 8.79% |
Rhode Island | Democratic (flip) | 8.82% |
Tennessee | Democratic | 9.67% |
| |||||||||||||||||||||||||||||||||||||
Election results by county Ashurst: 40–50% 50–60% 60–70% Kibbey: 50–60% | |||||||||||||||||||||||||||||||||||||
|
Party | Candidate | Votes | % | |
---|---|---|---|---|
Democratic | Henry F. Ashurst (incumbent) | 29,873 | 55.36 | |
Republican | Joseph Henry Kibbey | 21,261 | 39.40 | |
Socialist | W. S. Bradford | 2,827 | 5.24 | |
Majority | 8,612 | 15.96 | ||
Total votes | 53,961 | 100.00 | ||
Democratic hold | ||||
| |||||||||||||||||
County results Kirby: 50–60% 60–70% 70–80% 80–90% Remmel: 50–60% 60–70% | |||||||||||||||||
|
Three-term Democratic Senate President pro tempore James Paul Clarke died October 1, 1916.
Democrat William F. Kirby was elected November 7, 1916, to finish the term. He served only the rest of this term, losing renomination in 1920.
Party | Candidate | Votes | % | |
---|---|---|---|---|
Democratic | William F. Kirby | 110,293 | 69.27 | |
Republican | Harmon L. Remmel | 48,922 | 30.73 | |
Majority | 61,371 | 38.55 | ||
Total votes | 159,215 | 100.00 | ||
Democratic hold | ||||
| |||||||||||||||||||||||||
| |||||||||||||||||||||||||
| |||||||||||||||||||||||||
County results Johnson: 40-50% 50-60% 60-70% 70-80% Patton: 40-50% 50-60% | |||||||||||||||||||||||||
|
Party | Candidate | Votes | % | |
---|---|---|---|---|
Republican | Hiram Johnson | 574,667 | 61.09% | |
Democratic | George S. Patton | 277,852 | 29.54% | |
Socialist | Walter Thomas Mills | 49,341 | 5.25% | |
Prohibition | Marshall W. Atwood | 38,797 | 4.12% | |
Total votes | 907,900 | 100.00% |
| |||||||||||||||||
County results McLean: 40–50% 50–60% | |||||||||||||||||
|
Party | Candidate | Votes | % | ||
---|---|---|---|---|---|
Republican | George P. McLean (inc.) | 107,020 | 50.17% | ||
Democratic | Homer Stille Cummings | 98,649 | 46.24% | ||
Socialist | Martin F. Plunkett | 5,279 | 2.48% | ||
Prohibition | Wilbur G. Manchester | 1,768 | 0.83% | ||
Socialist Labor | Otto Ruckser | 619 | 0.29% | ||
Total votes | 213,335 | 100.00% | |||
Republican hold | |||||
| |||||||||||||||||
County results Wolcott: 40–50% 50–60% | |||||||||||||||||
|
Party | Candidate | Votes | % | |
---|---|---|---|---|
Democratic | Josiah O. Wolcott | 25,434 | 49.67% | |
Republican | Henry A. du Pont (incumbent) | 22,925 | 44.77% | |
Progressive | Hiram R. Burton | 2,361 | 4.61% | |
Socialist | William C. Ferris | 490 | 0.96% | |
Total votes | 51,210 | 100.00% | ||
Democratic gain from Republican | ||||
| |||||||||||||||||
County results Trammell: 60–70% 70–80% 80–90% >90% | |||||||||||||||||
|
Party | Candidate | Votes | % | |
---|---|---|---|---|
Democratic | Park Trammell | 58,391 | 82.86% | |
Republican | William R. O'Neal | 8,774 | 12.45% | |
Socialist | R. L. Goodwin | 3,304 | 4.69% | |
Total votes | 70,469 | 100.00% |
There were two elections held November 7, 1916, due to a vacancy. The elections converted both seats from Democratic to Republican, thus marking the first time since the popular-election of Senators was mandated by the Seventeenth Amendment three years earlier that both Senate seats in a state flipped from one party to the other in a single election cycle.
| |||||||||||||||||
County results Watson: 40–50% 50–60% 60–70% Taggart: 40–50% 50–60% 60–70% | |||||||||||||||||
|
Party | Candidate | Votes | % | |
---|---|---|---|---|
Republican | James Eli Watson | 335,193 | 47.66 | |
Democratic | Thomas Taggart (incumbent) | 325,577 | 46.29 | |
Socialist | Edward Henry | 21,626 | 3.08 | |
Prohibition | William H. Hickman | 16,095 | 2.29 | |
Progressive | John F. Clifford | 4,798 | 0.68 | |
Total votes | 703,289 | 100.00 | ||
Republican gain from Democratic | ||||
Two-term Democrat Benjamin F. Shively was re-elected in 1914 and served until he died March 14, 1916. Democrat Thomas Taggart was appointed by Governor Samuel Ralston on March 20 to continue the term until a November 7, 1916, special election. Taggart lost the special election to Republican James Eli Watson.
Watson would finish out the term, be re-elected twice, and serve until his 1932 re-election loss.
| |||||||||||||||||
County results New: 40–50% 50–60% 60–70% Kern: 40–50% 50–60% 60–70% | |||||||||||||||||
|
Party | Candidate | Votes | % | |
---|---|---|---|---|
Republican | Harry Stewart New | 337,089 | 47.77% | |
Democratic | John W. Kern (incumbent) | 325,588 | 46.14% | |
Socialist | Joseph Zimmerman | 21,558 | 3.06% | |
Prohibition | Elwood Haynes | 15,598 | 2.21% | |
Progressive | John N. Dyer | 4,272 | 0.61% | |
Socialist Labor | Ira J. Decker | 1,562 | 0.22% | |
Total votes | 705,667 | 100.00% | ||
Republican gain from Democratic | ||||
One-term Democrat John W. Kern was elected in 1911. He lost re-election to Republican Harry Stewart New.
New served only until losing renomination in 1922. Kern died on August 17, 1917, the same year he left the U.S Senate.
There were two elections due to a vacancy. Both elections were held September 11, 1916, as Maine routinely held its annual elections in September at the time.
| |||||||||||||||||
County results Fernald: 50–60% 60–70% Sillis: 50–60% | |||||||||||||||||
|
Party | Candidate | Votes | % | |
---|---|---|---|---|
Republican | Bert M. Fernald | 81,369 | 54.27% | |
Democratic | Kenneth C. Sills | 68,201 | 45.49% | |
Prohibition | Frederick A. Shepherd | 348 | 2.29% | |
Others | 11 | 0.01% | ||
Total votes | 149,929 | 100.00% | ||
Republican hold | ||||
One-term Republican Edwin C. Burleigh was elected in 1913, and died June 16, 1916. Republican Bert M. Fernald was elected September 12, 1916, to finish the term.
Fernand would later be re-elected twice and serve until his 1926 death.
| |||||||||||||||||
| |||||||||||||||||
County results Hale: 40–50% 50–60% 60–70% Johnson: 50–60% | |||||||||||||||||
|
Party | Candidate | Votes | % | |
---|---|---|---|---|
Republican | Frederick Hale | 79,481 | 52.72% | |
Democratic | Charles F. Johnson (incumbent) | 69,486 | 46.09% | |
Socialist | James F. Carey | 1,510 | 1.00% | |
Prohibition | Arthur C. Johnson | 279 | 0.19% | |
Write-in | 7 | 0.01% | ||
Total votes | 150,763 | 100.00% |
One-term Democrat Charles Fletcher Johnson was elected in 1911. He lost re-election to Republican Frederick Hale.
Hale would later be re-elected three times and serve until his 1935 retirement.
| |||||||||||||||||
County results France: 40–50% 50–60% Lewis: 40–50% 50–60% 60–70% | |||||||||||||||||
|
Party | Candidate | Votes | % | ±% | |
---|---|---|---|---|---|
Republican | Joseph I. France | 113,662 | 49.32% | 12.34 | |
Democratic | David John Lewis | 109,740 | 47.62% | 9.13 | |
Prohibition | James W. Frizzell | 3,325 | 1.44% | 0.23 | |
Socialist | Sylvester L. Young | 2,590 | 1.12% | 0.29 | |
Labor | Robert E. Long | 1,143 | 0.50% | N/A | |
Total votes | 230,460 | 100.00% |
| |||||||||||||||||
| |||||||||||||||||
County results Lodge: 50–60% 60–70% Fitzgerald: 50–60% | |||||||||||||||||
|
Party | Candidate | Votes | % | |
---|---|---|---|---|
Republican | Henry Cabot Lodge (incumbent) | 267,177 | 51.68% | |
Democratic | John F. Fitzgerald | 234,238 | 45.31% | |
Socialist | William N. McDonald | 15,558 | 3.01% | |
Write-in | All others | 26 | 0.00% | |
Total votes | 516,999 | 100.00% |
| |||||||||||||||||
County results Townsend: 40–50% 50–60% 60–70% 70–80% Price: 40–50% | |||||||||||||||||
|
Party | Candidate | Votes | % | ||
---|---|---|---|---|---|
Republican | Charles E. Townsend (incumbent) | 364,657 | 56.34% | ||
Democratic | Lawrence Price | 257,954 | 39.85% | ||
Socialist | Edward O. Foss | 15,614 | 2.41% | ||
Prohibition | John Y. Johnston | 7,569 | 1.17% | ||
Socialist Labor | Herman Richter | 924 | 0.14% | ||
Independent | Henry Ford (write-in) | 566 | 0.09% | ||
Total votes | 677,284 | 100.00% | |||
Republican hold | |||||
| |||||||||||||||||||||
| |||||||||||||||||||||
County results Kellogg: 30–40% 40–50% 50–60% 60–70% Lawler: 40–50% 50–60% | |||||||||||||||||||||
|
Party | Candidate | Votes | % | |
---|---|---|---|---|
Republican | Frank B. Kellogg | 185,159 | 48.58% | |
Democratic | Daniel W. Lawler | 117,541 | 30.84% | |
Prohibition | W. G. Calderwood | 78,425 | 20.58% | |
Total votes | 381,125 | 100.00% | ||
Majority | 67,618 | 17.74% | ||
Republican hold | ||||
| |||||||||||||||||
|
Party | Candidate | Votes | % | |
---|---|---|---|---|
Democratic | John Sharp Williams (incumbent) | 74,290 | 100% | |
Total votes | 74,290 | 100 | ||
Democratic hold | ||||
| |||||||||||||||||
|
Party | Candidate | Votes | % | |
---|---|---|---|---|
Democratic | James A. Reed (incumbent) | 396,166 | 50.56% | |
Republican | Walter S. Dickey | 371,710 | 47.44% | |
Socialist | Kate Richards O'Hare | 14,654 | 1.87% | |
Socialist Labor | Joseph Scheidler | 962 | 0.12% | |
Total votes | 783,492 | 100.00% |
| |||||||||||||||||||||
|
Party | Candidate | Votes | % | |
---|---|---|---|---|
Democratic | Henry L. Myers (incumbent) | 85,585 | 51.06% | |
Republican | Charles N. Pray | 72,753 | 43.40% | |
Socialist | Henry La Beau | 9,292 | 5.54% | |
Total votes | 167,630 | 100.00% | ||
Democratic hold | ||||
| |||||||||||||||||
County results Hitchcock: 40–50% 50–60% 60–70% Kennedy: 40–50% 50–60% Tie: 40–50% | |||||||||||||||||
|
Party | Candidate | Votes | % | |
---|---|---|---|---|
Democratic | Gilbert Hitchcock (incumbent) | 143,082 | 49.98% | |
Republican | John L. Kennedy | 131,359 | 45.88% | |
Socialist | E. E. Olmstead | 7,425 | 2.59% | |
Prohibition | D. B. Gilbert | 4,429 | 1.55% | |
Total votes | 286,295 | 100.00% | ||
Democratic hold | ||||
| |||||||||||||||||||||||||||||||||||||
County results Pittman: 30–40% 40–50% Platt: 30–40% 40–50% Miller: 30–40% 40–50% | |||||||||||||||||||||||||||||||||||||
|
Party | Candidate | Votes | % | |
---|---|---|---|---|
Democratic | Key Pittman (incumbent) | 12,765 | 38.81% | |
Republican | Samuel Platt | 10,618 | 32.28% | |
Socialist | Ashley Grant Miller | 9,507 | 28.91% | |
Total votes | 32,890 | 100.00% | ||
Democratic hold | ||||
| |||||||||||||||||
| |||||||||||||||||
County results Martine: 40–50% 50–60% Frelinghuysen: 50–60% 60–70% | |||||||||||||||||
|
Party | Candidate | Votes | % | |
---|---|---|---|---|
Republican | Joseph S. Frelinghuysen Sr. | 244,715 | 55.99% | |
Democratic | James E. Martine (incumbent) | 170,019 | 38.90% | |
Socialist | William C. Doughty | 13,358 | 3.06% | |
Prohibition | Livingston Barbour | 7,178 | 0.11% | |
Socialist Labor | Rudolph Katz | 1,826 | 0.42% | |
| |||||||||||||||||
|
Party | Candidate | Votes | % | |
---|---|---|---|---|
Democratic | Andrieus A. Jones | 33,981 | 51.01% | |
Republican | Frank A. Hubbell | 30,609 | 45.95% | |
Socialist | W. P. Metcalf | 2,028 | 3.04% | |
Total votes | 66,618 | 100.00% | ||
Democratic gain from Republican | ||||
| ||||||||||||||||||||
County results Calder: 40-50% 50-60% 60-70% Patton: 40-50% 50-60% | ||||||||||||||||||||
|
Party | Candidate | Votes | % | |
---|---|---|---|---|
Republican | William M. Calder | 839,314 | 54.32% | |
Democratic | William F. McCombs | 605,933 | 39.22% | |
Socialist | Joseph D. Cannon | 61,167 | 3.96% | |
Prohibition | D. Leigh Colvin | 19,302 | 1.25% | |
Progressive | Bainbridge Colby | 15,339 | 0.99% | |
Socialist Labor | August Gillhaus | 4,086 | 0.26% | |
Total votes | 1,545,141 | 100.00% |
| |||||||||||||||||||||||||||||||||||||
County results McCumber: 40–50% 50–60% 60–70% 70–80% 80–90% Burke: 40–50% | |||||||||||||||||||||||||||||||||||||
|
Party | Candidate | Votes | % | |
---|---|---|---|---|
Republican | Porter J. McCumber (incumbent) | 57,714 | 53.85% | |
Democratic | John Burke | 40,988 | 38.24% | |
Socialist | E. R. Fry | 8,472 | 7.91% | |
Total votes | 107,174 | 100.00% | ||
Republican gain from Democratic | ||||
| |||||||||||||||||
County results Pomerene: 40–50% 50–60% 60–70% 70–80% Herrick: 40–50% 50–60% | |||||||||||||||||
|
Party | Candidate | Votes | % | |
---|---|---|---|---|
Democratic | Atlee Pomerene (incumbent) | 571,488 | 49.26% | |
Republican | Myron Herrick | 535,391 | 46.15% | |
Socialist | C. E. Ruthenberg | 38,186 | 3.29% | |
Prohibition | Aaron S. Watkins | 12,060 | 1.04% | |
Independent | Jacob Coxey | 2,965 | 0.26% | |
Total votes | 1,160,091 | 100.00% | ||
Democratic hold | ||||
| |||||||||||||||||
|
Party | Candidate | Votes | % | |
---|---|---|---|---|
Republican | Philander C. Knox | 680,451 | 56.31 | |
Democratic | Ellis L. Orvis | 450,112 | 37.25 | |
Socialist | Charles W. Ervin | 45,385 | 3.76 | |
Prohibition | Herbert T. Ames | 30,089 | 2.49 | |
Single Tax | Robert Colvin Macauley, Jr. | 1,387 | 0.12 | |
Socialist Labor | William H. Thomas | 1,022 | 0.09 | |
Total votes | 1,208,446 | 100.00 |
| |||||||||||||||||
|
Party | Candidate | Votes | % | ||
---|---|---|---|---|---|
Democratic | Peter G. Gerry | 47,048 | 52.94% | ||
Republican | Henry F. Lippitt (incumbent) | 39,211 | 44.12% | ||
Socialist | Frederick W. Hurst | 1,996 | 2.25% | ||
Prohibition | Frank J. Sibley | 454 | 0.51% | ||
Socialist Labor | Peter McDermott | 168 | 0.19% | ||
Total votes | 88,877 | 100.00% | |||
Democratic gain from Republican |
| |||||||||||||||||
|
Party | Candidate | Votes | % | ||
---|---|---|---|---|---|
Democratic | Kenneth McKellar (incumbent) | 143,718 | 54.42% | ||
Republican | Ben W. Hooper | 118,174 | 44.75% | ||
Socialist | H. H. Magnum | 2,193 | 0.83% | ||
Total votes | 264,085 | 100.00% | |||
Democratic hold | |||||
| |||||||||||||||||
County Results [63] Culberson: 50–60% 60–70% 70–80% 80–90% >90% | |||||||||||||||||
|
Party | Candidate | Votes | % | |
---|---|---|---|---|
Democratic | Charles A. Culberson (incumbent) | 303,035 | 81.30% | |
Republican | Alex W. Atcheson | 48,788 | 13.09% | |
Socialist | F. A. Hickey | 18,616 | 4.99% | |
Prohibition | F. H. Combeau | 2,319 | 0.62% | |
Total votes | 372,758 | 100.00% | ||
Democratic hold | ||||
| |||||||||||||||||
|
Party | Candidate | Votes | % | |
---|---|---|---|---|
Democratic | William H. King | 81,057 | 56.92% | |
Republican | George Sutherland (incumbent) | 56,862 | 39.93% | |
Socialist | Christian Poulson | 4,497 | 3.16% | |
Democratic gain from Republican | ||||
| |||||||||||||||||
| |||||||||||||||||
|
Party | Candidate | Votes | % | ±% | |
---|---|---|---|---|---|
Republican | Carroll S. Page (inc.) | 47,362 | 74.4 | ||
Democratic | Oscar C. Miller | 14,956 | 23.5 | ||
Socialist | Norman E. Greenslet | 1,336 | 2.1 | ||
Total votes | 63,654 | 100 |
The 1916 United States Senate election in Vermont took place on November 7, 1916. [68] It was the second direct election for the U.S. Senate to take place in Vermont following the ratification of the Seventeenth Amendment to the United States Constitution and the first for Vermont's Class I seat. The incumbent, Republican Carroll S. Page successfully ran for re-election to a second full term. [69]
In the primary election, which was held on September 11, Page gained re-nomination by winning 62 percent of the vote to defeat former governor Allen M. Fletcher (20.3) and current governor Charles W. Gates (17.7). [70]
With the Republican Party dominant in Vermont, as it had been since its founding in the 1850s, Democratic candidate Oscar C. Miller was little more than a token opponent for Page. [71] In the general election, Page defeated Miller 74.4 percent to 23.5. [69]
| |||||||||||||||||
|
Party | Candidate | Votes | % | |
---|---|---|---|---|
Democratic | Claude A. Swanson (incumbent) | 133,061 | 100.00 | |
Total votes | 133,061 | 100.00 | ||
Democratic hold | ||||
| |||||||||||||||||||||||||||||||||||||
| |||||||||||||||||||||||||||||||||||||
County results Poindexter: 40–50% 50–60% 60–70% Turner: 40–50% 50–60% | |||||||||||||||||||||||||||||||||||||
|
Party | Candidate | Votes | % | |
---|---|---|---|---|
Republican | Miles Poindexter (incumbent) | 202,287 | 55.39 | |
Democratic | George Turner | 135,339 | 37.06 | |
Socialist | Bruce Rogers | 21,709 | 5.95 | |
Prohibition | Joseph A. Campbell | 4,411 | 1.21 | |
Progressive | Walter J. Thompson | 1,442 | 0.40 | |
Majority | 66,948 | 18.33 | ||
Total votes | 365,188 | 100.00 | ||
Republican hold | ||||
| |||||||||||||||||
|
Party | Candidate | Votes | % | |
---|---|---|---|---|
Republican | Howard Sutherland | 144,243 | 50.14 | |
Democratic | William E. Chilton (incumbent) | 138,585 | 48.17 | |
Socialist | G. A. Gneiser | 4,881 | 1.70 | |
Majority | 5,658 | 1.97 | ||
Total votes | 287,709 | 100.00 | ||
Republican gain from Democratic | ||||
| |||||||||||||||||||||
| |||||||||||||||||||||
County results La Follette: 40–50% 50–60% 60–70% 70–80% 80–90% Wolfe: 40–50% 50–60% | |||||||||||||||||||||
|
Party | Candidate | Votes | % | |
---|---|---|---|---|
Republican | Robert M. La Follette (incumbent) | 249,906 | 59.23 | |
Democratic | William F. Wolfe | 134,611 | 31.90 | |
Socialist | Richard Elsner | 28,908 | 6.85 | |
Prohibition | Charles L. Hill | 8,528 | 2.02 | |
Majority | 115,295 | 27.32 | ||
Total votes | 421,953 | 100.00 | ||
Republican hold | ||||
| |||||||||||||||||
|
Party | Candidate | Votes | % | |
---|---|---|---|---|
Democratic | John B. Kendrick | 26,324 | 51.47 | |
Republican | Clarence D. Clark (incumbent) | 23,258 | 45.47 | |
Socialist | Paul L. Paulsen | 1,334 | 2.61 | |
Prohibition | Arthur B. Campbell | 231 | 0.45 | |
Majority | 3,066 | 5.99 | ||
Total votes | 51,147 | 100.00 | ||
Democratic gain from Republican | ||||
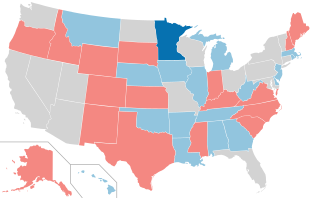
The 1990 United States Senate elections were held on Tuesday, November 6, 1990, with the 33 seats of Class 2 contested in regular elections. Special elections were also held to fill vacancies. The Democratic Party increased its majority with a net gain of one seat from the Republican Party. The election cycle took place in the middle of President George H. W. Bush's term, and, as with most other midterm elections, the party not holding the presidency gained seats in Congress. This was the last election cycle until 2022 where only one U.S. Senate seat flipped parties.
The 1988 United States Senate elections were elections for the United States Senate. Held on November 8, the 33 seats of Class 1 were contested in regular elections. In spite of the Republican victory by George H. W. Bush in the presidential election, the Democrats gained a net of one seat in the Senate. Seven seats changed parties, with four incumbents being defeated. The Democratic majority in the Senate increased by one to 55–to–45.
The 1986 United States Senate elections were elections for the United States Senate. Held on November 4, in the middle of Ronald Reagan's second presidential term, the 34 seats of Class 3 were contested in regular elections. The Republicans had to defend an unusually large number of freshman Senate incumbents who had been elected on President Ronald Reagan's coattails in 1980. Democrats won a net of eight seats, defeating seven freshman incumbents, picking up two Republican-held open seats, and regaining control of the Senate for the first time since January 1981. This remains the most recent midterm election cycle in which the sitting president's party suffered net losses while still flipping a Senate seat.
The 1980 United States Senate elections were held on November 4, coinciding with Ronald Reagan's victory in the presidential election. The 34 Senate seats of Class 3 were contested in regular elections. Reagan's large margin of victory over incumbent Jimmy Carter gave a huge boost to Republican Senate candidates, allowing them to flip 12 Democratic seats and win control of the chamber for the first time since the end of the 83rd Congress in January 1955.
The 1978 United States Senate elections were held on November 7, in the middle of Democratic President Jimmy Carter's term. The 33 seats of Class 2 were contested in regular elections. Special elections were also held to fill vacancies.
The 1976 United States Senate elections was an election for the United States Senate. Held on November 2, the 33 seats of Class 1 were contested in regular elections. They coincided with Democrat Jimmy Carter's presidential election and the United States Bicentennial celebration. Although almost half of the seats decided in this election changed parties, Carter's narrow victory did not provide coattails for the Democratic Party. Each party flipped seven Senate seats, although, one of the seats flipped by Democrats was previously held by a Conservative.
The 1972 United States Senate elections were held on November 7, with the 33 seats of Class 2 contested in regular elections. They coincided with the landslide re-election of Republican President Richard Nixon. Despite Nixon's landslide victory, Democrats increased their majority by two seats. The Democrats picked up open seats in Kentucky and South Dakota, and defeated four incumbent senators: Gordon Allott of Colorado, J. Caleb Boggs of Delaware, Jack Miller of Iowa, and Margaret Chase Smith of Maine. The Republicans picked up open seats in New Mexico, North Carolina, and Oklahoma, and defeated one incumbent, William B. Spong Jr. of Virginia.
The 1958 United States Senate elections were elections for the United States Senate which occurred in the middle of President Dwight D. Eisenhower's second term. Thirty-two seats of Class 1 were contested in regular elections, the new state of Alaska held its first Senate elections for its Class 2 and 3 seats, and two special elections were held to fill vacancies.
The 1952 United States Senate elections was an election for the United States Senate which coincided with the election of Dwight D. Eisenhower to the presidency by a large margin. The 32 Senate seats of Class 1 were contested in regular elections, and three special elections were held to fill vacancies. The Republicans took control of the Senate by managing to make a net gain of two seats. However, Wayne Morse (R-OR) became an independent forcing Republicans to rely on Vice President Richard Nixon's tie-breaking vote, although Republicans maintained a 48–47–1 plurality. Throughout the next Congress, Republicans were able to restore their 49–46–1 majority. This was the third time, as well as second consecutive, in which a sitting Senate leader lost his seat.
The 1950 United States Senate elections occurred in the middle of Harry S. Truman's second term as president. The 32 seats of Class 3 were contested in regular elections, and four special elections were held to fill vacancies. As with most 20th-century second-term midterms, the party not holding the presidency made significant gains. The Republican opposition made a net gain of five seats, taking advantage of the Democratic administration's declining popularity during the Cold War and the aftermath of the Recession of 1949. The Democrats held a narrow 49-to-47-seat majority after the election. This was the first time since 1932 that the Senate majority leader lost his seat, and the only instance of the majority leader losing his seat while his party retained the majority.
The 1946 United States Senate elections were held November 5, 1946, in the middle of Democratic President Harry S. Truman's first term after Roosevelt's passing. The 32 seats of Class 1 were contested in regular elections, and four special elections were held to fill vacancies. The Republicans took control of the Senate by picking up twelve seats, mostly from the Democrats. This was the first time since 1932 that the Republicans had held the Senate, recovering from a low of 16 seats following the 1936 Senate elections.
The 1936 United States Senate elections coincided with the reelection of President Franklin D. Roosevelt. The 32 seats of Class 2 were contested in regular elections, and special elections were held to fill vacancies. The Great Depression continued and voters backed progressive candidates favoring Roosevelt's New Deal in races across the country. The Democrats gained 5 net seats during the election, and in combination with Democratic and Farmer–Labor interim appointments and the defection of George W. Norris from the Republican Party to become independent, the Republicans were reduced to 16 seats. Democrats gained a further two seats due to mid-term vacancies. The Democrats' 77 seats and their 62-seat majority remain their largest in history.
The 1934 United States Senate elections were held in the middle of Democratic President Franklin D. Roosevelt's first term. The 32 seats of Class 1 were contested in regular elections, and special elections were held to fill vacancies. During the Great Depression, voters strongly backed Roosevelt's New Deal and his allies in the Senate, with Democrats picking up a net of nine seats, giving them a supermajority. Republicans later lost three more seats due to mid-term vacancies ; however, a Democrat in Iowa died and the seat remained vacant until the next election. The Democrats entered the next election with a 70-22-2-1 majority.
The 1932 United States Senate elections coincided with Democrat Franklin D. Roosevelt's landslide victory over incumbent Herbert Hoover in the presidential election. The 32 seats of Class 3 were contested in regular elections, and special elections were held to fill vacancies.
The 1930 United States Senate elections occurred in the middle of Republican President Herbert Hoover's term. The 32 seats of Class 2 were contested in regular elections, and special elections were held to fill vacancies. With the Great Depression beginning to take hold, Republican incumbents became unpopular, and Democrats picked up a net of eight seats, erasing the Republican gains from the previous election cycle, however, Republicans retained control of the chamber. This was the first of four consecutive Senate elections during the Depression in which Democrats made enormous gains, achieving a cumulative pick-up of 34 seats.
1916 United States House of Representatives elections were elections for the United States House of Representatives to elect members to serve in the 65th United States Congress. They were held for the most part on November 7, 1916, while Maine held theirs on September 11. They coincided with the re-election of President Woodrow Wilson.
The 1882 United States House of Representatives elections were held for the most part on November 7, 1882, with five states holding theirs early between June and October. They occurred during President Chester A. Arthur's term. Elections were held for 325 seats of the United States House of Representatives, representing 38 states, to serve in the 48th United States Congress. They were the first elections after reapportionment following the 1880 United States census, increasing the size of the House. Special elections were also held throughout the year.
The 1834–35 United States House of Representatives elections were held on various dates in various states between July 7, 1834, and November 5, 1835. Each state set its own date for its elections to the House of Representatives before the first session of the 24th United States Congress convened on December 7, 1835. They were held during President Andrew Jackson's second term. Elections were held for 240 seats that represented 24 states, as well as the at-large-district seat for the pending new state of Michigan.
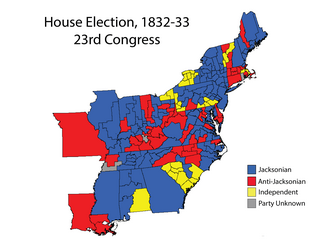
The 1832–33 United States House of Representatives elections were held on various dates in various states between July 2, 1832, and October 7, 1833. Each state set its own date for its elections to the House of Representatives before the first session of the 23rd United States Congress convened on December 2, 1833. They were held concurrently with the 1832 presidential election, in which Democrat Andrew Jackson was re-elected. The congressional reapportionment based on the 1830 United States census increased the size of the House to 240 seats.
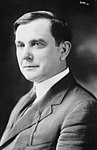
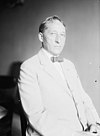
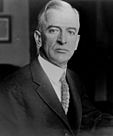
The 1916 United States Senate election in Indiana took place on November 7, 1916. Incumbent Democratic U.S. Senator and Senate Majority Leader John W. Kern ran for re-election to a second term in office, he was defeated by Republican Harry New, a former Chairman of the Republican National Committee.