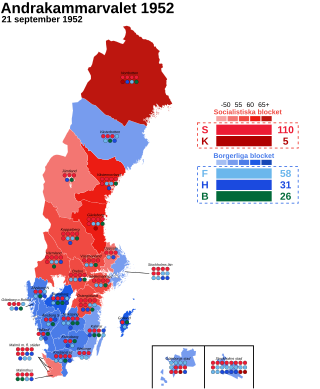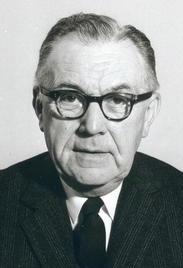
General elections were held in Sweden on 21 September 1952. The Social Democrats remained the largest party with 110 of the 230 seats in the Andra kammaren of the Riksdag and together with the Communist Party of Sweden they got 115 seats and the other parties 115 seats. Tage Erlander and his Social Democratic Party did however form his second government with the Farmers' League already in 1951 and together with that party the Social Democrats now had a majority of 136 seats in the chamber and together with the Communists 141 seats. In the other indirectly elected chamber the Social Democrats had an absolute majority.

General elections were held in Sweden on 16 September 1956. The Swedish Social Democratic Party remained the largest party, winning 106 of the 231 seats in the Andra kammaren of the Riksdag. A Social Democratic-Farmers' League coalition government was formed by Prime Minister Tage Erlander after the election with 125 of the total of 231 seats. Although the non-socialist parties held a majority in the Second Chamber, the Social Democrats held a majority in the First Chamber, so a non-socialist government could not be formed.

General elections were held in Sweden on 15 September 1968. Held in the wake of the crushing of the Prague spring, it resulted in a landslide victory for the Social Democratic government and Prime Minister Tage Erlander. It is one of two general elections in Swedish history where a single party received more than half of the vote. Erlander would resign the following year after an uninterrupted tenure of 23 years as head of government.

General elections were held in Luxembourg on 13 June 1999, alongside European Parliament elections. The Christian Social People's Party remained the largest party, winning 19 of the 60 seats in the Chamber of Deputies. It formed a coalition government with the Democratic Party.
General elections were held in Luxembourg on 15 December 1968. The Christian Social People's Party (CSV) remained the largest party, winning 21 of the 56 seats in the Chamber of Deputies.
General elections were held in Luxembourg on 26 May 1974. The Christian Social People's Party remained the largest party, winning 18 of the 59 seats in the Chamber of Deputies. However, it went into opposition as the Luxembourg Socialist Workers' Party and Democratic Party formed a coalition government under prime minister Gaston Thorn.
General elections were held in Luxembourg on 10 June 1979. The Christian Social People's Party remained the largest party, winning 24 of the 59 seats in the Chamber of Deputies. After spending the previous four years in opposition, it returned to government in coalition with the Democratic Party, resulting in the Werner-Thorn Ministry.
General elections were held in Luxembourg on 17 June 1984. The Christian Social People's Party remained the largest party, winning 25 of the 64 seats in the Chamber of Deputies. It formed a coalition government with the Luxembourg Socialist Workers' Party, the Santer-Poos government.
General elections were held in Luxembourg on 18 June 1989. The Christian Social People's Party remained the largest party, winning 22 of the 60 seats in the Chamber of Deputies. It continued the coalition government with the Luxembourg Socialist Workers' Party.

General elections were held in Sweden between 19 and 21 September 1924. The Swedish Social Democratic Party remained the largest party, winning 104 of the 230 seats in the Second Chamber of the Riksdag.

General elections were held in Belgium on 17 February 1946. The result was a victory for the Christian Social Party, which won 92 of the 202 seats in the Chamber of Representatives and 51 of the 101 seats in the Senate. Voter turnout was 90.3%.

General elections were held in Belgium on 26 June 1949. Several reforms took effect prior to the elections; they were the first after the introduction of universal women's suffrage; the number of seats in the Chamber of Representatives was increased from 202 to 212, and from now on, elections for the nine provincial councils were held simultaneously with parliamentary elections. The number of Chamber seats and the simultaneous provincial and parliamentary elections would remain unchanged until state reforms in 1993.

General elections were held in Belgium on 4 June 1950. The result was a victory for the Christian Social Party, which won 108 of the 212 seats in the Chamber of Representatives and 54 of the 106 seats in the Senate. Voter turnout was 92.6%. This election was the last one in Belgian history where a single party achieved an absolute majority. Elections for the nine provincial councils were also held.

General elections were held in Belgium on 11 April 1954. The dominant Christian Social Party won 95 of the 212 seats in the Chamber of Representatives and 49 of the 106 seats in the Senate. Voter turnout was 93.2%. Elections for the nine provincial councils were also held.

General elections were held in Belgium on 1 June 1958. The result was a victory for the Christian Social Party, which won 104 of the 212 seats in the Chamber of Representatives and 53 of the 106 seats in the Senate. Voter turnout was 93.6% in the Chamber election and 93.7% in the Senate election. Elections for the nine provincial councils were also held.

General elections were held in Belgium on 26 March 1961. The result was a victory for the Christian Social Party, which won 96 of the 212 seats in the Chamber of Representatives and 47 of the 106 seats in the Senate. Voter turnout was 92.3%. Elections for the nine provincial councils were also held.

General elections were held in Belgium on 23 May 1965. The result was a victory for the Christian Social Party, which won 77 of the 212 seats in the Chamber of Representatives and 44 of the 106 seats in the Senate. Voter turnout was 91.6%. Elections for the nine provincial councils were also held.

General elections were held in Belgium on 20 November 1921. The result was a victory for the Catholic Party, which won 70 of the 186 seats in the Chamber of Representatives. Voter turnout was 91.1% in the Chamber election and 91.0% in the Senate election.

General elections were held in Belgium on 5 April 1925. The result was a victory for the Belgian Labour Party, which won 78 of the 187 seats in the Chamber of Representatives. Voter turnout was 92.8% in the Chamber election and 92.7% in the Senate election.
General elections were held in Italy on 6 November 1904, with a second round of voting on 13 November. The "ministerial" left-wing bloc remained the largest in Parliament, winning 339 of the 508 seats. The papal ban on Catholics voting was relaxed for the first time, and three Catholics were elected.


