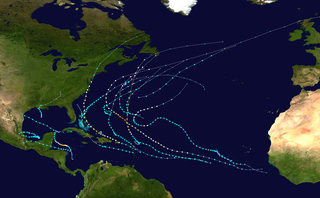
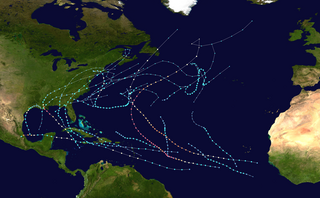
The 2010 Atlantic hurricane season was the first of three consecutive very active Atlantic hurricane seasons, each with 19named storms. This above average activity included 12hurricanes, equaling the number that formed in 1969. Only the 2020 and 2005 seasons have had more, at 14 and 15 hurricanes respectively. Despite the high number of hurricanes, not one hurricane hit the United States making the season the only season with 10 or more hurricanes without a United States landfall. The overall tropical cyclone count in the Atlantic exceeded that in the West Pacific for only the second time on record. The season officially began on June1 and ended on November30, dates that conventionally delimit the period during each year when tropical cyclone formation is most likely. The first cyclone, Alex intensified into the first June hurricane since Allison in 1995. The month of September featured eight named storms. October featured five hurricanes, including Tomas, which became the latest on record in a calendar year to move through the Windward Islands. Activity was represented with an accumulated cyclone energy (ACE) value of 165units, which was the eleventh highest value on record at the time. The activity in 2010 was heightened due to a very strong La Niña, which also led to an inactive Pacific hurricane season.
Numerous tropical cyclones affected countries bordering the Atlantic Ocean throughout 2010. Alex caused 52deaths and up to $1.52billion (2010 USD) in damage as it struck northern Mexico in June. The next month, Tropical Storm Bonnie struck Florida as a weak cyclone, leaving one dead. Tropical Storm Colin led to one drowning death, and rip currents produced by Tropical Depression Five killed two people. Hurricane Danielle passed east of Bermuda while Earl moved parallel to the East Coast of the United States and into Nova Scotia throughout late August, resulting in 2 and 8 deaths, respectively. In early September, Tropical Storm Hermine caused significant flooding across Texas and killed 8 people. The strongest hurricane of the year, Igor, killed four as it traversed the Atlantic and across Newfoundland. Latin America was badly hit by Hurricane Karl and Tropical Storm Matthew, with 22 and 126deaths, respectively. In late September, Tropical Storm Nicole produced torrential rainfall from the Caribbean into the U.S. East Coast, resulting in 16fatalities. Hurricane Paula caused a tourist to drown offshore Cozumel in mid-October, while Hurricane Richard left two dead in Belize later that month. The season concluded with Tomas which caused 35 fatalities along its track through the Caribbean and into the Atlantic.
Seasonal forecasts
Predictions of tropical activity in the 2010 season
* June–November only † Most recent of several such occurrences. (See all)
Before and during each hurricane season, several forecasts of hurricane activity are issued by national meteorological services, scientific agencies, and noted hurricane experts. The forecasts include weekly and monthly changes in significant factors that help determine the number of tropical storms, hurricanes, and major hurricanes within a particular year. According to NOAA, the average Atlantic hurricane season between 1950 and 2005 contained 10.3 tropical storms, 6.2 hurricanes, 2.7 major hurricanes, and an accumulated cyclone energy (ACE) index of 66–103 units. Broadly speaking, ACE is a measure of the power of a tropical or subtropical storm multiplied by the length of time it existed. Therefore, a storm with a longer duration will have high values of ACE. It is only calculated for full advisories on specific tropical and subtropical systems reaching or exceeding wind speeds of 39mph (63km/h). Accordingly, tropical depressions are not included in the count. After the storm has dissipated, typically after the end of the season, the NHC re-examines the data and produces a final report on each storm. These revisions can lead to a revised ACE total either upward or downward compared to the original value.[26] The National Oceanic and Atmospheric Administration (NOAA) typically categorizes a season as either above-average, average, or below-average based on the cumulative ACE Index, but the number of tropical storms, hurricanes, and major hurricanes within a hurricane season are occasionally considered as well.[1]
Pre-season forecasts
On December7, 2009, Tropical Storm Risk (TSR) issued their first extended range outlook for the 2010 Atlantic hurricane season, predicting 13.9 named storms, 7.4 hurricanes, 3.4 major hurricanes, and an ACE index of 135 units. The organization referenced two main factors, slower trade winds across the Caribbean and above-average ocean temperatures across the Atlantic, for an above-average season.[3] Two days later, Colorado State University (CSU) issued their first extended range outlook, projecting 11 to 16 named storms, 6 to 8 hurricanes, 3 to 5 major hurricanes, and an ACE index of 100 to 162 units. The organization stated that although a strong El Niño event was ongoing at the release of their forecast, a continuation of a warm El Niño–Southern Oscillation was unlikely to persist through the hurricane season.[4] On January27, 2010, The Weather Company (formerly WSI) called for the year to feature 13 named storms, 7 hurricanes, and 3 major hurricanes.[5]
CSU issued a more detailed update on April7, upping their forecast to 15 named storms, 8 hurricanes, 4 major hurricanes, and an ACE index of 150. More confidence in the weakening of El Niño (and thus lower vertical wind shear) and the continuation of anomalously warm sea surface temperatures across the Atlantic Ocean were cited.[6] Two days later, TSR revised their forecast upward to 16.3 named storms, 8.5 hurricanes, 4 major hurricanes, and an ACE index of 159 units.[7] In their April21 update, WSI predicted the most active year since the record-breaking 2005 season, with 16 named storms, 9 hurricanes, and 5 major hurricanes.[8] Five days later, North Carolina State University (NCSU) released their only forecast for the season, with 15 to 18 named storms and 8 to 11 hurricanes.[9] TSR largely maintained their forecast for their May25 release.[10] The next day, TWC/WSI again raised their forecast to 18 named storms, 10 hurricanes, and 5 major hurricanes.[11] NOAA, meanwhile, released their forecast prediction for the 2010 season on May27. The organization called for an active to extremely active year including 14 to 23 named storms, 8 to 14 hurricanes, and 3 to 7 major hurricanes, referencing a continuation of the active era that began in 1995.[12]
Mid-season outlooks
On the first day of the 2010 Atlantic season, Florida State University's Center for Ocean-Atmospheric Prediction Studies (FSU) released their only predictions, forecasting 17 named storms, 10 hurricanes, and an ACE index of 156 units.[13] The next day, CSU upped their forecast to 18 named storms, 10 hurricanes, and 5 major hurricanes.[14] On June4, TSR followed suit, with 17.7 named storms, 9.5 hurricanes, 4.4 major hurricanes, and an ACE index of 182 units.[15] The United Kingdom's Met Office (UKMET) released their only prediction for the season on June17, with the most likely number of tropical storms being 20 and the most likely value of the ACE index being 204 units.[16] On June23, TWC/WSI once again upped their forecast, noting 20 named storms, 11 hurricanes, and 5 major hurricanes.[17] TSR issued their boldest predictions on July6, with 19.1 named storms, 10.4 hurricanes, 4.8 major hurricanes, and an ACE index of 203 units.[18]
Following a slightly less active June and July than originally anticipated, TWC/WSI downgraded their number of named storms from 20 to 19 on July21, but kept their June numbers of 11 hurricanes and 5 major hurricanes untouched.[19] In their final seasonal prediction on August4, CSU left their June numbers the same, predicting 18 named storms, 10 hurricanes, 5 major hurricanes, and an ACE index of 185 units.[20] That same day, TSR reduced their predictions for their final seasonal outlook, expecting 17.8 named storms, 9.7 hurricanes, 4.5 major hurricanes, and an ACE index of 183 units.[21] On August5, NOAA announced the official development of La Niña in their last seasonal outlook. The organization lowered the upper bounds of their forecast compared to May due to less early season activity than expected, in all predicting 14 to 20 named storms, 8 to 12 hurricanes, and 4 to 6 major hurricanes.[22] TWC/WSI issued two final forecasts on August25 and September22, both expecting 18 named storms and 10 hurricanes. The number of major hurricanes was increased from 5 to 6 in their September update, however.[23][24]
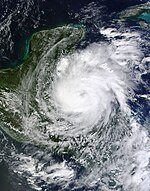
Satellite image of three simultaneous tropical cyclones on September 16, with Karl(left), Igor(center), and Julia(right). All were hurricanes at the time.
Unlike on the eastern Pacific, which tied 1977 for the least active year in the reliable records, the 2010 Atlantic hurricane season ended as one of the most active in recorded history. It began on June1 and ended on November30, dates that conventionally delimit the period during each year when most tropical cyclones form in the Atlantic Ocean. The first system of the season, Hurricane Alex, developed on June25; the final system of the season, Hurricane Tomas, dissipated on November7. A total of 21 tropical depressions formed within the basin, of which 19 intensified into tropical storms, 12 intensified into hurricanes, and 5 further intensified into major hurricanes. The year's 12 hurricanes matched 1969 for the third highest count on record, exceeded only by 2005 and 2020.[27][28] There were more tropical storms in the Atlantic than the West Pacific in 2010, the second such occurrence on record after 2005. Throughout the entire Atlantic tropical cyclone database, 2010 is the only year with more than 10 hurricanes not to feature a hurricane landfall on the United States.[29]
Several factors contributed to exceptional activity. A strong El Niño observed in 2009 rapidly transitioned into a strong La Niña by mid-summer 2010, projecting anomalously low vertical wind shear across the Atlantic Ocean. Ocean temperatures reached record levels across the basin, averaging at 0.82°C above the 1981–2010 average. Not only did ocean temperatures surpass 2005 to break the record overall, averaged water temperatures across the Main Development Region (MDR) of the Atlantic set monthly records from February to October 2010. This was aided by a strongly negative North Atlantic Oscillation that contributed to weaker trade winds and thus anomalous warming of ocean temperatures in the months leading up to the hurricane season. Lower sea level pressures were prevalent throughout much of the season, trailing only 1955 for the lowest average values across the MDR during the August to October period. In spite of the high number of tropical cyclones, mid-level dry air dominated the tropical Atlantic throughout the peak of the season, perhaps hindering the season from being even more active.[30]
The beginning of the Atlantic season featured Alex, the first hurricane observed in June since Hurricane Allison in 1995.[31] One tropical storm, Bonnie, and a tropical depression formed in the month of July.[32] August featured five cyclones – a tropical depression, tropical storms Colin and Fiona, as well as hurricanes Danielle and Earl (both of which further intensified into major hurricanes).[33] September, the peak period of the Atlantic hurricane season, was its most active month, featuring eight tropical cyclones: tropical storms Gaston, Hermine, Matthew, and Nicole, as well as hurricanes Igor, Julia, Karl, and Lisa. This put the season into a tie with 2002 and 2007 for the most tropical storms to develop in September, a record that stood until it was surpassed in 2020.[34] Igor attained peak winds of 155mph (250km/h) on September15, cementing its status as the most intense storm of the season.[35] Well above-average activity continued into October, with the formation of hurricanes Otto, Paula, Richard, Shary, and Tomas, one hurricane short of the monthly record set in 1870.[36] Tomas persisted into the subsequent month before dissipating on November7, heralding the end of the season's tropical cyclone activity.[37]
The season's activity was reflected with an ACE rating of approximately 165 units, the highest since 2005.[38]
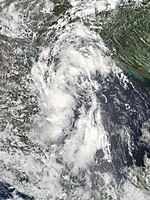
A disturbance developed within the Intertropical Convergence Zone on June17 and remained well defined as it tracked westward. An area of low pressure developed in association with the system over the northwestern Caribbean on June24 and further organized into a tropical depression by 18:00UTC the following day, supported by data from a reconnaissance aircraft. Steered west and eventually west-northwest by an expansive ridge across the Bahamas and Gulf of Mexico, the depression intensified into Tropical Storm Alex at 06:00UTC on June26 and attained an initial peak with winds of 65mph (105km/h) before moving ashore near Belize City, Belize several hours later. Alex maintained tropical storm intensity as it crossed the Yucatán Peninsula, and upon executing a northward turn and a second westward turn began to steadily intensify. The cyclone intensified into the season's first hurricane at 00:00UTC on June30 and attained peak winds of 110mph (175km/h) as it made landfall near Soto la Marina, Mexico, at 02:00UTC on July1. Once inland, Alex turned west-southwest and rapidly weakened over the mountainous terrain of Mexico. The increasingly disrupted system dissipated at 06:00UTC on July2.[39]
The precursor disturbance to Alex flooded hundreds of homes and prompted the evacuation of thousands of residents in the Dominican Republic.[40] Damage to crops and hundreds of structures occurred across Central America.[41] In southern Mexico, torrential rainfall led to numerous landslides and mudslides, while swollen rivers flooded many homes and roads were collapsed.[42] Near the track of Alex in northern Mexico, rainfall reached as high as 35.04in (890mm) in Monterrey,[43]13-foot (4.0m) waves affected the coastline,[44] hundreds of thousands of citizens lost power,[45] and widespread infrastructure was damaged or destroyed.[46] Although the hurricane did not directly move ashore the coastline of the United States, its spiral bands produced tropical storm-force sustained winds across the southern reaches of Texas, peaking at 51mph (82km/h) in Port Isabel.[47] Heavy rainfall broke accumulation records,[43] a storm surge of at least 3.5ft (1.5m) caused beach erosion,[48] and embedded supercells produced nine tornadoes (all rated EF0).[39] Along its track, Alex was responsible for 51 deaths (22 missing) and $1.52 billion in damage.[49]
A tropical wave emerged off the western coast of Africa on June24, eventually emerging into the Gulf of Mexico on July7. An area of low pressure became discernible, and with data from a reconnaissance aircraft, the system was upgraded to a tropical depression by 00:00UTC on July8. The depression failed to organize appreciably as it tracked west to west-northwest, moving ashore South Padre Island, Texas with winds of 35mph (55km/h) by 14:00UTC that day. The depression degenerated into a remnant low by 06:00UTC on July9 and dissipated over northern Mexico a day later.[50]
In advance of landfall, the NHC issued a tropical storm warning from Baffin Bay, Texas to Rio San Fernando, Mexico; this was canceled once the storm failed to intensify.[50] The Servicio Meteorológico Nacional warned residents of gusty winds and heavy rainfall in excess of 4–8in (100–200mm) capable of producing localized flooding and mudslides.[51] Upon moving ashore, the depression produced a storm surge of 2–4ft (0.61–1.22m) along the southern coastline of Texas.[52] Rainfall accumulations peaked at 5.16in (131mm) along the Guadalupe River, with lesser amounts elsewhere, including across areas affected by Hurricane Alex a week prior.[43][53]
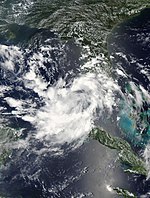
A tropical wave emerged off the western coast of Africa on July10. Once north of the Greater Antilles, convective growth and the development of a well-defined surface low led to the formation of a tropical depression just south of Acklins Island by 06:00UTC on July22. Amid a brief reprieve in strong upper-level winds, the depression intensified into Tropical Storm Bonnie as it crossed Ragged Island around 23:15UTC that day. It later traversed Andros Island at peak intensity, with sustained winds of 45mph (70km/h), and weakened slightly before moving ashore near Elliott Key, Florida, with winds of 40mph (65km/h) on July23. Bonnie weakened to a tropical depression as it crossed South Florida, and the persistent effects of strong wind shear prevented intensification in the Gulf of Mexico. The cyclone degenerated into a remnant low by 00:00UTC on July25 and later moved into southeastern Louisiana before dissipating later that day.[54]
The precursor disturbance to Bonnie produced rainfall up to 4in (100mm) in the Dominican Republic, isolating towns due to bridge collapses and prompting the evacuation of thousands of residents. In nearby Puerto Rico, one person drowned in a swollen river.[55] Upon designation, tropical storm watches and warnings were issued along portions of the Florida coastline.[54] Approximately 14,000 Florida customers lost power as Bonnie moved ashore. Minimal tropical storm-force winds affected Virginia Key, where a storm surge of 0.92ft (0.28m) was also reported, and rainfall up to 3.25in (83mm) across Miami-Dade County caused urban flooding.[56] Despite degenerating into a remnant low, Bonnie produced more substantial rainfall totals across Louisiana and Mississippi, officially peaking at 5.75in (146mm) in Tylertown.[57] Radar estimates of 8–9in (200–230mm) of rain prompted flash flooding which washed out more than 20 roads and bridges in Washington Parish,[58] while about 110 homes were flooded in West Baton Rouge Parish.[59] Remnant moisture combined with a cold front to produce damaging severe thunderstorms across portions of the Southeast in late July.[60]
The interaction of two tropical waves and an upper-level trough led to the development of a tropical depression over the central Atlantic by 12:00UTC on August2. The depression steadily organized after formation, intensifying into Tropical Storm Colin by 06:00UTC on August3. An abnormally strong ridge to the storm's north steered Colin to the west-northwest; reaching a forward speed up to 30mph (50km/h), the system was unable to maintain a closed circulation and instead degenerated into a trough by 18:00UTC that day. Over the coming days, the trough decelerated and recurved north into a weakness in the ridge while still producing tropical storm-force winds. Satellite imagery showed the reformation of a well-defined circulation by 12:00UTC on August5, and the system was once again classified as Tropical Storm Colin. After attaining peak winds of 60mph (95km/h), an approaching trough sheared the cyclone and turned it northeast. Colin weakened to a tropical depression by 00:00UTC on August8 and degenerated into a trough for a second time twelve hours later; the trough dissipated early on August9.[61]
A tropical storm warning was raised for Bermuda as Colin approached but was later discontinued as it weakened.[61] Average winds of 31mph (50km/h) were observed across the island, although peak winds fell just shy of tropical storm intensity at 37mph (60km/h). L.F. Wade International Airport received 0.16in (4.1mm) of rainfall.[62] Although Colin steered well clear of the Carolinas, swells from the storm prompted at least 205 water rescues,[63] and a rip current off Ocracoke led to the drowning of one man.[64]
A non-tropical area of low pressure, first noted over the Gulf Stream on August7, entered the southeastern Gulf of Mexico and organized into a tropical depression about 120mi (195km) west of Fort Myers, Florida, by 18:00UTC on August10. As the newly formed cyclone moved west-northwest, a nearby upper-level low imparted high wind shear and dry air entrainment, and the depression degenerated into a remnant low twelve hours later without attaining tropical storm intensity. Upon degeneration, the low moved into the Gulf Coast of the United States and conducted a clockwise loop.[65] It emerged into the Gulf of Mexico again on August16, where the disturbance nearly regenerated into a tropical cyclone before making a second landfall in Mississippi the next day.[66] The remnants dissipated over the southeastern portion of the state on August18.[65]
The tropical depression produced waves up to 3ft (0.91m) around Anna Maria Island, where two people died of fatigue-related heart attacks after being caught in a rip current.[67] Heavy rainfall in the New Orleans, Louisiana and Mobile, Alabama areas—aided by instability from the remnants of the depression—flooded streets, inundating an apartment complex in the former city and cutting power to 1,921 customers in the latter city.[68][69] Forty homes and businesses were flooded in Avoyelles Parish.[70] Rainfall accumulations peaked south of Natchez, Mississippi, where 13.9in (350mm) was documented.[71]
The interaction of a vigorous tropical wave and a disturbance within the Intertropical Convergence Zone led to the formation of a tropical depression about 520mi (835km) west-southwest of Cabo Verde by 18:00UTC on August21. Steered by a ridge to its north, the depression steadily organized as it moved west-northwest, intensifying into Tropical Storm Danielle by 06:00UTC on August22 and attaining hurricane intensity the following day. Influenced by moderate wind shear initially, Danielle maintained its status as a minimal hurricane for several days. Early on August26, however, a more conducive environment led to rapid intensification, and by 18:00UTC the next day, the storm attained its peak intensity as a Category4 hurricane with winds of 130mph (210km/h). Danielle began to round the western periphery of the steering ridge after peak intensity, curving northeast as it began an eyewall replacement cycle. The inner core change, combined with progressively cooler waters, resulted in the system weakening to a tropical storm by 18:00UTC on August30 and degenerating into a remnant low six hours later. The low became extratropical on August31 maintained distinct until dissipating well east-southeast of Greenland on September3.[72]
A tropical storm watch was issued for Bermuda on August27 but swiftly canceled the next day as Danielle steered well clear of the island.[72] Swells from the powerful hurricane reached the East Coast of the United States, leading to the rescues of 250 people in Ocean City, Maryland and an additional 70 people off the coast of Central Florida. The body of a man—whose death appeared to have been from drowning—was pulled from the waters of Satellite Beach, Florida; a second man went missing in Ocean City, but his body was never recovered and the search was eventually called off.[73] Researchers examining the wreckage of RMS Titanic were forced to seek refuge in St. John's, Newfoundland;[74] swells as large as 10ft (3.0m) impacted the coastline of Newfoundland.[75]
A vigorous tropical wave entered the Atlantic on August23, developing into a tropical depression off the western coast of Africa two days later at 06:00UTC. The nascent depression steadily intensified as it moved west-northwest, becoming Tropical Storm Earl six hours after formation and further strengthening into a hurricane by 12:00UTC on August29. A weakness in the steering ridge, created by leading Hurricane Danielle, caused Earl to narrowly miss the northern Leeward Islands as it strengthened into a Category4 hurricane on August30. Intensification was temporarily stunted as the cyclone underwent an eyewall replacement cycle, but Earl ultimately attained peak winds of 145mph (235km/h) by 06:00UTC on September2. Increased shear and a second replacement cycle caused the hurricane to rapidly weaken thereafter. It weakened to a tropical storm by 00:00UTC on September4, and although the system briefly re-attained hurricane intensity as it moved ashore near Liverpool, Nova Scotia, Earl transitioned into an extratropical cyclone twelve hours later. The extratropical low merged with another system over the Labrador Sea the next day.[76]
Severe impacts from Earl in Antigua and Barbuda amounted to EC $34million ($12.6 millionUSD).[77] One person was electrocuted trying to restore power.[78] Wind gusts neared or surpassed hurricane force across Guadeloupe and the French islands, peaking at 105mph (170km/h) in Gustavia.[79] Approximately 7,500 residents were left without power across Saint Martin, Saint Barthélemy, and Guadeloupe.[80] Heavy rainfall and strong wind gusts battered Saint Kitts and Nevis, leaving streets flooded and many residences without power.[81] In the British Virgin Islands, wind gusts up to 88mph (142km/h) damaged or destroyed dozens of structures, resulting in up to $7 million in damage.[82] Substantial effects were also observed in the U.S. Virgin Islands, where total infrastructure losses were placed at $2.5 million and revenue losses from deterred vacationers reached $10.7 million.[83][84] Flooding and downed power lines in Puerto Rico left 187,000 residents without power and an additional 60,000 without water access.[85] As Earl paralleled the East Coast of the United States, it produced varying degrees of impact; North Carolina was hardest hit, with over $3.5 million in damage.[76] Three people were killed in rough seas off Florida,[76][86][87] one person was killed by rough seas off Maine,[76] and two people were killed by rip currents off New Jersey.[76] Approximately 940,000 people were left without power across Nova Scotia and surrounding areas, where one death occurred.[76][88]
A large and convective tropical wave moved off the western coast of Africa in late August, developing into a tropical depression by 12:00UTC on August30 about 1,035mi (1,666km) east of the Lesser Antilles. Satellite imagery and data from a research aircraft indicated the depression intensified into Tropical Storm Fiona six hours later. Directed by an expansive mid-level ridge to its north, the cyclone moved west-northwest for several days, attaining peak winds of 65mph (105km/h) by 18:00UTC on September1 as it passed close to the northern Leeward Islands. Fiona's position between the mid-level ridge and the large circulation of Hurricane Earl off The Carolinas turned the storm northwest and then north as it encountered increasingly strong wind shear and began to weaken. Expansive outflow from Earl caused Fiona's low-level circulation to become dislocated from its convection, and the system degenerated into a remnant low by 00:00UTC on September4.[89] The remnant low passed near Bermuda, producing light winds and about 0.78in (20mm) of rainfall,[90] before dissipating the next day.[89]
A strong tropical wave organized into a tropical depression by 06:00UTC on September1 about 920mi (1,480km) west-southwest of Cabo Verde. With a burst of convection near its center, the depression was upgraded to Tropical Storm Gaston six hours later and reached peak winds of 40mph (65km/h).[91] Despite initial projections that Gaston would become an increasingly strong hurricane over the central Atlantic,[92] exceptionally dry air began to wrap in the storm after peak. It weakened to a tropical depression by 00:00UTC on September2 and further degenerated into a remnant low by 18:00UTC that day. The system nearly regenerated into a tropical cyclone the following day as shallow convection wrapped into the center, but the increased organization was transient and it ultimately remained a remnant low until dissipating southeast on the Dominican Republic on September8.[91] The remnants of Gaston produced sporadic rainfall across Puerto Rico, peaking at 3.03in (77mm) in Naguabo.[93]
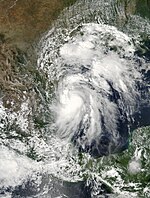
The East Pacific's Tropical Depression Eleven-E moved across Mexico and degenerated into a remnant low on September4. Its low and mid-level circulations survived crossing Mexico and entered the southern Bay of Campeche, reforming as a tropical depression by 18:00UTC on September5. Steered north to north-northwest, the cyclone quickly strengthened as deep convection fired over its center; it intensified into Tropical Storm Hermine by 06:00UTC on September6 and attained peak winds of 70mph (115km/h) by 02:00UTC the following day as it made landfall near Matamoros, Mexico.[94] Despite being well inland, Hermine continued to maintain an inner core and only slowly weakened.[95] It fell to tropical depression status over central Texas by 00:00UTC on September8 and ultimately dissipated over southeastern Kansas by 06:00UTC on September10.[94]
Tropical storm-force winds affected mainly coastal sections of northern Mexico; Matamoros recorded peak sustained winds of 53mph (85km/h) with gusts to 67mph (108km/h). Dozens of structures were damaged, trees and power lines were downed, and many residents were left without power.[96] Impact was more significant across the United States—most notably in Texas—where 283 homes sustained minor damage, 231 homes sustained major damage, and 68 homes were destroyed.[97] Torrential rainfall, peaking at 16.37in (416mm) in Georgetown,[98] forced more than 100 high water rescues.[99] In Oklahoma, flash flooding resulted in severe infrastructure damage.[100] Several tornadoes touched down in both states.[94] Seven people were killed in Texas and one in Oklahoma,[101] while the total damage total reached $240 million.[94]
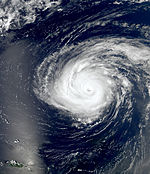
The most intense hurricane of the season began as a tropical wave that organized into a tropical depression southeast of Cabo Verde early on September8. Initial organization was fast-paced, and the depression intensified into Tropical Storm Igor six hours after formation. Igor moved west to west-northwest for several days while embedded within the monsoon trough. Increased vertical shear caused the cyclone to temporarily weaken to a tropical depression by 12:00UTC on September9, but it re-attained tropical storm intensity the next day and further strengthened to a hurricane by 00:00UTC on September12. After rapid intensification and a subsequent eyewall replacement cycle, Igor attained its peak with maximum sustained winds of 155mph (250km/h) by 00:00UTC on September15. Inner core changes continued after peak, and Igor continued as a Category4 hurricane for several days until increased shear and dry air entrainment forced a consistent weakening trend early on September17. The system recurved north-northeast while passing within 60mi (95km) of Bermuda as a minimal hurricane. It eventually made landfall near Cape Race, Newfoundland with winds of 85mph (135km/h) by 15:00UTC on September21 and transitioned into an extratropical cyclone three hours later. The extratropical low was absorbed by a larger such system between Greenland and Labrador on September23.[35]
Although Igor steered well clear of the Caribbean, large swells of 15–20ft (4.6–6.1m) propagated from the storm, drowning one person in St. Croix and another in Puerto Rico.[35] Large waves affected the East Coast of the United States, and one person drowned in Surf City, North Carolina.[102] In Bermuda, sustained winds of 91mph (146km/h) and gusts up to 117mph (188km/h) downed trees and power lines, cutting power to approximately 28,000 residents. Rainfall was largely insignificant, peaking at 3.19in (81mm).[35] Impacts near the storm's landfall in Newfoundland were more severe. Rainfall amounts of more than 2in (51mm) were widespread, with a peak of 9.37in (238mm) in St Lawrence; as such, Igor ranks as the third wettest tropical cyclone to impact Atlantic Canada.[103] Run-off from the torrential rainfall damaged or destroyed structures, killed a man when his driveway was washed out and he was swept away, and isolated approximately 150 communities.[104] Sustained winds of 80mph (130km/h) with gusts to 107mph (172km/h) in Cape Pine downed trees and power lines while damaging or destroying many homes.[104] Approximately 50,000 households lost power during the peak of the storm.[105] The overall damage total reached $200 million across Newfoundland, making Igor the costliest hurricane on record there.[35] It was regarded as the worst storm of tropical origin to hit Newfoundland since 1935.[106]
A vigorous tropical wave moved off the western coast of Africa on September11 and almost immediately led to the formation of a tropical depression by 06:00UTC the next day. Steered in a traditional west-northwest fashion, the depression intensified into Tropical Storm Julia twelve hours later and continued steady strengthening to become a hurricane by 12:00UTC September14.[107] As a reminder of limited hurricane intensity forecasting skill,[108] the system began a period of rapid intensification thereafter, attaining peak winds of 140mph (225km/h) by 12:00UTC on September15. Julia became the easternmost Category4 hurricane on record in the Atlantic as a result. After peak, the system recurved around a ridge while simultaneously weakening under influence of Hurricane Igor's outflow. It fell back to tropical storm intensity by 00:00UTC on September18 and degenerated into a remnant low by 18:00UTC on September20 while located about 1,095mi (1,762km) west of the Azores. The remnant low turned back west, dissipating late on September24.[107]
The Government of Cabo Verde issued a tropical storm warning for the island chain as Julia approached.[107] Gusts of 24–30mph (39–48km/h) damaged maize crops, and waves of 9.8–14.8ft (3.0–4.5m) affected the coastline. Landslides isolated the community of Covão Grande.[109] Rainfall was insignificant, peaking at 0.39in (9.9mm) in Sal.[110][111]
The interaction of a tropical wave and another elongated trough led to the development of a tropical depression by 12:00UTC on September14 about 375mi (605km) east of Chetumal, Mexico. The depression intensified into Tropical Storm Karl six hours later and continued to strengthen until moving ashore near Rio Huach, Mexico, with winds of 65mph (105km/h) at 12:45UTC on September15. Although the storm's winds diminished over land, the structure of the storm actually improved, allowing Karl to quickly become a hurricane by 18:00UTC on September16 once emerging over the Bay of Campeche. A period of rapid deepening brought the cyclone to its peak of 125mph (200km/h) early on September17, the only major hurricane on record in the Bay of Campeche. Increasing shear and dry air entrainment caused Karl to weaken slightly, but it retained winds of 115mph (185km/h) while making landfall just north of Veracruz, Mexico by 16:45UTC on September17. The system weakened rapidly over the mountainous terrain of Mexico, falling to tropical storm intensity by 00:00UTC on September18, weakening to a tropical depression six hours later, and dissipating about 85mi (135km) southeast of Veracruz by 12:00UTC.[112]
Throughout Quintana Roo, heavy rains from Karl resulted in scattered flooding which forced hundreds of families from their homes.[113] More than 600 houses were destroyed in the city of Chetumal as a result of flooding and landslides.[114] At the height of the storm, a total of 54,265residents were without power; however, most had their electricity restored within a day.[115] Thousands of hectares of crops were lost.[116] Upon making landfall in Veracruz, Karl caused widespread heavy rainfall, peaking at 17.83in (453mm) in Misantla, Mexico.[117] Strong winds uprooted hundreds of thousands of trees and downed power lines, leaving up to 280,000 residents in the dark.[118] More than 200,000 homes were damaged or destroyed across the states of Veracruz, Tabasco, and Oaxaca.[114] A total of 22 people were killed by the storm, and the damage cost totaled to approximately $3.9 billion.[112][114]
Following a sequence of Cape Verde hurricanes, another tropical wave moved off the coast of Africa on September 16. A broad area of low pressure developed in association with the wave as it passed southwest of Cape Verde. By 18:00UTC on September20, the wave developed into a tropical depression about 460mi (740km) southwest of Cape Verde. An unusually weak subtropical ridge steered the system north, east, and then north again over subsequent days. The depression intensified into Tropical Storm Lisa six hours after formation, but fell back to tropical depression intensity by 18:00UTC on September22 as dry air entered the circulation. A more favorable environment allowed Lisa to re-attain tropical storm status by 12:00UTC the following day and subsequently begin a period of rapid intensification. The small cyclone reached hurricane intensity by 21:00UTC on September24 and attained peak winds of 85mph (135km/h) six hours later. Progressively cooler waters and stronger shear caused Lisa to weaken to a tropical storm early on September25, weaken to a tropical depression early on September26, and degenerate into a remnant low at 18:00UTC that day. The remnant low moved northwest and north, dissipating by 06:00UTC on September29 about 595mi (960km) south-southwest of the Azores.[119]
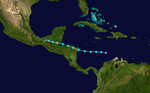
The same tropical wave that led to the formation of Julia moved off the western coast of Africa on September11, leading to the development of a tropical depression by 12:00UTC on September23 about 565mi (910km) east of Cabo Gracias a Dios. Steered west to west-northwest by a subtropical ridge to its north, the depression steadily organized, intensifying into Tropical Storm Matthew six hours after formation and attaining peak winds of 60mph (95km/h) by 18:00UTC on September23, an intensity it maintained while making just south of Cabo Gracias a Dios an hour later. The system briefly emerged into the Gulf of Honduras on September25 before making a second landfall north-northeast of Monkey River Town, Belize, with winds of 40mph (65km/h) around 15:00UTC. The system weakened quickly once inland, falling to a tropical depression by 18:00UTC and degenerating into a remnant low by 12:00UTC on September26. The remnant low turned southwest and dissipated twelve hours later.[120]
The precursor wave to Matthew produced heavy rainfall across portions of Venezuela, destroying several homes and leading to eight fatalities.[121] Impacts extended across Central America, especially in Nicaragua where 70 people were killed. Bridges were collapsed, roads were destroyed, communication lines were downed, and up to 255 communities were affected by the storm there.[122] Similar but less severe damage was observed in Honduras, where four people were killed, and in El Salvador, where one person died.[123] Widespread rainfall totals of 10in (250mm) were recorded across Veracruz, peaking at 16.73in (425mm) in Acayucan.[124] The combined impacts of Hurricane Karl and Tropical Storm Matthew in the state cost up to $8 billion.[125] Flooding from Matthew further inland in Mexico, which was already observing one of its wettest years on record, led to a landslide in Santa María Tlahuitoltepec that killed seven people.[126]
The remnants of Matthew combined with a broad area of low pressure over the northwestern Caribbean to form Tropical Storm Nicole by 12:00UTC on September28, about 75mi (120km) south of the Isle of Youth, Cuba. Affected by strong westerly shear, Nicole never inherited a traditional appearance on satellite imagery; instead, it was characterized by an ill-defined circulation west of most convection, with the strongest winds well displaced from the center. The cyclone attained peak winds of 45mph (70km/h) shortly after formation, but its center of circulation became increasingly diffuse as Nicole tracked toward the Cuba coastline, leading to degeneration into a remnant low by 15:00UTC on September29. The low moved north-northeast into the Bahamas, where it became extratropical and quickly weakened to a trough on September30.[127]
Nicole produced a tremendous amount of rain in Jamaica, totaling to 37.42in (950mm) in Belleisle.[127] Severe flooding and landslides affected up to 507,831 residents, resulting 16 deaths and 42 injuries.[128] Flooded roadways isolated communities, trapping hundreds of people in their homes.[129] Over 288,000 residences lost power, over 40 percent of the island's water supply systems were inoperable at one point, and dozens of bridges collapsed.[130] Infrastructure damage totaled to $235.4 million,[131] while property damage reached $3.2 million and agricultural damage amounted to $6.8 million.[128] In nearby Cuba, rainfall reached 9.22in (234mm) and winds gusted to 53mph (85km/h);[127] houses were flooded, crops were damaged, and livestock was killed as a result.[132] Similar impacts occurred across the Cayman Islands, with sporadic power outages, flooding in low-lying locations, and damaged houses.[133] While the remnants of Nicole produced only minor impacts across Florida, mainly in the form of street flooding,[127] impacts were much more severe across the Mid-Atlantic as the system combined with a large area of low pressure across the region.[134] Record-breaking rainfall, accumulating to 22.54in (573mm) in Wilmington, North Carolina, closed over 150 roadways, knocked out power, and caused traffic accidents.[135]
A tropical wave departed the western coast of Africa on September26, becoming entangled with an upper-level trough to form a subtropical depression by 06:00UTC on October6, about 265mi (425km) north-northwest of San Juan, Puerto Rico. The depression recurved sharply northeast and quickly strengthened into Subtropical Storm Otto six hours after formation. On October7, Otto completed transition into a fully tropical cyclone as deep convection formed over its center, despite weakening during the process. The system further intensified into a hurricane by 12:00UTC on October8 and attained peak winds of 85mph (135km/h) twelve hours later. An abrupt increase in wind shear caused Otto to weaken as it accelerated northeast; it fell to tropical storm intensity by 00:00UTC on October10 and transitioned into an extratropical cyclone six hours later while positioned about 1,035mi (1,666km) east-northeast of Bermuda. The extratropical cyclone persisted for several days, eventually becoming a non-convective swirl early on October14 and dissipating by 00:00UTC on October18.[136]
Otto and its precursor disturbance brought several days of rainfall and gusty winds to the Greater Antilles. In St. Lucia, 400 houses were severely flooded or destroyed, access to water was cut off, and power outages were observed.[137] Storm impacts in Saint Kitts and Nevis flooded homes, caused minor beach erosion, topped bridges, washed out roads, and caused severe disruption to electrical services.[138] Throughout the U.S. Virgin Islands, monthly rainfall records were shattered, with 21.52in (547mm) in Red Hook.[139] Flooding and landslides on surrounding islands closed roads and highways.[140] Across the British Virgin Islands, the worst flooding in the nation's history—with precipitation amounts up to 24.98in (634mm)—overturned cars, damaged drainage pipes and utility lines, and left residents without water.[141] Widespread flooding across Puerto Rico affected at least 295 roads, including at least 14 that were severely damaged, and impacted crops.[142] Landslides and downed utility poles isolated communities, waters supplies were contaminated, and numerous people required rescuing.[143][144]
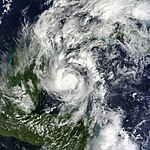
The complex interaction between a cold front, multiple tropical waves, and a broad area of low pressure in the wake of Nicole led to the formation of a tropical depression by 00:00UTC on October11 about 115mi (185km) southeast of Cabo Gracias a Dios. The nascent cyclone intensified into Tropical Storm Paula six hours later, briefly moving ashore the northeastern tip of Honduras early on October11 before re-emerging into the northwestern Caribbean. Amid a favorable environment, Paula intensified into a hurricane by 00:00UTC on October12 and attained peak winds of 105mph (170km/h) at 18:00UTC while maintaining an unusually small size. An increase in shear prompted a steady weakening trend as the system turned north and then east. Paula fell to tropical storm intensity early on October14, making landfall between Santa Lucia and Puerto Esperanza with winds of 65mph (105km/h). The system further weakened to a tropical depression early on October15 and degenerated into a remnant low by 12:00UTC. The remnant low quickly became diffuse, dissipating at 18:00UTC.[145]
In northeastern Honduras, low-lying areas were evacuated and numerous homes were destroyed.[146] Rainfall peaked at 7.9in (200mm), resulting in widespread flooding.[147] Waves up to 7ft (2.1m) affected the coastline.[148] An American tourist drowned off Cozumel after succumbing to rough seas.[145] Only very minor impacts were observed along the northeastern coastline of the Yucatán Peninsula.[149] The outer bands of Paula affected Cuba, where rainfall peaked at 7.32in (186mm) and winds reached 68mph (109km/h).[145][150] The strong winds downed many trees, blocking roadways, and damaged the roofs of several homes. The rain, however, was regarded as generally beneficial to crops and low reservoirs. Rough seas removed concrete from Havana's sea wall and submerged coastal streets under 1–2ft (0.30–0.61m) of water.[151]
An area of disturbed weather within a persistent, broad trough across the southwestern Caribbean organized into the nineteenth tropical depression of the season by 06:00UTC on October20 about 195mi (315km) north of Cabo Gracias a Dios. The depression was slow to organize at first, affected by dry air and moderate shear from a trough over the Southeast United States and western Atlantic, but eventually strengthened into Tropical Storm Richard by 12:00UTC on October21 as it curved south and then west. Upper-level winds slackened over subsequent days, allowing the cyclone to attain hurricane intensity early on October24 and reach peak winds of 100mph (160km/h) by 00:00UTC the next day. Richard moved ashore near Gales Point, Belize, thirty minutes later. The system weakened rapidly once inland, degenerating into a remnant low by 00:00UTC on October26. Despite emerging over the Bay of Campeche, high wind shear prevented redevelopment and instead caused the feature to dissipate eighteen hours later.[152]
Although Richard tracked north of Honduras, strong winds along the coastline downed trees and power lines. Mudslides stranded up to 15,000 people across 40 different towns. The island of Roatán received a gust of 58mph (93km/h).[153] Farther north and west in Belize, the Belize Zoo and Tropical Education Center—popular attractions for tourists—were heavily damaged.[154] About 80% of the grapefruit and nearly 25% of the orange crop were lost there. Two deaths were observed: one man was killed when his boat capsized in rough seas, while a second man was mauled to death by a jaguar that escaped after a tree mangled its cage. The damage cost topped $80 million.[152]
A broad area of low pressure formed at the tail-end of a stationary front, organizing into a tropical depression by 18:00UTC on October28 about 520mi (835km) south-southeast of Bermuda. Steered west-northwest and then sharply northeast ahead of an approaching cold front, the system intensified into Tropical Storm Shary six hours after formation. Within an environment of low wind shear, Shary strengthened into a hurricane and attained peak winds of 75mph (120km/h) by 00:00UTC on October30 as an eye became apparent on microwave imagery. The storm became increasingly asymmetric as it interacted with the front, and Shary transitioned into an extratropical cyclone by 18:00UTC that day. The extratropical system was completely absorbed by the front six hours later.[155] Since Shary remained south and east of Bermuda, its effects were limited to 0.54in (14mm) of rainfall and a gust to 35mph (55km/h).[156]
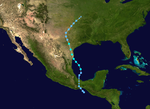
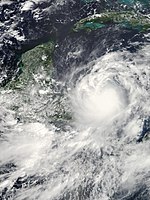
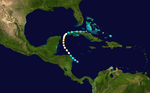
The final tropical cyclone of the 2010 season developed from a tropical wave that moved off Africa on October24. The wave pushed west, organizing into a tropical depression by 06:00UTC on October29 and into Tropical Storm Tomas six hours later while located a few hundred miles east of Barbados. The cyclone turned northwest after formation while continuing to intensify, moving over Barbados by 09:00UTC on October30 with winds of 70mph (115km/h); as such, Tomas became the latest storm in a calendar year to strike the Windward Islands. The system reached hurricane intensity three hours later, and by 20:00UTC, attained its peak winds of 100mph (160km/h) while moving across St. Lucia. After moving into the Caribbean, a sharp increase in wind shear and dry air entrainment caused Tomas to dramatically weaken, and the storm fell to a tropical depression by 00:00UTC on November3. Fluctuating atmospheric conditions allowed Tomas to strengthen and oscillate between a tropical storm and hurricane as it curved through the Windward Passage and into the Atlantic. By 00:00UTC on November8, the cyclone succumbed to an increasingly unfavorable regime and became an extratropical cyclone. The storm rotated around a broader low in the western Atlantic before being absorbed by a larger extratropical low south of Newfoundland early on November11.[37]
Impacts throughout the Windward Islands were substantial, but most heavily concentrated in St. Lucia. There, gusts reached 69mph (111km/h), toppling trees and power lines. Torrential rainfall up to 26.3in (670mm) created mudslides and landslides that damaged or destroyed numerous structures, bridges, and vehicles. Most of the island's plantain and banana crops were destroyed.[37] Up to 14 people were killed.[157] Farther west in Curaçao, Tomas led to the most prolific rain event in four decades.[158] An elderly man was killed after suffering a heart attack and drowning in his flooded vehicle,[37] while a rescue worker died after a hospital wall collapsed.[159] In Haiti, already ravaged by a catastrophic 7.0 MW earthquake less than a year prior, heavy rainfall flooded a refugee camp and triggered mudslides that destroyed homes and roads.[160] Up to 35 people were killed there, though it was feared many more could die as Tomas exacerbated an already-deadly cholera outbreak.[161]
The following list of names was used for named storms that formed in the North Atlantic during 2010.[162] This was the same list used in the 2004 season with the exceptions of Colin, Fiona, Igor, and Julia, which replaced Charley, Frances, Ivan, and Jeanne, respectively.[163] Storms were named Colin, Fiona, Igor, Julia, Paula, Richard, Shary, and Tomas for the first time this year.
On March16, 2011, at the 33rdSession of the RA IV hurricane committee, the World Meteorological Organization retired the names Igor and Tomas from its rotating Atlantic hurricane name lists due to the number of deaths and damage they caused, and they will not be used again for another Atlantic hurricane.[164] They were replaced with Ian and Tobias, respectively, for the 2016 season.[165][166]
Season effects
This is a table of all of the storms that formed in the 2010 Atlantic hurricane season. It includes their name, duration, peak classification and intensities, areas affected, damage, and death totals. Deaths in parentheses are additional and indirect (an example of an indirect death would be a traffic accident), but were still related to that storm. Damage and deaths include totals while the storm was extratropical, a wave, or a low, and all of the damage figures are in 2010 USD.
The 2004 Atlantic hurricane season was a very deadly, destructive, and active Atlantic hurricane season, with over 3,200 deaths and more than $61 billion in damage. More than half of the 16 tropical cyclones brushed or struck the United States. Due to the development of a Modoki El Niño – a rare type of El Niño in which unfavorable conditions are produced over the eastern Pacific instead of the Atlantic basin due to warmer sea surface temperatures farther west along the equatorial Pacific – activity was above average. The season officially began on June 1 and ended on November 30, though the season's last storm, Otto, dissipated on December 3, extending the season beyond its traditional boundaries. The first storm, Alex, developed offshore of the Southeastern United States on July 31, one of the latest dates on record to see the formation of the first system in an Atlantic hurricane season. It brushed the Carolinas and the Mid-Atlantic, causing one death and $7.5 million (2004 USD) in damage. Several storms caused only minor damage, including tropical storms Bonnie, Earl, Hermine, and Matthew. In addition, hurricanes Danielle, Karl, and Lisa, Tropical Depression Ten, Subtropical Storm Nicole and Tropical Storm Otto had no effect on land while tropical cyclones. The season was the first to exceed 200 units in accumulated cyclone energy (ACE) since 1995, mostly from Hurricane Ivan, the storm produced the highest ACE. Ivan generated the second-highest ACE in the Atlantic, only behind 1899 San Ciriaco Hurricane.
The 1966 Atlantic hurricane season saw the Weather Bureau office in Miami, Florida, be designated as the National Hurricane Center (NHC) and assume responsibility of tropical cyclone forecasting in the basin. The season officially began on June 1, and lasted until November 30. These dates conventionally delimit the period of each year when most tropical cyclones form in the Atlantic basin. It was an above-average season in terms of tropical storms, with a total of 15. The first system, Hurricane Alma, developed over eastern Nicaragua on June 4 and became the most recent major hurricane in the month of June. Alma brought severe flooding to Honduras and later to Cuba, but caused relatively minor impact in the Southeastern United States. Alma resulted in 90 deaths and about $210.1 million (1966 USD) in damage.
The 2004 Pacific hurricane season was an overall below-average Pacific hurricane season in which there were 12 named tropical storms, all of which formed in the eastern Pacific basin. Of these, 6 became hurricanes, and 3 of those intensified into major hurricanes. No storms made landfall in 2004, the first such occurrence since 1991. In addition to the season's 12 named storms, there were five tropical depressions that did not reach tropical storm status. One of them, Sixteen-E, made landfall in northwestern Sinaloa. The season officially began on May 15 in the eastern Pacific, and on June 1 in the central Pacific basin. It officially ended in both basins on November 30. These dates conventionally delimit the period during each year when most tropical cyclones form in each respective basin. These dates conventionally delimit the period during each year when a majority of tropical cyclones form. The season was reflected by an accumulated cyclone energy (ACE) index of 71 units.
The 2005 Pacific hurricane season was a near-average Pacific hurricane season which produced fifteen named storms, seven hurricanes and two major hurricanes. It was also the second consecutive season in which no tropical cyclone of at least tropical storm intensity made landfall. The season officially began on May 15 in the East Pacific Ocean, and on June 1 in the Central Pacific; they ended on November 30. These dates conventionally delimit the period of each year when most tropical cyclones form in the Pacific basin. However, the formation of tropical cyclones is possible at any time of the year.
The 2003 Pacific hurricane season was the first season to feature no major hurricanes since 1977. The season officially began on May 15, 2003 in the Eastern North Pacific, and on June 1 in the Central ; both ended on November 30. These dates, adopted by convention, historically describe the period in each year when most tropical cyclogenesis occurs in these regions of the Pacific. The season featured 16 tropical storms, 7 of which intensified into hurricanes, which was then considered an average season. Damage across the basin reached US$129 million, and 23 people were killed by the storms.
The 2008 Atlantic hurricane season was the most destructive Atlantic hurricane season since 2005, causing over 1,000 deaths and nearly $50 billion in damage. The season ranked as the third costliest ever at the time, but has since fallen to ninth costliest. It was an above-average season, featuring sixteen named storms, eight of which became hurricanes, and five which further became major hurricanes. It officially started on June 1 and ended on November 30. These dates conventionally delimit the period of each year when most tropical cyclones form in the Atlantic basin. However, the formation of Tropical Storm Arthur caused the season to start one day early. It was the only year on record in which a major hurricane existed in every month from July through November in the North Atlantic. Bertha became the longest-lived July tropical cyclone on record for the basin, the first of several long-lived systems during 2008.
The 1978 Pacific hurricane season was the first Pacific hurricane season to use both masculine and feminine names for tropical cyclones. It also began the modern practice of utilizing naming lists every six years. Despite lacking an El Niño, a common driver of enhanced activity in the East and Central Pacific basins, the 1978 season was active. It featured 19 named storms, 14 hurricanes, and 7 major hurricanes, the latter of which are Category 3 or stronger cyclones on the Saffir–Simpson scale. Within the confines of the Central Pacific basin, located between the International Date Line and 140°W, 13 tropical cyclones or their remnants were observed by forecasters at the Central Pacific Hurricane Center, a record number of occurrences at the time. Seasonal activity began on May 30 and ended on October 21, within the limits of a traditional hurricane season which begins on May 15 in the East Pacific and June 1 in the Central Pacific. The season ends on November 30 in both basins. These dates conventionally delimit the period during each year when most tropical cyclones form.
The 2008 Pacific hurricane season was a near-average Pacific hurricane season which featured seventeen named storms, though most were rather weak and short-lived. Only seven storms became hurricanes, of which two intensified into major hurricanes. This season was also the first since 1996 to have no cyclones cross into the central Pacific. The season officially began on May 15 in the eastern Pacific and on June 1 in the central Pacific. It ended in both regions on November 30. These dates, adopted by convention, historically describe the period in each year when most tropical cyclone formation occurs in these regions of the Pacific. This season, the first system, Tropical Storm Alma, formed on May 29, and the last, Tropical Storm Polo, dissipated on November 5.
The 2011 Atlantic hurricane season was the second in a group of three very active Atlantic hurricane seasons, each with 19 named storms, only behind 1887, 1995, 2010, and 2012. The above-average activity was mostly due to a La Niña that persisted during the previous year. Of the season's 19 tropical storms, only seven strengthened into hurricanes, and four of those became major hurricanes: Irene, Katia, Ophelia, and Rina. The season officially began on June 1 and ended on November 30, dates which conventionally delimit the period during each year in which most tropical cyclones develop in the Atlantic Ocean. However, the first tropical storm of the season, Arlene, did not develop until nearly a month later. The final system, Tropical Storm Sean, dissipated over the open Atlantic on November 11.
The 2014 Pacific hurricane season was the fifth-busiest season since reliable records began in 1949, alongside the 2016 season. The season officially started on May 15 in the East Pacific Ocean, and on June 1 in the Central Pacific; they both ended on November 30. These dates conventionally delimit the period of each year when most tropical cyclones form in the Pacific basin.
The 2017 Pacific hurricane season was an above average Pacific hurricane season in terms of named storms, though less active than the previous three, featuring eighteen named storms, nine hurricanes, and four major hurricanes. Despite the considerable amount of activity, most of the storms were weak and short-lived. The season officially started on May 15 in the eastern Pacific Ocean, and on June 1 in the central Pacific; they both ended on November 30. These dates conventionally delimit the period of each year when most tropical cyclones form in the respective regions. However, the formation of tropical cyclones is possible at any time of the year, as illustrated in 2017 by the formation of the season's first named storm, Tropical Storm Adrian, on May 9. At the time, this was the earliest formation of a tropical storm on record in the eastern Pacific basin proper. The season saw near-average activity in terms of accumulated cyclone energy (ACE), in stark contrast to the extremely active seasons in 2014, 2015, and 2016; and for the first time since 2012, no tropical cyclones formed in the Central Pacific basin. However, for the third year in a row, the season featured above-average activity in July, with the ACE value being the fifth highest for the month. Damage across the basin reached $375.28 million (2017 USD), while 45 people were killed by the various storms.
The 2012 Atlantic hurricane season was the final year in a string of three consecutive very active seasons since 2010, with 19 tropical storms. The 2012 season was also a costly one in terms of property damage, mostly due to Hurricane Sandy. The season officially began on June 1 and ended on November 30, dates that conventionally delimit the period during each year in which most tropical cyclones form in the Atlantic Ocean. However, Alberto, the first named system of the year, developed on May 19 – the earliest date of formation since Subtropical Storm Andrea in 2007. A second tropical cyclone, Beryl, developed later that month. This was the first occurrence of two pre-season named storms in the Atlantic basin since 1951. It moved ashore in North Florida on May 29 with winds of 65 mph (105 km/h), making it the strongest pre-season storm to make landfall in the Atlantic basin. This season marked the first time since 2009 where no tropical cyclones formed in July. Another record was set by Hurricane Nadine later in the season; the system became the fourth-longest-lived tropical cyclone ever recorded in the Atlantic, with a total duration of 22.25 days. The final storm to form, Tony, dissipated on October 25 – however, Hurricane Sandy, which formed before Tony, became extratropical on October 29.
The 2013 Atlantic hurricane season was a well below average Atlantic hurricane season in terms of the number of hurricanes. It was the first since 1994 with no major hurricanes, Category 3 or higher on the Saffir–Simpson scale, and the first in the satellite era where no hurricanes reached Category 2 strength. Altogether, the season produced 15 tropical cyclones, of which all but one became a named storm. The season officially began on June 1, 2013, and ended on November 30, 2013. These dates historically describe the period in each year when most tropical cyclogenesis occurs in the North Atlantic and are adopted by convention. The first storm of the season, Andrea, developed on June 5, while the last, an unnamed subtropical storm, dissipated on December 7. Throughout the year, only two storms, Humberto and Ingrid, reached hurricane strength; this was the lowest seasonal total since 1982.
The 2014 Atlantic hurricane season was a below-average hurricane season in terms of named storms and major hurricanes, though average in terms of number of hurricanes overall. It produced nine tropical cyclones, eight of which became named storms; six storms became hurricanes and two intensified further into major hurricanes. The season officially began on June 1, and ended on November 30. These dates historically describe the period each year when most tropical cyclones form in the Atlantic basin. The first storm of the season, Arthur, developed on July 1, while the final storm, Hanna, dissipated on October 28, about a month prior to the end of the season.
The 2016 Atlantic hurricane season was the first above-average hurricane season since 2012, producing 15 named storms, 7 hurricanes and 4 major hurricanes. The season officially started on June 1 and ended on November 30, though the first storm, Hurricane Alex which formed in the Northeastern Atlantic, developed on January 12, being the first hurricane to develop in January since 1938. The final storm, Otto, crossed into the Eastern Pacific on November 25, a few days before the official end. Following Alex, Tropical Storm Bonnie brought flooding to South Carolina and portions of North Carolina. Tropical Storm Colin in early June brought minor flooding and wind damage to parts of the Southeastern United States, especially Florida. Hurricane Earl left 94 fatalities in the Dominican Republic and Mexico, 81 of which occurred in the latter. In early September, Hurricane Hermine, the first hurricane to make landfall in Florida since Hurricane Wilma in 2005, brought extensive coastal flooding damage especially to the Forgotten and Nature coasts of Florida. Hermine was responsible for five fatalities and about $550 million (2016 USD) in damage.
The 2017 Atlantic hurricane season was a devastating and extremely active Atlantic hurricane season, and the costliest on record, with a damage total of at least $294.92 billion (USD). The season featured 17 named storms, 10 hurricanes, and 6 major hurricanes. Most of the season's damage was due to hurricanes Harvey, Irma, and Maria. Another notable hurricane, Nate, was the worst natural disaster in Costa Rican history. These four storm names were retired following the season due to the number of deaths and amount of damage they caused.
The 2018 Atlantic hurricane season was the third in a consecutive series of above-average and damaging Atlantic hurricane seasons, featuring 15 named storms, 8 hurricanes, and 2 major hurricanes, which caused a total of over $50 billion in damages and at least 172 deaths. More than 98% of the total damage was caused by two hurricanes. The season officially began on June 1, 2018, and ended on November 30, 2018. These dates historically describe the period in each year when most tropical cyclones form in the Atlantic basin and are adopted by convention. However, subtropical or tropical cyclogenesis is possible at any time of the year, as demonstrated by the formation of Tropical Storm Alberto on May 25, making this the fourth consecutive year in which a storm developed before the official start of the season. The season concluded with Oscar transitioning into an extratropical cyclone on October 31, almost a month before the official end.
The 2020 Atlantic hurricane season was the most active Atlantic hurricane season on record, in terms of number of systems. It featured a total of 31 tropical or subtropical cyclones, with all but one cyclone becoming a named storm. Of the 30 named storms, 14 developed into hurricanes, and a record-tying seven further intensified into major hurricanes. It was the second and final season to use the Greek letter storm naming system, the first being 2005, the previous record. Of the 30 named storms, 11 of them made landfall in the contiguous United States, breaking the record of nine set in 1916. During the season, 27 tropical storms established a new record for earliest formation date by storm number. This season also featured a record ten tropical cyclones that underwent rapid intensification, tying it with 1995, as well as tying the record for most Category 4 hurricanes in a singular season in the Atlantic Basin. This unprecedented activity was fueled by a La Niña that developed in the summer months of 2020, continuing a stretch of above-average seasonal activity that began in 2016. Despite the record-high activity, this was the first season since 2015 in which no Category 5 hurricanes formed.
The 2019 Pacific hurricane season was an above average season which produced nineteen named storms, most of which were rather weak and short-lived. Only seven hurricanes formed, the fewest since 2010. The season officially began on May 15 in the East Pacific Ocean, and on June 1 in the Central Pacific; they both ended on November 30. These dates conventionally delimit the period of each year when most tropical cyclones form in the Pacific basin. This season was one of the latest-starting Pacific hurricane seasons on record, with the first tropical cyclone, Hurricane Alvin, forming on June 25. The final system, Tropical Depression Twenty-One-E, dissipated on November 18.
The 2021 Atlantic hurricane season was the third-most active Atlantic hurricane season on record in terms of number of tropical cyclones, although many of them were weak and short-lived. With 21 named storms forming, it became the second season in a row and third overall in which the designated 21-name list of storm names was exhausted. Seven of those storms strengthened into a hurricane, four of which reached major hurricane intensity, which is slightly above-average. The season officially began on June 1 and ended on November 30. These dates historically describe the period in each year when most Atlantic tropical cyclones form. However, subtropical or tropical cyclogenesis is possible at any time of the year, as demonstrated by the development of Tropical Storm Ana on May 22, making this the seventh consecutive year in which a storm developed outside of the official season.
1 2 3 4 5 Richard J. Pasch; Todd B. Kimberlain (February 15, 2011). Tropical Cyclone Report: Hurricane Igor(PDF) (Report). Miami, Florida: National Hurricane Center. pp.1, 2, 6, 7. Retrieved January 16, 2017.
↑ Todd B. Kimerlain; Robbie J. Berg; Eric S. Blake; Stacy R. Stewart (November 1, 2010). Monthly Tropical Weather Summary: October (Report). National Hurricane Center. Retrieved January 19, 2017.
1 2 3 4 Richard J. Pasch; Todd B. Kimberlain (March 7, 2011). Tropical Cyclone Report: Hurricane Tomas(PDF) (Report). Miami, Florida: National Hurricane Center. pp.1, 2, 5, 6. Retrieved January 18, 2017.
↑ Event Report: Storm Surge/Tide. National Weather Service Weather Forecast Office in Corpus Christi, Texas (Report). National Centers for Environmental Information. 2010. Retrieved January 12, 2017.
↑ Florida Event Report: Tropical Storm. National Weather Service Weather Forecast Office in Miami, Florida (Report). National Centers for Environmental Information. 2010. Retrieved January 12, 2017.
↑ Louisiana Event Report: Heavy Rain/Tropical System. National Weather Service Weather Forecast Office in New Orleans, Louisiana (Report). National Centers for Environmental Information. 2010. Retrieved January 12, 2017.
↑ Louisiana Event Report: Heavy Rain/Tropical System. National Weather Service Weather Forecast Office in New Orleans, Louisiana (Report). National Centers for Environmental Information. 2010. Retrieved January 12, 2017.
↑ Arkansas Event Report: Thunderstorm Wind. National Weather Service Weather Forecast Office in Little Rock, Arkansas (Report). National Centers for Environmental Information. 2010. Retrieved January 12, 2017.
↑ Louisiana Event Report: Heavy Rain. National Weather Service Weather Forecast Office in Lake Charles, Louisiana (Report). National Centers for Environmental Information. 2010. Retrieved January 13, 2017.
↑ Florida Event Report: High Surf. National Weather Service Weather Forecast Office in Miami, Florida (Report). National Centers for Environmental Information. 2010. Retrieved January 15, 2017.
↑ Joy Blackburn (October 7, 2010). "Storm pummels St. Croix". Daily News. The Times Tribune. Archived from the original on February 2, 2017. Retrieved September 29, 2021.
↑ Joy Blackburn; Aldeth Lewin (October 8, 2010). "Otto's onslaught spread havoc". Daily News. The Triboro Banner. Retrieved January 21, 2017.
↑ Dick Drayer (November 11, 2010). "Meteo rapporteert over Tomas" (in German). Radio Nederland Wereldomroep. Archived from the original on 2017-09-29. Retrieved April 27, 2017.
↑ Leoni Leidel-Schenk (November 2, 2010). "Tomas eist twee levens". Versgeperst.com. Archived from the original on November 4, 2010. Retrieved April 27, 2017.
↑ National Hurricane Operations Plan(PDF) (Report). Washington, D.C.: NOAA Office of the Federal Coordinator for Meteorological Services and Supporting Research. May 2010. p.3-7. Retrieved January 20, 2024.
This page is based on this Wikipedia article Text is available under the CC BY-SA 4.0 license; additional terms may apply. Images, videos and audio are available under their respective licenses.