Related Research Articles
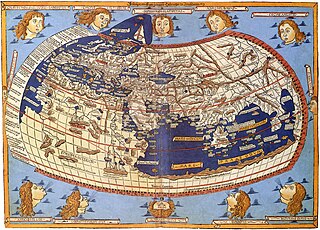
Cartography is the study and practice of making and using maps. Combining science, aesthetics and technique, cartography builds on the premise that reality can be modeled in ways that communicate spatial information effectively.
A small multiple is a series of similar graphs or charts using the same scale and axes, allowing them to be easily compared. It uses multiple views to show different partitions of a dataset. The term was popularized by Edward Tufte.

Figure-ground contrast, in the context of map design, is a property of a map in which the map image can be partitioned into a single feature or type of feature that is considered as an object of attention, with the remainder of the map being relegated to the background, outside the current focus of attention. It is thus based on the concept of figure–ground from Gestalt psychology. For example, in a street map with strong figure-ground contrast, the reader would be able to isolate and focus attention on individual features, like a given street, park, or lake, as well as layers of related features, like the street network.
Geovisualization or geovisualisation, also known as cartographic visualization, refers to a set of tools and techniques supporting the analysis of geospatial data through the use of interactive visualization.

A thematic map is a type of map that portrays the geographic pattern of a particular subject matter (theme) in a geographic area. This usually involves the use of map symbols to visualize selected properties of geographic features that are not naturally visible, such as temperature, language, or population. In this, they contrast with general reference maps, which focus on the location of a diverse set of physical features, such as rivers, roads, and buildings. Alternative names have been suggested for this class, such as special-subject or special-purpose maps, statistical maps, or distribution maps, but these have generally fallen out of common usage. Thematic mapping is closely allied with the field of Geovisualization.
Mark Stephen Monmonier is a Distinguished Professor of Geography and the Environment at the Maxwell School of Citizenship and Public Affairs of Syracuse University. He specializes in geography, geographic information systems, toponymy, and the history of cartography.
The International Cartographic Association (ICA) is an organization formed of national member organizations, to provide a forum for issues and techniques in cartography and geographic information science (GIScience). ICA was founded on June 9, 1959, in Bern, Switzerland. The first General Assembly was held in Paris in 1961. The mission of the International Cartographic Association is to promote the disciplines and professions of cartography and GIScience in an international context. To achieve these aims, the ICA works with national and international governmental and commercial bodies, and with other international scientific societies.

Geography is the study of the lands, features, inhabitants, and phenomena of Earth. Geography is an all-encompassing discipline that seeks an understanding of Earth and its human and natural complexities—not merely where objects are, but also how they have changed and come to be. While geography is specific to Earth, many concepts can be applied more broadly to other celestial bodies in the field of planetary science. Geography has been called "a bridge between natural science and social science disciplines."
Charles Dana Tomlin is an author, professor, and originator of Map Algebra, a vocabulary and conceptual framework for classifying ways to combine map data to produce new maps. Tomlin's teaching and research focus on the development and application of geographic information systems (GIS). He is currently a professor at the University of Pennsylvania School of Design and an adjunct professor at the Yale School of Forestry and Environmental Studies, having also taught at the Harvard Graduate School of Design and the Ohio State University School of Natural Resources. His coursework in Landscape Architecture has extensively included GIS and cartographic modeling applications.
Peter Gould was an Evan Pugh Professor Emeritus of Geography at Penn State University. Throughout his tenure at Penn State University, Gould received many awards including the Lauréat Prix International de Géographie Vautrin Lud, the Retzius Gold Medal of the Swedish Society for Anthropology and Geography, as well as an honorary Doctor of Science from the Universitaire de Strasbourg. Dr. Gould was a main contributor to the quantitative revolution in the field of Geography.
A map symbol or cartographic symbol is a graphical device used to visually represent a real-world feature on a map, working in the same fashion as other forms of symbols. Map symbols may include point markers, lines, regions, continuous fields, or text; these can be designed visually in their shape, size, color, pattern, and other graphic variables to represent a variety of information about each phenomenon being represented.
Cynthia Ann Brewer is an American cartographer, author, and professor of geography at Pennsylvania State University. Brewer's specialty relates to visibility and color theory in cartography. In 2023, she was awarded the International Cartographic Society's highest honor, the Carl Mannerfelt Gold Medal, for her distinguished contribution to the field.
Spatial citizenship describes the ability of individuals and groups to interact and participate in societal spatial decision making through the reflexive production and use of geo-media. Spatial citizens are lay users who are able to use geo-media to question existing perspectives on action in space and to produce, communicate, and negotiate alternative spatial visions.
Emanuela Casti is an Italian geographer and a cartography theorist. Considered an innovator, she has formalized a semiotic theory for the interpretation of maps in their various forms: from historical maps to cybercartography systems. She was full professor from 2001 to 2020 at the University of Bergamo (Italy) and is currently professor emeritus. In 2004 Casti founded the Diathesis Cartographic Lab, a permanent laboratory devoted to territorial analysis, cartographic innovation and experimentation and, in 2019, designed and activated the interclass master's degree, in Geourbanistica. Analisi e pianificazione territoriale, urbana, ambientale e valorizzazione del paesaggio at the University of Bergamo
Menno-Jan Kraak is a Dutch cartographer and professor of Geovisual Analytics and Cartography at the Faculty of Geoinformation Sciences and Earth Observation at the University of Twente. He is known for his work in cartography and his activities in the International Cartographic Association.
A visual variable, in cartographic design, graphic design, and data visualization, is an aspect of a graphical object that can visually differentiate it from other objects, and can be controlled during the design process. The concept was first systematized by Jacques Bertin, a French cartographer and graphic designer, and published in his 1967 book, Sémiologie Graphique. Bertin identified a basic set of these variables and provided guidance for their usage; the concept and the set of variables has since been expanded, especially in cartography, where it has become a core principle of education and practice.

Cartographic design or map design is the process of crafting the appearance of a map, applying the principles of design and knowledge of how maps are used to create a map that has both aesthetic appeal and practical function. It shares this dual goal with almost all forms of design; it also shares with other design, especially graphic design, the three skill sets of artistic talent, scientific reasoning, and technology. As a discipline, it integrates design, geography, and geographic information science.
D. R. Fraser Taylor, is Chancellor's Distinguished Research Professor of International Affairs Geography and Environmental Studies at Carleton University, Canada and a Fellow of the Royal Society of Canada. Taylor studies applications of cartography to development, including international development. He is best known for his work on Cybercartography.
Arthur Getis was an American geographer known for his significant contributions to spatial statistics and geographic information science (GIScience). With a career spanning over four decades, Getis authored more than one hundred peer-reviewed papers and book chapters, greatly influencing GIScience and geography as a whole. The Getis-Ord family of statistics, one of the most commonly used in spatial analysis, is based on his and J. Keith Ord's work and is still widely used in the creation of hot spot maps.
Technological Transition in Cartography is a seminal book by Mark Monmonier, first published in 1985. The book explores the impact of technological advancements on the evolution of the field of cartography, examining how innovations in technology have transformed the methods and practices of mapmaking. The book was created to target cartography students of the time, and sought to demonstrate the importance of viewing cartography as a method of delivering geographic information, rather than using the technology.
References
- ↑ MacEachren, Alan at www.infovis-wiki.net.
- ↑ Alan M. MacEachren List of publications from the DBLP Bibliography Server.