
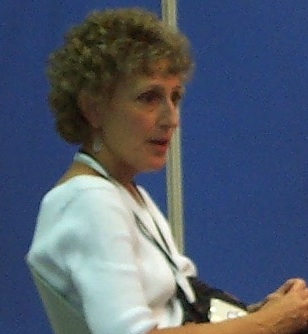
Lawrence Jay Rosenblum [1] (born 1944) is an American mathematician, and Program Director for Graphics and Visualization at the National Science Foundation.
Lawrence Jay Rosenblum [1] (born 1944) is an American mathematician, and Program Director for Graphics and Visualization at the National Science Foundation.
Rosenblum received his Ph.D. in Mathematics from the Ohio State University in 1971. [1] From 1992 to 1994, he was Liaison Scientist for Computer Science at the Office of Naval Research European Office. From 1994 he has been Director of Virtual Reality (VR) Systems and Research at the Information Technology Division of the Naval Research Laboratory (NRL) and Program Officer for Visualization and Computer Graphics at the Office of Naval Research (ONR) for ten years. Since 2004 he is Program Director for Graphics and Visualization at the National Science Foundation. [2]
Rosenblum is on the editorial boards of IEEE CG&A and Virtual Reality. He has guest edited special issues/sections of IEEE Computer Graphics and Applications (CG&A), Computer, and Presence on visualization, VR, and ARHe. He also has served on both the editorial board and advisory board of the IEEE Transactions on Visualization and Computer Graphics. He was the elected Chairman of the IEEE Technical Committee on Computer Graphics from 1994–1996 and is currently Director of the IEEE Visualization and Graphics Technical Committee.
Rosenblum received an IEEE Outstanding Contribution Certificate for initiating and co-founding the IEEE Visualization conference. He serves on the program, conference, and steering committees of numerous international conferences. He is a senior member of the IEEE and a member of the IEEE Computer Society, ACM, and Siggraph. [2]
Rosenblum's research interests include mobile augmented reality (AR), scientific and uncertainty visualization, VR displays, and applications of VR/AR systems. [2] His research group has produced advances in mobile augmented reality (AR), scientific and uncertainty visualization, VR displays, applications of VR/AR systems, and understanding human performance in graphics systems.
In the 1990s scientific visualization developed as an emerging research discipline. According to Rosenblum (1994) "new algorithms are just beginning to effectively handle the recurring scientific problem of data collected at nonuniform intervals. Volume visualization today is being extended from examining scientific data to reconstructing scattered data and representing geometrical objects without mathematically describing surfaces. Fluid dynamics visualization affects numerous scientific and engineering disciplines. It has taken its place with molecular modeling, imaging remote-sensing data, and medical imaging as a domain-specific visualization research area". [3]
Much of the progress in the field of scientific modeling, according to Rosenblum (1994), came "from using algorithms with roots in both computer graphics and computer vision. One important research thread has been the topological representation of important features. Volume and hybrid visualization now produce 3D animations of complex flows. However, while impressive 3D visualizations have been generated for scalar parameters associated with fluid dynamics, vector and especially tensor portrayal has proven more difficult. Seminal methods have appeared, but much remains to do. Great strides have also occurred in visualization systems. The area of automated selection of visualizations especially requires more work. Nonetheless, the situation has much improved, with these tools increasingly accessible to scientists and engineers". [3]
The field of visualization has undergone considerable changes since its founding in the late 1980s. From its origins in scientific visualization, new areas have arisen in the new Millennium . These include information visualization and, more recently, mobile visualization including location-aware computing, and visual analytics. Several new trends are emerging. The most important is the fusion of visualization techniques with other areas such as computer vision, data mining and data bases to promote broad-based advances. Another trend, which has not been well met to date by visualization researchers, is for algorithms to be combined with usability studies to assure that techniques and systems are well designed and that their value is quantified. This presentation will discuss current research trends in visualization as well as briefly discuss trends in U.S. research funding. [2]
Rosenblum current program responsibilities at the NSF in 2008 is "Foundations of Data and Visual Analytics (FODAVA)" project. Those involved with science, engineering, commerce, health, and national security all increasingly face the challenge of synthesizing information and deriving insight from massive, dynamic, ambiguous and possibly conflicting digital data. The goal of collecting and examining these data is not to merely acquire information, but to derive increased understanding from it and to facilitate effective decision-making. [4]
To capitalize on the opportunities provided by these data sets, a new, interdisciplinary field of science is emerging called "Data and Visual Analytics", which is defined as the science of analytical reasoning facilitated by interactive visual interfaces. Data and Visual Analytics requires interdisciplinary science, going beyond traditional scientific and information visualization to include statistics, mathematics, knowledge representation, management and discovery technologies, cognitive and perceptual sciences, decision sciences, and more. This solicitation is concerned only with a subset of the overall problem, namely the creation of the mathematical and computational sciences foundations required to transform data in ways that permit visual-based understanding. [4]
To facilitate visual-based data exploration, it is necessary to discover new algorithms that will represent and transform all types of digital data into mathematical formulations and computational models that will subsequently enable efficient, effective visualization and analytic reasoning techniques. [4]
Rosenblum has published over eighty scientific articles and has edited two books, including Scientific Visualization: Advances & Challenges.

Scientific visualization is an interdisciplinary branch of science concerned with the visualization of scientific phenomena. It is also considered a subset of computer graphics, a branch of computer science. The purpose of scientific visualization is to graphically illustrate scientific data to enable scientists to understand, illustrate, and glean insight from their data. Research into how people read and misread various types of visualizations is helping to determine what types and features of visualizations are most understandable and effective in conveying information.

Visualization or visualisation is any technique for creating images, diagrams, or animations to communicate a message. Visualization through visual imagery has been an effective way to communicate both abstract and concrete ideas since the dawn of humanity. from history include cave paintings, Egyptian hieroglyphs, Greek geometry, and Leonardo da Vinci's revolutionary methods of technical drawing for engineering and scientific purposes.
Non-photorealistic rendering (NPR) is an area of computer graphics that focuses on enabling a wide variety of expressive styles for digital art, in contrast to traditional computer graphics, which focuses on photorealism. NPR is inspired by other artistic modes such as painting, drawing, technical illustration, and animated cartoons. NPR has appeared in movies and video games in the form of cel-shaded animation as well as in scientific visualization, architectural illustration and experimental animation.
Thomas Albert "Tom" DeFanti is an American computer graphics researcher and pioneer. His work has ranged from early computer animation, to scientific visualization, virtual reality, and grid computing. He is a distinguished professor of Computer Science at the University of Illinois at Chicago, and a research scientist at the California Institute for Telecommunications and Information Technology (Calit2).
The Electronic Visualization Laboratory (EVL) is an interdisciplinary research lab and graduate studies program at the University of Illinois at Chicago, bringing together faculty, students and staff primarily from the Art and Computer Science departments of UIC. The primary areas of research are in computer graphics, visualization, virtual and augmented reality, advanced networking, and media art. Graduates of EVL either earn a Masters or Doctoral degree in Computer Science.

Patrick M. Hanrahan is an American computer graphics researcher, the Canon USA Professor of Computer Science and Electrical Engineering in the Computer Graphics Laboratory at Stanford University. His research focuses on rendering algorithms, graphics processing units, as well as scientific illustration and visualization. He has received numerous awards, including the 2019 Turing Award.
A projection augmented model is an element sometimes employed in virtual reality systems. It consists of a physical three-dimensional model onto which a computer image is projected to create a realistic looking object. Importantly, the physical model is the same geometric shape as the object that the PA model depicts.
Gregory Peter Panos is an American writer, futurist, educator, strategic planning consultant, conference / event producer, and technology evangelist in augmented reality, virtual reality, human simulation, motion capture, performance animation, 3D character animation, human-computer interaction, and user experience design.

Visual analytics is an outgrowth of the fields of information visualization and scientific visualization that focuses on analytical reasoning facilitated by interactive visual interfaces.
Jock D. Mackinlay is an American information visualization expert and Vice President of Research and Design at Tableau Software. With Stuart Card, George G. Robertson and others he invented a number of information visualization techniques.
Maxine D. Brown is an American computer scientist and retired director of the Electronic Visualization Laboratory (EVL) at the University of Illinois at Chicago (UIC). Along with Tom DeFanti and Bruce McCormick, she co-edited the 1987 NSF report, Visualization in Scientific Computing, which defined the field of scientific visualization.

Computer graphics deals with generating images and art with the aid of computers. Today, computer graphics is a core technology in digital photography, film, video games, digital art, cell phone and computer displays, and many specialized applications. A great deal of specialized hardware and software has been developed, with the displays of most devices being driven by computer graphics hardware. It is a vast and recently developed area of computer science. The phrase was coined in 1960 by computer graphics researchers Verne Hudson and William Fetter of Boeing. It is often abbreviated as CG, or typically in the context of film as computer generated imagery (CGI). The non-artistic aspects of computer graphics are the subject of computer science research.

Christopher Ray Johnson is an American computer scientist. He is a distinguished professor of computer science at the University of Utah, and founding director of the Scientific Computing and Imaging Institute (SCI). His research interests are in the areas of scientific computing and scientific visualization.
Visual computing is a generic term for all computer science disciplines dealing with images and 3D models, such as computer graphics, image processing, visualization, computer vision, virtual and augmented reality and video processing. Visual computing also includes aspects of pattern recognition, human computer interaction, machine learning and digital libraries. The core challenges are the acquisition, processing, analysis and rendering of visual information. Application areas include industrial quality control, medical image processing and visualization, surveying, robotics, multimedia systems, virtual heritage, special effects in movies and television, and computer games.
Tamara Macushla Munzner is an American-Canadian scientist. She is an expert in information visualization who works as a professor of computer science at the University of British Columbia (UBC).
Claudio Silva is a Brazilian American computer scientist and data scientist. He is a professor of computer science and engineering at the New York University Tandon School of Engineering, the head of disciplines at the NYU Center for Urban Science and Progress (CUSP) and affiliate faculty member at NYU's Courant Institute of Mathematical Sciences. He co-developed the open-source data-exploration system VisTrails with his wife Juliana Freire and many other collaborators. He is a former chair of the executive committee for the IEEE Computer Society Technical Committee on Visualization and Graphics.
The IEEE Visualization Conference (VIS) is an annual conference on scientific visualization, information visualization, and visual analytics administrated by the IEEE Computer Society Technical Committee on Visualization and Graphics. As ranked by Google Scholar's h-index metric in 2016, VIS is the highest rated venue for visualization research and the second-highest rated conference for computer graphics over all. It has an 'A' rating from the Australian Ranking of ICT Conferences, an 'A' rating from the Brazilian ministry of education, and an 'A' rating from the China Computer Federation (CCF). The conference is highly selective with generally < 25% acceptance rates for all papers.
IEEE Transactions on Visualization and Computer Graphics is a peer-reviewed scientific journal published by the IEEE Computer Society. It covers subjects related to computer graphics and visualization techniques, systems, software, hardware, and user interface issues. TVCG has been considered the top journal in the field of visualization.

Hanspeter Pfister is a Swiss computer scientist. He is the An Wang Professor of Computer Science at the Harvard John A. Paulson School of Engineering and Applied Sciences and an affiliate faculty member of the Center for Brain Science at Harvard University. His research in visual computing lies at the intersection of scientific visualization, information visualization, computer graphics, and computer vision and spans a wide range of topics, including biomedical image analysis and visualization, image and video analysis, and visual analytics in data science.

Amitabh Varshney is an Indian-born American computer scientist. He is an IEEE fellow, and serves as Dean of the University of Maryland College of Computer, Mathematical, and Natural Sciences. Before being named Dean, Varshney was the director of the University of Maryland Institute for Advanced Computer Studies (UMIACS) from 2010 to 2018.
| International | |
|---|---|
| National | |
| Academics | |
| Other | |