The Bradford protein assay (also known as the Coomassie protein assay) was developed by Marion M. Bradford in 1976.[1] It is a quick and accurate[2]spectroscopic analytical procedure used to measure the concentration of protein in a solution. The reaction is dependent on the amino acid composition of the measured proteins.
Figure 1. Coomassie brilliant blue G-250, the binding dye for the Bradford MethodColor reaction of protein and Bradford reagent
The Bradford assay, a colorimetric protein assay, is based on an absorbance shift of the dye Coomassie brilliant blue G-250. The Coomassie brilliant blue G-250 dye exists in three forms: anionic (blue), neutral (green), and cationic (red).[3] Under acidic conditions, the red form of the dye is converted into its blue form, binding to the protein being assayed. If there's no protein to bind, then the solution will remain brown. The dye forms a strong, noncovalent complex with the protein's carboxyl group by van der Waals force and amino group through electrostatic interactions.[1] During the formation of this complex, the red form of Coomassie dye first donates its free electron to the ionizable groups on the protein, which causes a disruption of the protein's native state, consequently exposing its hydrophobic pockets. These pockets in the protein's tertiary structure bind non-covalently to the non-polar region of the dye via the first bond interaction (van der Waals forces) which position the positive amine groups in proximity with the negative charge of the dye. The bond is further strengthened by the second bond interaction between the two, the ionic interaction. When the dye binds to the protein, it causes a shift from 465nm to 595nm, which is why the absorbance readings are taken at 595nm.[4]
The cationic (unbound) form is green / red and has an absorption spectrum maximum historically held to be at 465 nm. The anionic bound form of the dye which is held together by hydrophobic and ionic interactions, has an absorption spectrum maximum historically held to be at 595 nm.[5] The increase of absorbance at 595nm is proportional to the amount of bound dye, and thus to the amount (concentration) of protein present in the sample.[6]
Unlike other protein assays, the Bradford protein assay is less susceptible to interference by various chemical compounds such as sodium, potassium or even carbohydrates like sucrose, that may be present in protein samples.[2] An exception of note is elevated concentrations of detergent. Sodium dodecyl sulfate (SDS), a common detergent, may be found in protein extracts because it is used to lyse cells by disrupting the membrane lipid bilayer and to denature proteins for SDS-PAGE. While other detergents interfere with the assay at high concentration, the interference caused by SDS is of two different modes, and each occurs at a different concentration. When SDS concentrations are below critical micelle concentration (known as CMC, 0.00333%W/V to 0.0667%) in a Coomassie dye solution, the detergent tends to bind strongly with the protein, inhibiting the protein binding sites for the dye reagent. This can cause underestimations of protein concentration in solution. When SDS concentrations are above CMC, the detergent associates strongly with the green form of the Coomassie dye, causing the equilibrium to shift, thereby producing more of the blue form. This causes an increase in the absorbance at 595nm independent of protein presence.[6]
Other interference may come from the buffer used when preparing the protein sample. A high concentration of buffer will cause an overestimated protein concentration due to depletion of free protons from the solution by conjugate base from the buffer. This will not be a problem if a low concentration of protein (subsequently the buffer) is used.[6]
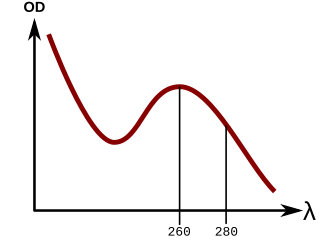
In order to measure the absorbance of a colorless compound a Bradford assay must be performed. Some colorless compounds such as proteins can be quantified at an Optical Density of 280nm due to the presence of aromatic rings such as Tryptophan, Tyrosine and Phenylalanine but if none of these amino acids are present then the absorption cannot be measured at 280nm.[7]
Advantages
Many protein-containing solutions have the highest absorption at 280nm in the spectrophotometer, the UV range. This requires spectrophotometers capable of measuring in the UV range, which many cannot. Additionally, the absorption maxima at 280nm requires that proteins contain aromatic amino acids such as tyrosine (Y), phenylalanine (F) and/or tryptophan (W). Not all proteins contain these amino acids, a fact which will skew the concentration measurements. If nucleic acids are present in the sample, they would also absorb light at 280nm, skewing the results further. By using the Bradford protein assay, one can avoid all of these complications by simply mixing the protein samples with the Coomassie brilliant blue G-250 dye (Bradford reagent) and measuring their absorbances at 595nm, which is in the visible range[8] and may be accurately measured by the use of a mobile smartphone camera.[9]
The procedure for Bradford protein assay is very easy and simple to follow. It is done in one step where the Bradford reagent is added to a test tube along with the sample. After mixing well, the mixture almost immediately changes to a blue color. When the dye binds to the proteins through a process that takes about 2 minutes, a change in the absorption maximum of the dye from 465nm to 595nm in acidic solutions occurs.[2] Additionally, protein binding triggers a metachromatic reaction, evidenced by the emergence of a species that absorbs light around 595 nm, indicative of the unprotonated form[10] This dye creates strong noncovalent bonds with the proteins, via electrostatic interactions with the amino and carboxyl groups, as well as Van Der Waals interactions. Only the molecules that bind to the proteins in solution exhibit this change in absorption, which eliminates the concern that unbound molecules of the dye might contribute to the experimentally obtained absorption reading. This process is more beneficial since it is less pricey than other methods, easy to use, and has high sensitivity of the dye for protein.[11]
After 5 minutes of incubation, the absorbance can be read at 595nm using a spectrophotometer or a mobile smartphone camera (RGBradford method).[9]
This assay is one of the fastest assays performed on proteins.[12] The total time it takes to set up and complete the assay is under 30 minutes.[13] The entire experiment is done at room temperature.
The Bradford protein assay can measure protein quantities as little as 1 to 20 μg.[14] It is an extremely sensitive technique.
The dye reagent is a stable ready to use product prepared in phosphoric acid. It can remain at room temperature for up to 2 weeks before it starts to degrade.
Protein samples usually contain salts, solvents, buffers, preservatives, reducing agents and metal chelating agents. These molecules are frequently used for solubilizing and stabilizing proteins. Other protein assay like BCA and Lowry are ineffective because molecules like reducing agents interfere with the assay.[15] Using Bradford can be advantageous against these molecules because they are compatible to each other and will not interfere.[16]
The linear graph acquired from the assay (absorbance versus protein concentration in μg/mL) can be easily extrapolated to determine the concentration of proteins by using the slope of the line.
It is a sensitive technique. It is also very simple: measuring the OD at 595nm after 5 minutes of incubation. This method can also make use of a Vis spectrophotometer[17] or a mobile smartphone camera (RGBradford method).[9]
Disadvantages
The Bradford assay is linear over a short range, typically from 0μg/mL to 2000μg/mL, often making dilutions of a sample necessary before analysis. In making these dilutions, error in one dilution is compounded in further dilutions resulting in a linear relationship that may not always be accurate.
Basic conditions and detergents, such as SDS, can interfere with the dye's ability to bind to the protein through its side chains.[12]
The reagents in this method tend to stain the test tubes. Same test tubes cannot be used since the stain would affect the absorbance reading. This method is also time sensitive. When more than one solution is tested, it is important to make sure every sample is incubated for the same amount of time for accurate comparison.[18]
A limiting factor in using Coomassie-based protein determination dyes stems from the significant variation in color yield observed across different proteins[19] This limiting factor is notably evident in collagen-rich protein samples, like pancreatic extracts, where both the Lowry and Bradford methods tend to underestimate protein content.
It is also inhibited by the presence of detergents, although this problem can be alleviated by the addition of cyclodextrins to the assay mixture.[20]
Much of the non-linearity stems from the equilibrium between two different forms of the dye which is perturbed by adding the protein. The Bradford assay linearizes by measuring the ratio of the absorbances, 595 over 450nm. This modified Bradford assay is approximately 10 times more sensitive than the conventional one.[21]
The Coomassie Blue G250 dye used to bind to the proteins in the original Bradford method readily binds to arginine and lysine groups of proteins. This is a disadvantage because the preference of the dye to bind to these amino acids can result in a varied response of the assay between different proteins. Changes to the original method, such as increasing the pH by adding NaOH or adding more dye have been made to correct this variation. Although these modifications result in a less sensitive assay, a modified method becomes sensitive to detergents that can interfere with sample.[22]
Future of Bradford Protein Assay
New modifications for an improved Bradford Protein Assay have been underway that specifically focuses on enhancing detection accuracy for collagen proteins. One notable modification involves incorporating small amounts, approximately .0035%, of sodium dodecyl sulfate (SDS). This inclusion of SDS has been shown to result in a fourfold increase in color response for three key collagen proteins—Collagen types I, III, and IV—while simultaneously decreasing the absorbance of non-collagen proteins [19].
This simple modification in the preparation of the reagent resulted in Bradford Assays to produce similar response curves for both collagen and non-collagen proteins, expanding the use of Bradford Assays in samples containing high collagen proteins.
Sample Bradford procedure
Materials
Lyophilized bovine plasma gamma globulin
Coomassie brilliant blue 1
0.15 M NaCl
Spectrophotometer and cuvettes or a mobile smartphone camera (RGBradford method).[9]
Prepare a series of standards diluted with 0.15 M NaCl to final concentrations of 0 (blank = No protein), 250, 500, 750 and 1500μg/mL. Also prepare serial dilutions of the unknown sample to be measured.
Add 100 μL of each of the above to a separate test tube (or spectrophotometer tube if using a Spectronic 20).
Add 5.0 mL of Coomassie Blue to each tube and mix by vortex, or inversion.
Adjust the spectrophotometer to a wavelength of 595nm, using the tube which contains no protein (blank).
Wait 5 minutes and read each of the standards and each of the samples at 595nm wavelength.
Plot the absorbance of the standards vs. their concentration. Compute the extinction coefficient and calculate the concentrations of the unknown samples.
Procedure (Micro Assay, 1-10 μg protein/mL)
Prepare standard concentrations of protein of 1, 5, 7.5 and 10μg/mL. Prepare a blank of NaCl only. Prepare a series of sample dilutions.
Add 100 μL of each of the above to separate tubes (use microcentrifuge tubes) and add 1.0 mL of Coomassie Blue to each tube.
Turn on and adjust a spectrophotometer to a wavelength of 595nm, and blank the spectrophotometer using 1.5 mL cuvettes or use a mobile smartphone camera (RGBradford method).[9]
Wait 2 minutes and read the absorbance of each standard and sample at 595nm.
Plot the absorbance of the standards vs. their concentration. Compute the extinction coefficient and calculate the concentrations of the unknown samples.
Using data obtained to find concentration of unknown
In summary, in order to find a standard curve, one must use varying concentrations of BSA (Bovine Serum Albumin)[2] in order to create a standard curve with concentration plotted on the x-axis and absorbance plotted on the y-axis. Only a narrow concentration of BSA is used (2-10ug/mL) in order to create an accurate standard curve.[23] Using a broad range of protein concentration will make it harder to determine the concentration of the unknown protein. This standard curve is then used to determine the concentration of the unknown protein. The following elaborates on how one goes from the standard curve to the concentration of the unknown.
First, add a line of best fit, or Linear regression and display the equation on the chart. Ideally, the R2 value will be as close to 1 as possible. R represents the sum of the square values of the fit subtracted from each data point. Therefore, if R2 is much less than one, consider redoing the experiment to get one with more reliable data.[24]
Graph 1. Actual BSA data attained from a micro scale UV-Vis Spectrophotometer
The equation displayed on the chart gives a means for calculating the absorbance and therefore concentration of the unknown samples. In Graph 1, x is concentration and y is absorbance, so one must rearrange the equation to solve for x and enter the absorbance of the measured unknown.[25] It is likely that the unknown will have absorbance numbers outside the range of the standard. These should not be included calculations, as the equation given cannot apply to numbers outside of its limitations. In a large scale, one must compute the extinction coefficient using the Beer-Lambert Law A=εLC in which A is the measured absorbance, ε is the slope of the standard curve, L is the length of the cuvette, and C is the concentration being determined.[26] In a micro scale, a cuvette may not be used and therefore one only has to rearrange to solve for x.
Table 1. Actual assay data for determine concentration of unknown based on line of best fit of the above standard curve
In order to attain a concentration that makes sense with the data, the dilutions, concentrations, and units of the unknown must be normalized (Table 1). To do this, one must divide concentration by volume of protein in order to normalize concentration and multiply by amount diluted to correct for any dilution made in the protein before performing the assay.
Gel electrophoresis is a method for separation and analysis of biomacromolecules and their fragments, based on their size and charge. It is used in clinical chemistry to separate proteins by charge or size and in biochemistry and molecular biology to separate a mixed population of DNA and RNA fragments by length, to estimate the size of DNA and RNA fragments or to separate proteins by charge.
Molecular biology is a branch of biology that seeks to understand the molecular basis of biological activity in and between cells, including biomolecular synthesis, modification, mechanisms, and interactions.
Polyacrylamide gel electrophoresis (PAGE) is a technique widely used in biochemistry, forensic chemistry, genetics, molecular biology and biotechnology to separate biological macromolecules, usually proteins or nucleic acids, according to their electrophoretic mobility. Electrophoretic mobility is a function of the length, conformation, and charge of the molecule. Polyacrylamide gel electrophoresis is a powerful tool used to analyze RNA samples. When polyacrylamide gel is denatured after electrophoresis, it provides information on the sample composition of the RNA species.
Spectrophotometry is a branch of electromagnetic spectroscopy concerned with the quantitative measurement of the reflection or transmission properties of a material as a function of wavelength. Spectrophotometry uses photometers, known as spectrophotometers, that can measure the intensity of a light beam at different wavelengths. Although spectrophotometry is most commonly applied to ultraviolet, visible, and infrared radiation, modern spectrophotometers can interrogate wide swaths of the electromagnetic spectrum, including x-ray, ultraviolet, visible, infrared, and/or microwave wavelengths.
In analytical chemistry, a calibration curve, also known as a standard curve, is a general method for determining the concentration of a substance in an unknown sample by comparing the unknown to a set of standard samples of known concentration. A calibration curve is one approach to the problem of instrument calibration; other standard approaches may mix the standard into the unknown, giving an internal standard. The calibration curve is a plot of how the instrumental response, the so-called analytical signal, changes with the concentration of the analyte.
Protein purification is a series of processes intended to isolate one or a few proteins from a complex mixture, usually cells, tissues or whole organisms. Protein purification is vital for the specification of the function, structure and interactions of the protein of interest. The purification process may separate the protein and non-protein parts of the mixture, and finally separate the desired protein from all other proteins. Ideally, to study a protein of interest, it must be separated from other components of the cell so that contaminants will not interfere in the examination of the protein of interest's structure and function. Separation of one protein from all others is typically the most laborious aspect of protein purification. Separation steps usually exploit differences in protein size, physico-chemical properties, binding affinity and biological activity. The pure result may be termed protein isolate.
Protein electrophoresis is a method for analysing the proteins in a fluid or an extract. The electrophoresis may be performed with a small volume of sample in a number of alternative ways with or without a supporting medium, namely agarose or polyacrylamide. Variants of gel electrophoresis include SDS-PAGE, free-flow electrophoresis, electrofocusing, isotachophoresis, affinity electrophoresis, immunoelectrophoresis, counterelectrophoresis, and capillary electrophoresis. Each variant has many subtypes with individual advantages and limitations. Gel electrophoresis is often performed in combination with electroblotting or immunoblotting to give additional information about a specific protein.
Coomassie brilliant blue is the name of two similar triphenylmethane dyes that were developed for use in the textile industry but are now commonly used for staining proteins in analytical biochemistry. Coomassie brilliant blue G-250 differs from Coomassie brilliant blue R-250 by the addition of two methyl groups. The name "Coomassie" is a registered trademark of Imperial Chemical Industries.
The first isolation of deoxyribonucleic acid (DNA) was done in 1869 by Friedrich Miescher. DNA extraction is the process of isolating DNA from the cells of an organism isolated from a sample, typically a biological sample such as blood, saliva, or tissue. It involves breaking open the cells, removing proteins and other contaminants, and purifying the DNA so that it is free of other cellular components. The purified DNA can then be used for downstream applications such as PCR, sequencing, or cloning. Currently, it is a routine procedure in molecular biology or forensic analyses.
Affinity chromatography is a method of separating a biomolecule from a mixture, based on a highly specific macromolecular binding interaction between the biomolecule and another substance. The specific type of binding interaction depends on the biomolecule of interest; antigen and antibody, enzyme and substrate, receptor and ligand, or protein and nucleic acid binding interactions are frequently exploited for isolation of various biomolecules. Affinity chromatography is useful for its high selectivity and resolution of separation, compared to other chromatographic methods.
Protein methods are the techniques used to study proteins. There are experimental methods for studying proteins. Computational methods typically use computer programs to analyze proteins. However, many experimental methods require computational analysis of the raw data.
The bicinchoninic acid assay, also known as the Smith assay, after its inventor, Paul K. Smith at the Pierce Chemical Company, now part of Thermo Fisher Scientific, is a biochemical assay for determining the total concentration of protein in a solution, similar to Lowry protein assay, Bradford protein assay or biuret reagent. The total protein concentration is exhibited by a color change of the sample solution from blue to purple in proportion to protein concentration, which can then be measured using colorimetric techniques. The BCA assay was patented by Pierce Chemical Company in 1989 & the patent expired in 2006.
The Lowry protein assay is a biochemical assay for determining the total level of protein in a solution. The total protein concentration is exhibited by a color change of the sample solution in proportion to protein concentration, which can then be measured using colorimetric techniques. It is named for the biochemist Oliver H. Lowry who developed the reagent in the 1940s. His 1951 paper describing the technique is the most-highly cited paper ever in the scientific literature, cited over 300,000 times.
In chemistry, the Biuret test, also known as Piotrowski's test, is a chemical test used for detecting the presence of at least two peptide bonds in a molecule. In the presence of peptides, a copper(II) ion forms mauve-colored coordination complexes in an alkaline solution. The reaction was first observed in 1833; In Poland, the biuret test is also known as Piotrowski's test in honor of the Polish physiologist Gustaw Piotrowski who independently rediscovered it in 1857. Several variants on the test have been developed, such as the BCA test and the Modified Lowry test.
In molecular biology, quantitation of nucleic acids is commonly performed to determine the average concentrations of DNA or RNA present in a mixture, as well as their purity. Reactions that use nucleic acids often require particular amounts and purity for optimum performance. To date, there are two main approaches used by scientists to quantitate, or establish the concentration, of nucleic acids in a solution. These are spectrophotometric quantification and UV fluorescence tagging in presence of a DNA dye.
An electrophoretic color marker is a chemical used to monitor the progress of agarose gel electrophoresis and polyacrylamide gel electrophoresis (PAGE) since DNA, RNA, and most proteins are colourless. The color markers are made up of a mixture of dyes that migrate through the gel matrix alongside the sample of interest. They are typically designed to have different mobilities from the sample components and to generate colored bands that can be used to assess the migration and separation of sample components.
The Qubit fluorometer is a laboratory instrument developed and distributed by Invitrogen, which is now a part of Thermo Fisher. It is used for the quantification of DNA, RNA, and protein.
Virus quantification is counting or calculating the number of virus particles (virions) in a sample to determine the virus concentration. It is used in both research and development (R&D) in academic and commercial laboratories as well as in production situations where the quantity of virus at various steps is an important variable that must be monitored. For example, the production of virus-based vaccines, recombinant proteins using viral vectors, and viral antigens all require virus quantification to continually monitor and/or modify the process in order to optimize product quality and production yields and to respond to ever changing demands and applications. Other examples of specific instances where viruses need to be quantified include clone screening, multiplicity of infection (MOI) optimization, and adaptation of methods to cell culture.
The Pierce Protein Assay is a method of protein quantification. It provides quick estimation of the protein amount in a given sample.
SDS-PAGE is a discontinuous electrophoretic system developed by Ulrich K. Laemmli which is commonly used as a method to separate proteins with molecular masses between 5 and 250 kDa. The combined use of sodium dodecyl sulfate and polyacrylamide gel eliminates the influence of structure and charge, and proteins are separated by differences in their size. At least up to 2012, the publication describing it was the most frequently cited paper by a single author, and the second most cited overall.
References
1 2 Ninfa, Alexander J; Ballou, David P; Benore, Marilee (2008). Fundamental Laboratory Approaches for Biochemistry and Biotechnology. Wiley. p.113.
↑ Bradford, Marion M. (May 1976). "A rapid and sensitive method for the quantitation of microgram quantities of protein utilizing the principle of protein-dye binding". Analytical Biochemistry. 72 (1–2): 248–254. doi:10.1006/abio.1976.9999. PMID942051.
↑ P., Ballou, David; Marilee., Benore (2010). Fundamental laboratory approaches for biochemistry and biotechnology. John Wiley. ISBN9780470087664. OCLC420027217.{{cite book}}: CS1 maint: multiple names: authors list (link)
↑ Ninfa, Ballou, Benore, Alexander J., David P., Marilee (2010). Fundamental Laboratory Approaches for Biochemistry and Biotechnology. United States of America: John Wiley & Sons, Inc. pp.110, 113. ISBN978-0-470-08766-4.{{cite book}}: CS1 maint: multiple names: authors list (link)
↑ Ninfa, Alexander J.; Ballou, David P.; Benore, Marilee (2010). Fundamental Laboratory Approaches for Biochemistry and Biotechnology. John Wiley & Sons Inc. p.113. ISBN978-0470087664.
1 2 Okutucu, Burcu; Dınçer, Ayşşe; Habib, Ömer; Zıhnıoglu, Figen (2007-08-01). "Comparison of five methods for determination of total plasma protein concentration". Journal of Biochemical and Biophysical Methods. 70 (5): 709–711. doi:10.1016/j.jbbm.2007.05.009. PMID17597224.
↑ barbosa, Helder; Slater K.H., Nigel (3 August 2009). "Protein quantification in the presence of poly(ethylene glycol) and dextran using the Bradford method". Analytical Biochemistry. 395 (1): 108–110. doi:10.1016/j.ab.2009.07.045. PMID19653991.
↑ Ninfa, Alexander J. (2010). Fundamental Laboratory Approaches for Biochemistry and Biotechnology. Wiley. pp.117–118. ISBN978-0470087664.
↑ Ninfa, Ballou (1998). Fundamental Approaches to Biochemistry and Biotechnology. Fitzgerald Science Press, Bethesda, MD. pp.114–116. ISBN978-0470087664.
↑ Ninfa, Alexander J; Ballou, David P; Benore, Marilee (2009). Fundamental Laboratory Approaches for Biochemistry and Biotechnology. Wiley. p.113.
Zor, T.; Selinger, Z. (1996), "Linearization of the Bradford protein assay increases its sensitivity: theoretical and experimental studies", Anal. Biochem., 236 (2): 302–308, doi:10.1006/abio.1996.0171, PMID8660509
This page is based on this Wikipedia article Text is available under the CC BY-SA 4.0 license; additional terms may apply. Images, videos and audio are available under their respective licenses.