Climate of Georgia (U.S. state)

Last updated
Koppen climate types of Georgia, using 1991-2020 climate normals. Koppen Climate Types Georgia.png
Köppen climate types of Georgia, using 1991-2020 climate normals.

The climate of Georgia is a humid subtropical climate, with most of the state having short, mild winters and long, hot summers. The Atlantic Ocean on the east coast of Georgia and the hill country in the north impact the state's climate. [1] Also, the Chattahoochee River divides Georgia into separate climatic regions with the mountain region to the northwest being cooler than the rest of the state; the average temperatures for the mountain region in January and July are 39 °F (4 °C) and 78 °F (26 °C) respectively. [2] Winter in Georgia is characterized by mild temperatures and little snowfall around the state, with the potential for snow and ice increasing in the northern parts of the state. Summer daytime temperatures in Georgia often exceed 95 °F (35 °C). The state experiences widespread precipitation. Tornadoes and tropical cyclones are common.

Contents

Temperatures

Most of Georgia has a sub-tropical climate, with hot and humid summers, except at the highest elevations. Weather conditions in various localities of Georgia depend on how close they are to the Atlantic Ocean or Gulf of Mexico, and their altitude. This is especially true in the mountainous areas in the northern part of the state, which are farther away from ocean waters and can be up to 4,500 feet (1,400 m) or higher above sea level. The areas near the Florida-Georgia border, extending from the Atlantic Ocean westward to the Chattahoochee River, experience the most subtropical weather, similar to that of Florida: hot, humid summers with frequent afternoon thunderstorms and mild, somewhat drier winters. The USDA Hardiness Zones for Georgia range from Zone 7A (0 °F to 5 °F) in the mountains to Zone 9B (25 °F to 30 °F) along small portions of the coast. [3]

Despite having moderate weather compared to many other states, Georgia has occasional extreme weather. The highest temperature ever recorded is 112 °F (44 °C), [4] while the lowest ever recorded is −17 °F (−27 °C). [5] Heat waves with temperatures over 100 °F (38 °C) have often been recorded.

Precipitation

Average annual precipitation for Georgia GAprecipitation.gif
Average annual precipitation for Georgia

The entire state, including the North Georgia mountains, receives moderate to heavy rain, which varies from 45 inches (1,100 mm) in central Georgia [6] to approximately 75 inches (1,900 mm) around the Northeast part of the state. [7] Georgia has had severe droughts in the past, especially in 2007. Tropical Storm Alberto in July 1994 looped across central Georgia, leading to 24-hour rainfall amounts exceeding 20 inches (510 mm) across central sections of the state. [8] It also became the wettest tropical cyclone on record for the state of Georgia, eclipsing the record set in 1929. [9] Snowfall, which occurs in most winters, increases in frequency and average amounts per year to the north.

Winter

Image of March 1993 Storm of the Century Storm of the century satellite.gif
Image of March 1993 Storm of the Century

Southern and southeast areas of the state experience snow much less frequently than other parts of Georgia. The Georgia Piedmont, sometimes referred to as the Blue Ridge province, [10] is somewhat cooler in winter than the coastal areas. The Southern areas of Piedmont may receive snow every other year, while areas close to the foothills get snow a couple of times a year averaging anywhere from a trace up 2" of annual snowfall. The biggest winter threat to the northern piedmont is freezing rain which is rain that freezes on contact. The mountains of Georgia have the coolest climate and most frequent snowfall in the state, although snowfall is less than any other part of the Appalachian Mountains. The exception to this is the mountain counties of Fannin, Gilmer, Pickens, Union, White and Rabun. The mountains can average between 4 and 18 inches annually. Surrounding counties typically average 3 to 8 inches of snow annually. Elevations over 4,000 feet can have particularly brutal winters with some storms blanketing the mountains with over a foot of snow. [11] The mountains above 3,500 feet or parts of the Appalachian trail average 10-25 inches of snow in one season. The highest mountain in Georgia, Brasstown Bald, averages 30–40 inches of snow per season. Heavy snow in the extreme northern counties is considered 5 inches (13 cm) or more of snow in a 12-hour period or 7 inches (18 cm) or more of snow in a 24-hour period". Watches for heavy snow are issued when a 50 percent or greater chance of 2 inches (5.1 cm) or more of snow falling in a 12-hour period, or 4 inches (10 cm) or more in a 24-hour period is expected. [12] [13]

Winter weather watches are issued when there is a "50 percent or greater chance of significant and damaging accumulations of ice during freezing rain situations"; these watches are normally issued 12 to 48 hours in advance. A winter storm warning for an ice storm means that icy conditions are "occurring, imminent, or have a very high probability of occurring". These warnings are usually issued when there is an 80 percent or greater chance of meeting ice storm conditions. [14]

Blizzards in Georgia are rare. The last blizzard the state had was in March 1993. [15] [16]

Winter in southern Georgia, which lasts from December to January, are much more mild. Daytime highs range from approximately 50 °F (10 °C) in the northernmost interior areas to near 70 °F (21 °C) along the coast and in the extreme south. [17]

Winters in Georgia are determined by the Pacific Ocean. During El Niño, the jet stream is located along the Southern U.S., allowing for colder and wetter conditions with greater snowfall. The opposite phase, La Niña, keeps the jet stream farther north, thus winters are warmer and drier across Georgia.

Spring

Weather during springtime in North Georgia and the mountains changes from day to day and year to year. [18] Early spring in the North Georgia Mountains can be very chilly during the day; average highs are near 62 °F (17 °C). The weather can be highly variable with temperatures ranging between 75 °F (24 °C) and 40 °F (4 °C). The rainiest time of the year is normally April, which can also be a windy month where daytime temperatures can rise to near 75 °F (24 °C) and evening temperatures fall to around 40 °F (4 °C).

Summer

Summers are hot and humid with temperatures in the afternoons that reach, on average, to near 90 °F (32 °C). Overnight lows fall to near 68 °F (20 °C) [18] and there is usually an 8 °F (4 °C) difference in temperature between the mountains and Atlanta. While humidity in North Georgia, especially in the mountains, can be high it is not as high as it is in South Georgia. Summer thunderstorms add to the humidity in the area by providing 4.5 inches (110 mm) to 5.5 inches (140 mm) of rain during the summer months.

Tropical cyclones

Tropical Storm Alberto (1994) moving into Georgia Tropical Storm Alberto (1994).JPG
Tropical Storm Alberto (1994) moving into Georgia

Although Georgia experiences many tropical cyclones, [19] it only rarely experiences a direct hurricane strike due to its fairly small coastline. The last hurricane to directly affect the Georgia coastline was Hurricane David in 1979. The last major hurricane (Category 3 or higher) to hit the Georgia coast directly was in 1898. More common are hurricanes which strike the Florida Panhandle, weaken over land, and bring tropical storm or hurricane-force winds and heavy rain to the Georgia interior (especially the southwestern areas), as well as hurricanes that come close to the Georgia coastline, brushing the coast on their way up to hit the Carolinas.

Tornadoes

Image of a tornado Dszpics1.jpg
Image of a tornado

Georgia is one of the leading states in incidents of tornadoes though they are rarely stronger than F1 . [20] Southwestern and northern sections of the state have historically reported the largest amount of tornadoes. [21] The areas closest to the Florida border report F0 and F1 tornadoes associated with summer afternoon thunderstorms. However, tornadoes of F3 intensity or greater within Georgia are uncommon, with three events reported on average each year. [22]

Fall

Georgia's autumns are normally sunny and cool. [23] September and October, the driest months of the year, qualify as "Indian Summer" weather with temperatures that are near 78 °F (26 °C) during the daytime. At night, the temperature drops to near 50 °F (10 °C). It is much cooler in November with an average high of 62 °F (17 °C) and low of 36 °F (2 °C). The first freeze of the year normally falls within November, except in the northern mountains, where it occurs in October. [18]

Statistics for selected cities

Climate data for Atlanta (Hartsfield–Jackson Int'l), 1991–2020 normals, [lower-alpha 1] extremes 1878–present [lower-alpha 2]
MonthJanFebMarAprMayJunJulAugSepOctNovDecYear
Record high °F (°C)79
(26)
81
(27)
89
(32)
93
(34)
97
(36)
106
(41)
105
(41)
104
(40)
102
(39)
98
(37)
84
(29)
79
(26)
106
(41)
Mean maximum °F (°C)70.3
(21.3)
73.5
(23.1)
80.8
(27.1)
84.7
(29.3)
89.6
(32.0)
94.3
(34.6)
95.8
(35.4)
95.9
(35.5)
91.9
(33.3)
85.0
(29.4)
77.5
(25.3)
71.5
(21.9)
97.3
(36.3)
Mean daily maximum °F (°C)54.0
(12.2)
58.2
(14.6)
65.9
(18.8)
73.8
(23.2)
81.1
(27.3)
87.1
(30.6)
90.1
(32.3)
89.0
(31.7)
83.9
(28.8)
74.4
(23.6)
64.1
(17.8)
56.2
(13.4)
73.2
(22.9)
Daily mean °F (°C)44.8
(7.1)
48.5
(9.2)
55.6
(13.1)
63.2
(17.3)
71.2
(21.8)
77.9
(25.5)
80.9
(27.2)
80.2
(26.8)
74.9
(23.8)
64.7
(18.2)
54.2
(12.3)
47.3
(8.5)
63.6
(17.6)
Mean daily minimum °F (°C)35.6
(2.0)
38.9
(3.8)
45.3
(7.4)
52.5
(11.4)
61.3
(16.3)
68.6
(20.3)
71.8
(22.1)
71.3
(21.8)
65.9
(18.8)
54.9
(12.7)
44.2
(6.8)
38.4
(3.6)
54.1
(12.3)
Mean minimum °F (°C)17.3
(−8.2)
23.2
(−4.9)
28.1
(−2.2)
36.9
(2.7)
47.6
(8.7)
59.9
(15.5)
65.6
(18.7)
64.5
(18.1)
53.4
(11.9)
38.7
(3.7)
29.2
(−1.6)
23.8
(−4.6)
15.2
(−9.3)
Record low °F (°C)−8
(−22)
−9
(−23)
10
(−12)
25
(−4)
37
(3)
39
(4)
53
(12)
55
(13)
36
(2)
28
(−2)
3
(−16)
0
(−18)
−9
(−23)
Average precipitation inches (mm)4.59
(117)
4.55
(116)
4.68
(119)
3.81
(97)
3.56
(90)
4.54
(115)
4.75
(121)
4.30
(109)
3.82
(97)
3.28
(83)
3.98
(101)
4.57
(116)
50.43
(1,281)
Average snowfall inches (cm)1.0
(2.5)
0.4
(1.0)
0.4
(1.0)
0.0
(0.0)
0.0
(0.0)
0.0
(0.0)
0.0
(0.0)
0.0
(0.0)
0.0
(0.0)
0.0
(0.0)
0.0
(0.0)
0.4
(1.0)
2.2
(5.6)
Average precipitation days (≥ 0.01 in)11.110.410.58.99.411.112.010.27.36.87.910.7116.3
Average snowy days (≥ 0.01 in)0.70.30.10.00.00.00.00.00.00.00.00.41.5
Average relative humidity (%)67.663.462.461.067.269.874.474.873.968.568.168.468.3
Average dew point °F (°C)29.3
(−1.5)
30.9
(−0.6)
38.5
(3.6)
45.7
(7.6)
56.1
(13.4)
63.7
(17.6)
67.8
(19.9)
67.5
(19.7)
62.1
(16.7)
49.6
(9.8)
41.0
(5.0)
33.1
(0.6)
48.8
(9.3)
Mean monthly sunshine hours 164.0171.7220.5261.2288.6284.8273.8258.6227.5238.5185.1164.02,738.3
Percent possible sunshine 52565967676663626168595362
Average ultraviolet index 2.84.16.17.99.19.79.99.27.45.23.32.56.4
Source 1: NOAA (relative humidity, dew point and sun 1961–1990) [25] [26] [27]
Source 2: UV Index Today (1995 to 2022) [28]
Climate data for Savannah, Georgia (Savannah/Hilton Head Int'l), 1991–2020 normals, [lower-alpha 3] extremes 1871–present [lower-alpha 4]
MonthJanFebMarAprMayJunJulAugSepOctNovDecYear
Record high °F (°C)84
(29)
87
(31)
94
(34)
95
(35)
102
(39)
104
(40)
105
(41)
104
(40)
102
(39)
97
(36)
89
(32)
83
(28)
105
(41)
Mean maximum °F (°C)77.5
(25.3)
80.9
(27.2)
84.9
(29.4)
89.1
(31.7)
94.0
(34.4)
97.5
(36.4)
98.8
(37.1)
97.6
(36.4)
94.0
(34.4)
88.6
(31.4)
83.3
(28.5)
78.2
(25.7)
99.7
(37.6)
Mean daily maximum °F (°C)61.4
(16.3)
65.1
(18.4)
71.4
(21.9)
78.2
(25.7)
84.7
(29.3)
89.6
(32.0)
92.3
(33.5)
90.8
(32.7)
86.4
(30.2)
79.0
(26.1)
70.2
(21.2)
63.7
(17.6)
77.7
(25.4)
Daily mean °F (°C)50.7
(10.4)
54.0
(12.2)
60.0
(15.6)
66.7
(19.3)
74.1
(23.4)
80.1
(26.7)
83.0
(28.3)
82.1
(27.8)
77.7
(25.4)
68.8
(20.4)
59.1
(15.1)
53.2
(11.8)
67.5
(19.7)
Mean daily minimum °F (°C)40.0
(4.4)
42.9
(6.1)
48.6
(9.2)
55.2
(12.9)
63.4
(17.4)
70.7
(21.5)
73.7
(23.2)
73.3
(22.9)
69.0
(20.6)
58.6
(14.8)
48.0
(8.9)
42.6
(5.9)
57.2
(14.0)
Mean minimum °F (°C)23.3
(−4.8)
26.5
(−3.1)
31.2
(−0.4)
39.4
(4.1)
49.8
(9.9)
62.7
(17.1)
68.6
(20.3)
67.2
(19.6)
57.1
(13.9)
42.1
(5.6)
31.4
(−0.3)
26.9
(−2.8)
21.6
(−5.8)
Record low °F (°C)3
(−16)
8
(−13)
20
(−7)
28
(−2)
39
(4)
49
(9)
61
(16)
57
(14)
43
(6)
28
(−2)
15
(−9)
9
(−13)
3
(−16)
Average precipitation inches (mm)3.28
(83)
2.80
(71)
3.50
(89)
3.39
(86)
3.62
(92)
6.65
(169)
5.75
(146)
5.46
(139)
4.35
(110)
3.72
(94)
2.39
(61)
3.21
(82)
48.12
(1,222)
Average precipitation days (≥ 0.01 in)8.57.87.96.77.312.312.412.89.96.86.88.4107.6
Average relative humidity (%)69.667.066.865.470.173.676.078.677.772.972.370.871.7
Average dew point °F (°C)37.0
(2.8)
38.8
(3.8)
45.7
(7.6)
51.6
(10.9)
60.8
(16.0)
67.8
(19.9)
71.2
(21.8)
71.6
(22.0)
67.5
(19.7)
56.5
(13.6)
48.0
(8.9)
40.5
(4.7)
54.8
(12.6)
Mean monthly sunshine hours 175.5181.0232.0275.6288.9276.0271.3245.8214.3228.6193.5174.22,756.7
Percent possible sunshine 55596271676562605865615662
Source: NOAA (relative humidity, dew point and sun 1961–1990) [29] [30] [31]

Climate change

Climate change in Georgia encompasses the effects of climate change, attributed to man-made increases in atmospheric carbon dioxide, in the U.S. state of Georgia.

Studies show that Georgia is among a string of "Deep South" states that will experience the worst effects of climate change, [32] [33] with effects including "more severe floods and drought", and higher water levels "eroding beaches, submerging low lands, and exacerbating coastal flooding." [34]

In coming decades, climate change will cause higher temperatures, and more severe flooding and droughts in the state, according to a 2016 pamphlet published by the United States Environmental Protection Agency. The temperature changes will increase the risk of heat stroke and other heat-related illnesses. [34]

See also

Notes

  1. Mean monthly maxima and minima (i.e. the highest and lowest temperature readings during an entire month or year) calculated based on data at said location from 1991 to 2020.
  2. Official records for Atlanta were kept at the Weather Bureau in downtown from October 1878 to August 1928, and at Hartsfield–Jackson Int'l since September 1928. [24]
  3. Mean monthly maxima and minima (i.e. the expected highest and lowest temperature readings at any point during the year or given month) calculated based on data at said location from 1991 to 2020.
  4. Official records for Savannah were kept at downtown from January 1871 to April 1945, Hunter Field from May 1945 to September 1950, and at Savannah/Hilton Head Int'l since October 1950. For more information, see ThreadEx.

Related Research Articles

<span class="mw-page-title-main">Climate of Virginia</span> Overview of the climate of the U.S. state of Virginia

The climate of Virginia, a state on the east coast of the United States, is considered mild compared to more northern areas of the United States such as New England and the Midwest. Most of Virginia east of the Blue Ridge mountains, the southern part of the Shenandoah Valley, and the Roanoke Valley, has a humid subtropical climate. In the mountainous areas west of the Blue Ridge, the climate is warm-summer humid continental or oceanic climate. Severe weather, in the form of tornadoes, tropical cyclones, and winter storms, impacts the state on a regular basis. Central Virginia received significant snowfall of 20 inches in December 2009.

The climate of Salt Lake City, Utah features cold and snowy winters, hot and dry summers, and modest to light seasonal rainfall. Lying in the Salt Lake Valley, the city is surrounded by mountains and the Great Salt Lake. Under the Köppen climate classification, Salt Lake City has either a Mediterranean climate (Csa) or dry-summer continental climate (Dsa) depending on which variant of the system is used, though it borders on a cold semi-arid climate (BSk) due to the city's relatively low precipitation.

<span class="mw-page-title-main">Climate of Puerto Rico</span> Predominantly tropical rainforest in the Köppen climate classification

The climate of Puerto Rico in the Köppen climate classification is predominantly tropical rainforest. Temperatures throughout the year are warm to hot, averaging near 85 °F (29 °C) in lower elevations and 70 °F (21 °C) in the mountains. Easterly trade winds pass across the island year round while the rainy season stretches from April into November. The relatively cool trade winds are blocked by the mountains of the Cordillera Central which causes rain shadows and sharp variations in the temperature and wind speed over short distances. About a quarter of the average annual rainfall for Puerto Rico occurs during tropical cyclones, which are more frequent during La Niña years.

<span class="mw-page-title-main">Climate of California</span> Overview of the climate of the U.S. state of California

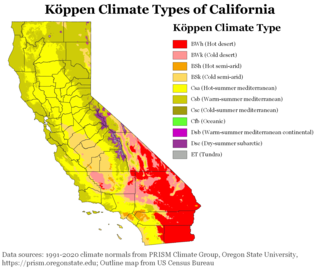
The climate of California varies widely from hot desert to alpine tundra, depending on latitude, elevation, and proximity to the Pacific Coast. California's coastal regions, the Sierra Nevada foothills, and much of the Central Valley have a Mediterranean climate, with warmer, drier weather in summer and cooler, wetter weather in winter. The influence of the ocean generally moderates temperature extremes, creating warmer winters and substantially cooler summers in coastal areas.

The climate of San Diego, California is classified as a hot-summer Mediterranean climate. The basic climate features hot, sunny, and dry summers, and cooler, wetter winters. However, San Diego is much more arid than typical Mediterranean climates, and winters are still dry compared with most other zones with this type of climate. The climate at San Diego International Airport, the location for official weather reports for San Diego, as well as the climate at most beach areas, straddles the border between BSh and BSk due to the mild winters and cool summers in these locations.

The climate of Houston is classified as a humid subtropical climate, with tropical influences. August normally ranks as the warmest month at an average temperature of 84.6 °F (29.2 °C) and January the coldest month at an average temperature of 53.1 °F (11.7 °C).

<span class="mw-page-title-main">Climate of Florida</span> Climate

The climate of the north and central parts of the US state of Florida is humid subtropical. South Florida has a tropical climate. There is a defined rainy season from May through October when air mass thundershowers that build in the heat of the day drop heavy but brief summer rainfall.

<span class="mw-page-title-main">Climate of Texas</span> Overview of the climate of the U.S. state of Texas

Texas' weather varies widely, from arid in the west to humid in the east. The huge expanse of Texas encompasses several regions with distinctly different climates: Northern Plains, Trans-Pecos Region, Texas Hill Country, Piney Woods, and South Texas. Generally speaking, the part of Texas that lies to the east of Interstate 35 is subtropical, while the portion that lies to the west of Interstate 35 is arid desert.

<span class="mw-page-title-main">Climate of the United States</span> Varies due to changes in latitude, and a range of geographic features

The climate of the United States varies due to changes in latitude, and a range of geographic features, including mountains and deserts. Generally, on the mainland, the climate of the U.S. becomes warmer the further south one travels, and drier the further west, until one reaches the West Coast.

<span class="mw-page-title-main">Climate of North Carolina</span> Overview of the climate of the U.S. state of North Carolina

North Carolina's climate varies from the Atlantic coast in the east to the Appalachian Mountain range in the west. The mountains often act as a "shield", blocking low temperatures and storms from the Midwest from entering the Piedmont of North Carolina.

<span class="mw-page-title-main">Climate of Pennsylvania</span> Overview of the climate of the U.S. state of Pennsylvania

The climate of Pennsylvania is diverse due to the multitude of geographic features found within the state. Straddling two major climate zones, the southeastern corner of Pennsylvania has the warmest climate. A portion of Greater Philadelphia lies at the southernmost tip of the humid continental climate zone, with the city proper being in the humid subtropical climate zone. Still, Philadelphia features colder, snowier winters than most locations with a humid subtropical climate. Moving west toward the mountainous interior of the state, the climate becomes markedly colder, the number of cloudy days increases, and winter snowfall amounts are greater.

<span class="mw-page-title-main">Climate of South Carolina</span> Overview of the climate of the U.S. state of South Carolina

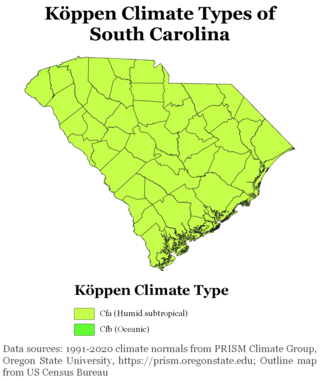
South Carolina has a humid subtropical climate, with hot summers throughout most of the state. But, an exception does occur in the Blue Ridge Mountains, as outlier pockets of an Oceanic Climate do exist. Mild winters predominate in the eastern and southern part of the state, but cool to occasionally cold winters are the standard in the northwestern area of the state, especially areas at or above 600 feet in elevation. On average, between 40 and 80 inches of precipitation falls annually across the state, potentially even in excess of 100 inches in portions of the Appalachian temperate rainforest. Tropical cyclones, and afternoon thunderstorms due to hot and humid conditions, contribute to precipitation during the summer and sometimes fall months, while extratropical cyclones contribute to precipitation during the fall, winter, and spring months. The coast experiences nearly all of their tropical weather impacts from storms coming directly from the Atlantic coast. The northwestern area of the state can receive impacts from both Atlantic basin storms moving westward from the coast and also occasionally very heavy rainfall and flooding from storms originating from the Gulf of Mexico that move inland towards the northeast after making landfall from the Florida Panhandle to Louisiana.

<span class="mw-page-title-main">Climate of New York (state)</span> Overview of the climate of the U.S. state of New York

The climate of New York (state) is generally humid continental, while the extreme southeastern portion of the state lies in the warmer humid subtropical climate zone. Winter temperatures average below freezing during January and February in much of the state of New York, but several degrees above freezing along the Atlantic coastline, including New York City.

<span class="mw-page-title-main">Climate of Massachusetts</span> Overview of the climate of Massachusetts

The climate of Massachusetts is mainly a humid continental climate, with hot, humid summers and cold, snowy winters and abundant precipitation. Massachusetts is a state located in the New England region of the northeastern United States. Most of its population of 7.0 million live in the Boston metropolitan area. The eastern half of this relatively small state is mostly urban and suburban. Massachusetts is the most populous of the six New England states and ranks third in the nation by population density and fourth by GDP per capita. Massachusetts receives about 43 inches or 1,090 millimetres of rain annually, fairly evenly distributed throughout the year, slightly wetter during the winter. Summers are warm with average high temperatures in July above 80 °F or 26.7 °C and overnight lows above 60 °F or 15.6 °C common throughout the state. Winters are cold, but generally less extreme on the coast with high temperatures in the winter averaging above freezing even in January, although areas further inland are much colder. The state does have extreme temperatures from time to time with 100 °F or 37.8 °C in the summer and temperatures below 0 °F or −17.8 °C in the winter not being unusual.

<span class="mw-page-title-main">Climate of Miami</span> Overview of the climate of Miami

The climate of Miami is classified as having a tropical monsoon climate with hot and humid summers; short, warm winters; and a marked drier season in the winter. Its sea-level elevation, coastal location, position just above the Tropic of Cancer, and proximity to the Gulf Stream shape its climate.

<span class="mw-page-title-main">Climate of Alabama</span> Overview of the climate of the U.S. state of Alabama

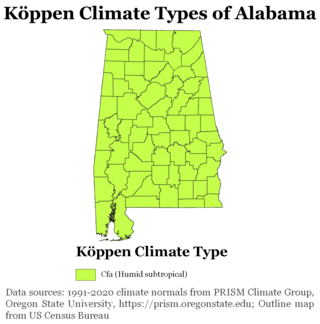
The state of Alabama is classified as humid subtropical (Cfa) under the Köppen climate classification. The state's average annual temperature is 64 °F (18 °C). Temperatures tend to be warmer in the state's southern portion with its proximity to the Gulf of Mexico, while its northern portions, especially in the Appalachian Mountains in the northeast, tend to be slightly cooler. Alabama generally has hot, humid summers and mild winters with copious precipitation throughout the year. The state receives an average of 56 inches (1,400 mm) of rainfall each year and experiences a lengthy growing season of up to 300 days in its southern portion. Hailstorms occur occasionally during the spring and summer here, but they are seldom destructive. Heavy fogs are rare, and they are confined chiefly to the coast. Thunderstorms also occur year-around. They are most common in the summer, but they are most commonly severe during the spring and late autumn. That is when destructive winds and tornadoes occur frequently, especially in the northern and central parts of the state. Central and northern Alabama are squarely within Dixie Alley, the primary area in the U.S. outside the Southern Plains with relatively high tornado risk. Alabama is ranked second in the U.S for the deadliest tornadoes. Hurricanes are quite common in the state, especially in the southern part. Major hurricanes occasionally strike the coast, such as Hurricane Frederic in September 1979 and Hurricane Ivan in September 2004; both storms resulted in significant to devastating damage in the Mobile area.

<span class="mw-page-title-main">Climate of Hawaii</span>

The U.S. state of Hawaiʻi, which covers the Hawaiian Islands, is tropical but it experiences many different climates, depending on altitude and surroundings. The island of Hawaiʻi for example hosts 4 climate groups on a surface as small as 4,028 square miles (10,430 km2) according to the Köppen climate types: tropical, arid, temperate and polar. When counting also the Köppen sub-categories – notably including the very rare cold-summer mediterranean climate – the island of Hawaiʻi hosts 10 climate zones. The islands receive most rainfall from the trade winds on their north and east flanks as a result of orographic precipitation. Coastal areas are drier, especially the south and west side or leeward sides.

<span class="mw-page-title-main">Climate of Allentown, Pennsylvania</span> Overview of the climate of Allentown, Pennsylvania, United States

The climate of Allentown, Pennsylvania is classified as a humid continental climate. Allentown's warmest month is July with a daily average temperature of 74.7 °F (23.7 °C) and the coldest month being January with a daily average of 29.4 °F (−1.4 °C). The average precipitation of Allentown is 45.35 inches (1,152 mm) per year.

<span class="mw-page-title-main">Geography of Atlanta</span>

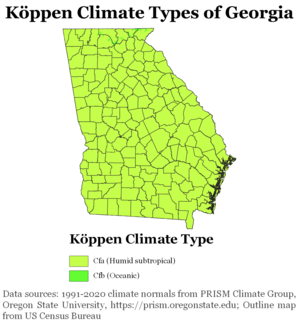
The Geography of Atlanta encompasses 132.4 square miles (342.9 km2), of which 131.7 square miles (341.1 km2) is land and 0.7 square miles (1.8 km2) is water. The city is situated among the foothills of the Appalachian Mountains, and at 1,050 feet (320 m) above mean sea level, Atlanta has the highest elevation among major cities east of the Mississippi River. Atlanta straddles the Eastern Continental Divide, such that rainwater that falls on the south and east side of the divide flows into the Atlantic Ocean, while rainwater on the north and west side of the divide flows into the Gulf of Mexico. Atlanta sits atop a ridge south of the Chattahoochee River, which is part of the ACF River Basin. Located at the far northwestern edge of the city, much of the river's natural habitat is preserved, in part by the Chattahoochee River National Recreation Area.

<span class="mw-page-title-main">Climate of New England</span> Overview of the climate of New England

The climate of New England varies greatly across its 500-mile (800 km) span from northern Maine to southern Connecticut.

References

  1. Weatherplus.com. Archived January 9, 2008, at the Wayback Machine Retrieved on 2007-12-13.
  2. city-data.com, Accessed December 10, 2007
  3. "Georgia USDA Plant Hardiness Zone Map". USDA. Retrieved November 19, 2023.
  4. USA Today (August 2006). "Each state's high temperature record". Gannett Co, Inc. Retrieved 2009-08-23.
  5. USA Today (August 2006). "Each state's low temperature record". Gannett Co, Inc. Retrieved 2009-08-23.
  6. The Weather Channel (2009). "Monthly Averages for Macon, GA". Weather Channel Interactive, Inc. Retrieved 2009-08-23.
  7. The Weather Channel (2009). "Monthly Averages for Clayton, GA". Weather Channel Interactive, Inc. Retrieved 2009-08-23.
  8. David M. Roth (2007). "Tropical Storm Alberto Rainfall Page". Hydrometeorological Prediction Center . Retrieved 2008-03-04.
  9. William H. Haggard; Thaddeus H. Bilton; Harold L. Crutcher (1973). "Maximum Rainfall from Tropical Cyclone Systems which Cross the Appalachians" (PDF). Journal of Applied Meteorology. 12 (1): 50–61. Bibcode:1973JApMe..12...50H. doi:10.1175/1520-0450(1973)012<0050:MRFTCS>2.0.CO;2 . Retrieved 2007-07-16.[ dead link ]
  10. John B. Jensen; Carlos D. Camp; Whit Gibbons (2008). Amphibians and Reptiles of Georgia. University of Georgia Press. p. 3. ISBN   978-0-8203-3111-9.
  11. "AT Snowfall Maps - weathercarrot". weathercarrot.smugmug.com. Retrieved 2019-02-10.
  12. "Winter Storms...The Deceptive Killers". Archived from the original on March 26, 2008. Retrieved July 18, 2018.
  13. Heavy Snow, Accessed December 11, 2007 Archived March 26, 2008, at the Wayback Machine
  14. Icing Conditions. Retrieved on 2007-12-11.
  15. Wind Chill & Extreme Cold. Retrieved on 2007-12-11.
  16. Winter Weather Precipitation Types. Retrieved on 2007-12-11.
  17. Climate Archived 2008-09-14 at the Wayback Machine , World66.com Accessed December 11, 2007
  18. 1 2 3 What's Typical in North and Central Georgia? Retrieved 2007-12-14.
  19. Roth, David M (May 12, 2022). "Tropical Cyclone Rainfall in the Southeastern United States". Tropical Cyclone Rainfall. United States Weather Prediction Center. Retrieved January 6, 2023.PD-icon.svg This article incorporates text from this source, which is in the public domain.
  20. "2007 North Georgia Regional Development Center Comprehensive Economic Development Strategy" (PDF). Archived from the original (PDF) on 2008-05-13. Retrieved 2008-06-24.
  21. Jonathan Atwell (2009). "Number of Tornadoes per County: 1950–2008". National Weather Service Forecast Office, Peachtree City, Georgia . Retrieved 2009-08-28.
  22. Thomas Grazulis (1999). "Georgia Tornadoes". The Tornado Project. Retrieved 2009-08-28.
  23. Climate Archived November 26, 2007, at the Wayback Machine Accessed December 14, 2007
  24. ThreadEx
  25. "Summary of Monthly Normals 1991–2020". National Oceanic and Atmospheric Administration. Archived from the original on May 4, 2021. Retrieved May 4, 2021.
  26. "NowData – NOAA Online Weather Data". National Oceanic and Atmospheric Administration. Retrieved May 4, 2021.
  27. "WMO Climatological Normals of Atlanta/Hartsfield INTL AP, GA". National Oceanic and Atmospheric Administration. Retrieved July 18, 2020.
  28. "Historical UV Index Data - Atlanta, GA". UV Index Today. Retrieved April 20, 2023.
  29. "NowData – NOAA Online Weather Data". National Oceanic and Atmospheric Administration. Retrieved May 5, 2021.
  30. "Summary of Monthly Normals 1991–2020". National Oceanic and Atmospheric Administration. Archived from the original on May 5, 2021. Retrieved May 5, 2021.
  31. "WMO Climate Normals for SAVANNAH/MUNICIPAL, GA 1961–1990". National Oceanic and Atmospheric Administration. Retrieved August 31, 2020.
  32. Meyer, Robinson (June 29, 2017). "The American South Will Bear the Worst of Climate Change's Costs". The Atlantic.
  33. Wood, Ada (November 15, 2018). "Georgia will face danger from climate change". The Signal.
  34. 1 2 "What Climate Change Means for Georgia" (PDF). United States Environmental Protection Agency. August 2016.