Color triangle

Last updated

A 1775 color triangle by Tobias Mayer. Lichtenberg color triangle Tobias Mayer 1775.jpg
A 1775 color triangle by Tobias Mayer.
The sRGB color triangle, shown as a subset of x,y space, a chromaticity space based on CIE 1931 colorimetry CIExy1931 srgb gamut.png
The sRGB color triangle, shown as a subset of x,y space, a chromaticity space based on CIE 1931 colorimetry

A color triangle is an arrangement of colors within a triangle, based on the additive or subtractive combination of three primary colors at its corners.

Contents

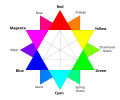
An additive color space defined by three primary colors has a chromaticity gamut that is a color triangle, when the amounts of the primaries are constrained to be nonnegative. [1] [2]

Before the theory of additive color was proposed by Thomas Young and further developed by James Clerk Maxwell and Hermann von Helmholtz, triangles were also used to organize colors, for example around a system of red, yellow, and blue primary colors. [3]

After the development of the CIE system, color triangles were used as chromaticity diagrams, including briefly with the trilinear coordinates representing the chromaticity values. [4] Since the sum of the three chromaticity values has a fixed value, it suffices to depict only two of the three values, using Cartesian co-ordinates. In the modern x,y diagram, the large triangle bounded by the imaginary primaries X, Y, and Z has corners (1,0), (0,1), and (0,0), respectively; color triangles with real primaries are often shown within this space.
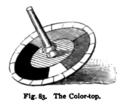
Maxwell's disc

Maxwell was intrigued by James David Forbes's use of color tops. By rapidly spinning the top, Forbes created the illusion of a single color that was a mixture of the primaries: [5]

[The] experiments of Professor J. D. Forbes, which I witnessed in 1849… [established] that blue and yellow do not make green, but a pinkish tint, when neither prevails in the combination…[and the] result of mixing yellow and blue was, I believe, not previously known.

James Clerk Maxwell, Experiments on colour, as perceived by the eye, with remarks on colour-blindness (1855), Transactions of the Royal Society of Edinburgh

Maxwell took this a step further by using a circular scale around the rim with which to measure the ratios of the primaries, choosing vermilion (V), emerald (EG), and ultramarine (U). [6]

Initially, he compared the color he observed on the spinning top with a paper of different color, in order to find a match. Later, he mounted a pair of papers, snow white (SW) and ivory black (Bk), in an inner circle, thereby creating shades of gray. By adjusting the ratio of primaries, he matched the observed gray of the inner wheel, for example: [7]

To determine the chromaticity of an arbitrary color, he replaced one of the primaries with a sample of the test color and adjusted the ratios until he found a match. For pale chrome (PC) he found . Next, he rearranged the equation to express the test color (PC, in this example) in terms of the primaries.

This would be the precursor to the color matching functions of the CIE 1931 color space, whose chromaticity diagram is shown above.

See also

Related Research Articles

<span class="mw-page-title-main">RGB color model</span> Color model based on red, green, and blue

The RGB color model is an additive color model in which the red, green and blue primary colors of light are added together in various ways to reproduce a broad array of colors. The name of the model comes from the initials of the three additive primary colors, red, green, and blue.

<span class="mw-page-title-main">Primary color</span> Sets of colors that can be mixed to produce gamut of colors

A set of primary colors or primary colours consists of colorants or colored lights that can be mixed in varying amounts to produce a gamut of colors. This is the essential method used to create the perception of a broad range of colors in, e.g., electronic displays, color printing, and paintings. Perceptions associated with a given combination of primary colors can be predicted by an appropriate mixing model that reflects the physics of how light interacts with physical media, and ultimately the retina.

<span class="mw-page-title-main">Additive color</span> Model for predicting color created by mixing visible light

Additive color or additive mixing is a property of a color model that predicts the appearance of colors made by coincident component lights, i.e. the perceived color can be predicted by summing the numeric representations of the component colors. Modern formulations of Grassmann's laws describe the additivity in the color perception of light mixtures in terms of algebraic equations. Additive color predicts perception and not any sort of change in the photons of light themselves. These predictions are only applicable in the limited scope of color matching experiments where viewers match small patches of uniform color isolated against a grey or black background.

<span class="mw-page-title-main">RGB color spaces</span> Any additive color space based on the RGB color model

An RGB color space is one of many specific additive colorimetric color spaces based on the RGB color model.

<span class="mw-page-title-main">CIELAB color space</span> Standard color space with color-opponent values

The CIELAB color space, also referred to as L*a*b*, is a color space defined by the International Commission on Illumination in 1976. It expresses color as three values: L* for perceptual lightness and a* and b* for the four unique colors of human vision: red, green, blue and yellow. CIELAB was intended as a perceptually uniform space, where a given numerical change corresponds to a similar perceived change in color. While the LAB space is not truly perceptually uniform, it nevertheless is useful in industry for detecting small differences in color.

Chromatic adaptation is the human visual system’s ability to adjust to changes in illumination in order to preserve the appearance of object colors. It is responsible for the stable appearance of object colors despite the wide variation of light which might be reflected from an object and observed by our eyes. A chromatic adaptation transform (CAT) function emulates this important aspect of color perception in color appearance models.

<span class="mw-page-title-main">Gamut</span> Color reproduction capability

In color reproduction and colorimetry, a gamut, or color gamut, is a convex set containing the colors that can be accurately represented, i.e. reproduced by an output device or measured by an input device. Devices with a larger gamut can represent more colors. Similarly, gamut may also refer to the colors within a defined color space, which is not linked to a specific device. A trichromatic gamut is often visualized as a color triangle. A less common usage defines gamut as the subset of colors contained within an image, scene or video.

The RGB chromaticity space, two dimensions of the normalized RGB space, is a chromaticity space, a two-dimensional color space in which there is no intensity information.

<span class="mw-page-title-main">Adobe RGB color space</span> Color space developed by Adobe

The Adobe RGB (1998) color space or opRGB is a color space developed by Adobe Inc. in 1998. It was designed to encompass most of the colors achievable on CMYK color printers, but by using RGB primary colors on a device such as a computer display. The Adobe RGB (1998) color space encompasses roughly 30% of the visible colors specified by the CIELAB color space – improving upon the gamut of the sRGB color space, primarily in cyan-green hues. It was subsequently standardized by the IEC as IEC 61966-2-5:1999 with a name opRGB and is used in HDMI.

<span class="mw-page-title-main">Color wheel</span> Illustrative organization of color hues

A color wheel or color circle is an abstract illustrative organization of color hues around a circle, which shows the relationships between primary colors, secondary colors, tertiary colors etc.

<span class="mw-page-title-main">Color rendering index</span> Measure of ability of a light source to reproduce colors in comparison with a standard light source

A color rendering index (CRI) is a quantitative measure of the ability of a light source to reveal the colors of various objects faithfully in comparison with a natural or standard light source. Light sources with a high CRI are desirable in color-critical applications such as neonatal care and art restoration.

<span class="mw-page-title-main">Correlated color temperature</span> Property of light based on human perception

The correlated color temperature is defined as "the temperature of the Planckian radiator whose perceived color most closely resembles that of a given stimulus at the same brightness and under specified viewing conditions."

A color model is an abstract mathematical model describing the way colors can be represented as tuples of numbers, typically as three or four values or color components. When this model is associated with a precise description of how the components are to be interpreted, taking account of visual perception, the resulting set of colors is called "color space."

<span class="mw-page-title-main">CIE 1931 color space</span> Color space defined by the CIE in 1931

The CIE 1931 color spaces are the first defined quantitative links between distributions of wavelengths in the electromagnetic visible spectrum, and physiologically perceived colors in human color vision. The mathematical relationships that define these color spaces are essential tools for color management, important when dealing with color inks, illuminated displays, and recording devices such as digital cameras. The system was designed in 1931 by the "Commission Internationale de l'éclairage", known in English as the International Commission on Illumination.

<span class="mw-page-title-main">MacAdam ellipse</span> Region of chromaticity diagram

In the study of color vision, a MacAdam ellipse is roughly a region on a chromaticity diagram which contains all colors which are indistinguishable, to the average human eye, from the color at the center of the ellipse. Specifically, it is the standard deviation of a number of experimental color matches to the central color. Assuming a bivariate normal distribution of these match points, a MacAdam ellipse thus contains about 39% of the color match points. A 2X MacAdam ellipse will contain about 86% of the match points, and a 3X MacAdam ellipse will contain about 99% of the match points. The just-noticeable differences of chromaticity is generally taken to be a 3X MacAdam ellipse. Standard Deviation Color Matching in LED lighting uses deviations relative to MacAdam ellipses to describe color precision of a light source.

Adams chromatic valence color spaces are a class of color spaces suggested by Elliot Quincy Adams. Two important Adams chromatic valence spaces are CIELUV and Hunter Lab.

In colorimetry, the CIE 1976L*, u*, v*color space, commonly known by its abbreviation CIELUV, is a color space adopted by the International Commission on Illumination (CIE) in 1976, as a simple-to-compute transformation of the 1931 CIE XYZ color space, but which attempted perceptual uniformity. It is extensively used for applications such as computer graphics which deal with colored lights. Although additive mixtures of different colored lights will fall on a line in CIELUV's uniform chromaticity diagram, such additive mixtures will not, contrary to popular belief, fall along a line in the CIELUV color space unless the mixtures are constant in lightness.

<span class="mw-page-title-main">CIE 1960 color space</span>

The CIE 1960 color space ("CIE 1960 UCS", variously expanded Uniform Color Space, Uniform Color Scale, Uniform Chromaticity Scale, Uniform Chromaticity Space) is another name for the (u, v) chromaticity space devised by David MacAdam.

<span class="mw-page-title-main">Line of purples</span> Edge of visible color

In color theory, the line of purples or purple boundary is the locus on the edge of the chromaticity diagram formed between extreme spectral red and violet. Except for these endpoints of the line, colors on the line are non-spectral. Rather, every color on the line is a unique mixture in a ratio of fully saturated red and fully saturated violet, the two spectral color endpoints of visibility on the spectrum of pure hues. Colors on the line and spectral colors are the only ones that are fully saturated in the sense that, for any point on the line, no other possible color being a mixture of red and violet is more saturated than it.

<span class="mw-page-title-main">Impossible color</span> Color that cannot be perceived under ordinary viewing conditions

Impossible colors are colors that do not appear in ordinary visual functioning. Different color theories suggest different hypothetical colors that humans are incapable of perceiving for one reason or another, and fictional colors are routinely created in popular culture. While some such colors have no basis in reality, phenomena such as cone cell fatigue enable colors to be perceived in certain circumstances that would not be otherwise.

References

  1. Arun N. Netravali; G. Haskell (1995). Digital Pictures: Representation, Compression, and Standards (second ed.). Springer. ISBN   0-306-42195-X.
  2. Werner Backhaus, Reinhold Kliegl and John Simon Werner (1998). Color Vision: Perspectives from Different Disciplines. Walter de Gruyter. ISBN   3-11-015431-5.
  3. Sarah Lowengard (2008). The Creation of Color in Eighteenth-Century Europe. Columbia University Press. ISBN   978-0-231-12454-6.
  4. Judd, Deane B. (January 1935). "A Maxwell Triangle Yielding Uniform Chromaticity Scales". JOSA . 25 (1): 24–35. doi:10.1364/JOSA.25.000024.
  5. Peter Michael Harman (1998). The Natural Philosophy of James Clerk Maxwell. Cambridge University Press. ISBN   0-521-00585-X.
  6. James Clerk Maxwell (2003). The Scientific Papers of James Clerk Maxwell. Dover Publications. ISBN   0-486-49560-4.
  7. James Clerk Maxwell (1855), Experiments on colour as perceived by the eye, with remarks on colour-blindness