Demographics of Alabama

Last updated

The 2010 census estimated Alabama's population at 4,802,740, an increase of 332,636 or 7.5% since 2000. This includes a natural increase of 87,818 (375,808 births minus 287,990 deaths) and a net migration of 73,178 people into the state. Immigration from outside the United States resulted in a net increase of 30,537 and migration within the country produced a net increase of 42,641.

Contents

As of 2000, 96.7% of Alabama residents age 5 and older speak English at home and 2.2% speak Spanish. German speakers make up only 0.4% of the population, French/French Creole at 0.3%, and Chinese at 0.1%.

In 2006 Alabama had a larger percentage of tobacco smokers than the national average, with 23% of adults smoking. [1]

The religious affiliations of adult people in Alabama are as follows: Christian – 86%, Non-Christian Faiths – 1%, Other faiths – 1%, Unaffiliated (religious "nones") – 12%

As of 2000, 25.3% of residents of the state were under 18, 6.7% were under 5, and 13.0% were over 65.

51.7% of Alabamians are female and 48.3% are male; there is a surplus of 600,000 women in the age range of 25–44.

Historical population
YearPop.±%
1800 1,250    
1810 9,046+623.7%
1820 144,317+1495.4%
1830 309,527+114.5%
1840 590,756+90.9%
1850 771,623+30.6%
1860 964,201+25.0%
1870 996,992+3.4%
1880 1,262,505+26.6%
1890 1,513,401+19.9%
1900 1,828,697+20.8%
1910 2,138,093+16.9%
1920 2,348,174+9.8%
1930 2,646,248+12.7%
1940 2,832,961+7.1%
1950 3,061,743+8.1%
1960 3,266,740+6.7%
1970 3,444,165+5.4%
1980 3,893,888+13.1%
1990 4,040,587+3.8%
2000 4,447,100+10.1%
2010 4,779,736+7.5%
2020 5,024,279+5.1%
Sources: 1820 [2] , 1910–2020 [3]

Population

The 2010 census estimated Alabama's population at 4,802,740, an increase of 332,636 or 7.5% since 2000. This includes a natural increase of 87,818 (375,808 births minus 287,990 deaths) and a net migration of 73,178 people into the state. Immigration from outside the United States resulted in a net increase of 30,537 and migration within the country produced a net increase of 42,641.

In 2006 Alabama had a larger percentage of tobacco smokers than the national average, with 23% of adults smoking. [1]

The racial makeup of the state and comparison to the prior census:

Demographics of Alabama (csv)
By race WhiteBlackAIAN*AsianNHPI*
2000 (total population)72.56%26.33%1.00%0.89%0.07%
2000 (Hispanic only)1.48%0.18%0.04%0.02%0.01%
2005 (total population)72.14%26.70%0.98%1.02%0.07%
2005 (Hispanic only)2.08%0.17%0.05%0.03%0.01%
Growth 2000–05 (total population)1.90%3.95%-0.06%17.43%4.90%
Growth 2000–05 (non-Hispanic only)1.02%3.97%-0.55%17.47%6.67%
Growth 2000–05 (Hispanic only)43.85%1.05%11.46%16.20%-2.17%
* AIAN is American Indian or Alaskan Native; NHPI is Native Hawaiian or Pacific Islander

2020 census

Autauga County racial composition
RaceNum.Perc.
White (non-Hispanic)41,58270.71%
Black or African American (non-Hispanic)11,35219.3%
Native American 1840.31%
Asian 8731.48%
Pacific Islander 220.04%
Other/Mixed 2,6754.55%
Hispanic or Latino 2,1173.6%
Baldwin County racial composition
RaceNum.Perc.
White (non-Hispanic)186,49580.47%
Black or African American (non-Hispanic)18,0017.77%
Native American 1,2910.56%
Asian 2,0290.88%
Pacific Islander 1220.05%
Other/Mixed 11,1434.81%
Hispanic or Latino 12,6865.47%
Barbour County racial composition
RaceNum.Perc.
White (non-Hispanic)11,08643.95%
Black or African American (non-Hispanic)11,85046.98%
Native American 580.23%
Asian 1030.41%
Other/Mixed 6162.44%
Hispanic or Latino 1,5105.99%
Bibb County racial composition
RaceNum.Perc.
White (non-Hispanic)16,44273.75%
Black or African American (non-Hispanic)4,39019.69%
Native American 390.17%
Asian 260.12%
Pacific Islander 90.04%
Other/Mixed 6472.9%
Hispanic or Latino 7403.32%
Blount County racial composition
RaceNum.Perc.
White (non-Hispanic)49,76484.15%
Black or African American (non-Hispanic)8261.4%
Native American 1880.32%
Asian 1740.29%
Pacific Islander 110.02%
Other/Mixed 2,4004.06%
Hispanic or Latino 5,7719.76%
Bullock County racial composition
RaceNum.Perc.
White (non-Hispanic)2,28122.02%
Black or African American (non-Hispanic)7,38871.33%
Native American 10.01%
Asian 90.09%
Pacific Islander 70.07%
Other/Mixed 1681.62%
Hispanic or Latino 5034.86%
Butler County Racial Composition
RaceNum.Perc.
White (non-Hispanic)9,67950.81%
Black or African American (non-Hispanic)8,38944.03%
Native American 230.12%
Asian 1430.75%
Pacific Islander 50.03%
Other/Mixed 5522.9%
Hispanic or Latino 2501.36%
Calhoun County racial composition
RaceNum.Perc.
White (non-Hispanic)79,51968.29%
Black or African American (non-Hispanic)25,36521.78%
Native American 3860.33%
Asian 1,1641.0%
Pacific Islander 1120.1%
Other/Mixed 4,8854.2%
Hispanic or Latino 5,0104.3%
Chambers County racial composition
RaceNum.Perc.
White (non-Hispanic)18,61653.54%
Black or African American (non-Hispanic)13,44138.65%
Native American 710.2%
Asian 3851.11%
Pacific Islander 110.03%
Other/Mixed 1,0112.91%
Hispanic or Latino 1,2373.56%
Cherokee County racial composition
RaceNum.Perc.
White (non-Hispanic)22,56390.36%
Black or African American (non-Hispanic)9873.95%
Native American 1090.44%
Asian 550.22%
Pacific Islander 10.0%
Other/Mixed 8563.43%
Hispanic or Latino 4001.6%
Chilton County racial composition
RaceNum.Perc.
White (non-Hispanic)34,87877.48%
Black or African American (non-Hispanic)4,0408.97%
Native American 1120.25%
Asian 1760.39%
Pacific Islander 50.01%
Other/Mixed 1,3853.08%
Hispanic or Latino 4,4189.81%
Choctaw County Racial Composition
RaceNum.Perc.
White (non-Hispanic)7,03955.58%
Black or African American (non-Hispanic)5,21741.19%
Native American 240.19
Asian 190.15%
Other/Mixed 2532.0%
Hispanic or Latino 1130.89%
Clarke County Racial Composition
RaceNum.Perc.
White (non-Hispanic)11,97051.85%
Black or African American (non-Hispanic)10,22344.28%
Native American 740.32%
Asian 910.39%
Pacific Islander 10.0%
Other/Mixed 5222.26%
Hispanic or Latino 2060.89%
Clay County racial composition
RaceNum.Perc.
White (non-Hispanic)11,26179.1%
Black or African American (non-Hispanic)1,94213.64%
Native American 450.32%
Asian 460.32%
Pacific Islander 40.03%
Other/Mixed 4893.43%
Hispanic or Latino 4493.15%
Cleburne County racial composition
RaceNum.Perc.
White (non-Hispanic)13,74091.26%
Black or African American (non-Hispanic)4573.04%
Native American 420.28%
Asian 210.14%
Pacific Islander 20.01%
Other/Mixed 5103.39%
Hispanic or Latino 2841.89%
Coffee County racial composition
RaceNum.Perc.
White (non-Hispanic)35,75966.88%
Black or African American (non-Hispanic)8,64316.17%
Native American 4050.76%
Asian 8921.67%
Pacific Islander 570.11%
Other/Mixed 2,8225.28%
Hispanic or Latino 4,8879.14%
Colbert County racial composition
RaceNum.Perc.
White (non-Hispanic)43,24175.56%
Black or African American (non-Hispanic)9,22216.11%
Native American 2230.39%
Asian 4320.75%
Pacific Islander 90.02%
Other/Mixed 2,3684.14%
Hispanic or Latino 1,7323.03%
Conecuh County Racial Composition
RaceNum.Perc.
White (non-Hispanic)5,83550.31%
Black or African American (non-Hispanic)5,09643.94%
Native American 710.61%
Asian 330.28%
Other/Mixed 3062.64%
Hispanic or Latino 2562.21%
Coosa County racial composition
RaceNum.Perc.
White (non-Hispanic)6,80765.53%
Black or African American (non-Hispanic)3,00028.88%
Native American 250.24%
Asian 80.08%
Other/Mixed 3463.33%
Hispanic or Latino 2011.94%
Covington County racial composition
RaceNum.Perc.
White (non-Hispanic)30,65781.6%
Black or African American (non-Hispanic)4,56312.15%
Native American 1400.37%
Asian 2400.64%
Other/Mixed 1,3163.5%
Hispanic or Latino 6541.74%
Crenshaw County racial composition
RaceNum.Perc.
White (non-Hispanic)9,33370.74%
Black or African American (non-Hispanic)3,08523.38%
Native American 480.36%
Asian 830.63%
Pacific Islander 20.02%
Other/Mixed 4563.46%
Hispanic or Latino 1871.42%
Cullman County racial composition
RaceNum.Perc.
White (non-Hispanic)78,29889.11%
Black or African American (non-Hispanic)9141.04%
Native American 2870.33%
Asian 5220.59%
Pacific Islander 640.07%
Other/Mixed 3,6354.14%
Hispanic or Latino 4,1464.72%
Dale County racial composition
RaceNum.Perc.
White (non-Hispanic)32,60266.09%
Black or African American (non-Hispanic)10,10020.48%
Native American 2170.44%
Asian 6481.31%
Pacific Islander 420.09%
Other/Mixed 2,4634.99%
Hispanic or Latino 3,2546.6%
Dallas County Racial Composition
RaceNum.Perc.
White (non-Hispanic)10,36326.94%
Black or African American (non-Hispanic)26,81269.71%
Native American 560.15%
Asian 1450.38%
Pacific Islander 120.03%
Other/Mixed 7782.02%
Hispanic or Latino 2960.77%
DeKalb County racial composition
RaceNum.Perc.
White (non-Hispanic)54,52976.15%
Black or African American (non-Hispanic)1,0191.42%
Native American 7151.0%
Asian 2370.33%
Pacific Islander 160.02%
Other/Mixed 3,3484.68%
Hispanic or Latino 11,74416.4%
Elmore County racial composition
RaceNum.Perc.
White (non-Hispanic)62,54071.09%
Black or African American (non-Hispanic)18,12620.6%
Native American 2700.31%
Asian 6690.76%
Pacific Islander 280.03%
Other/Mixed 3,5514.04%
Hispanic or Latino 2,7933.17%
Escambia County racial composition
RaceNum.Perc.
White (non-Hispanic)22,00459.86%
Black or African American (non-Hispanic)10,92229.71%
Native American 1,4884.05%
Asian 1080.29%
Pacific Islander 220.06%
Other/Mixed 1,4623.98%
Hispanic or Latino 7512.04%
Etowah County racial composition
RaceNum.Perc.
White (non-Hispanic)77,73175.15%
Black or African American (non-Hispanic)14,99914.5%
Native American 3320.32%
Asian 9210.89%
Pacific Islander 390.04%
Other/Mixed 4,5194.37%
Hispanic or Latino 4,8954.73%
Fayette County racial composition
RaceNum.Perc.
White (non-Hispanic)13,55283.03%
Black or African American (non-Hispanic)1,72010.54%
Native American 430.26%
Asian 490.3%
Pacific Islander 10.01%
Other/Mixed 5603.43%
Hispanic or Latino 3962.43%
Franklin County racial composition
RaceNum.Perc.
White (non-Hispanic)23,58173.43%
Black or African American (non-Hispanic)1,1393.55%
Native American 1280.4%
Asian 670.21%
Pacific Islander 20.01%
Other/Mixed 9372.92%
Hispanic or Latino 6,25919.49%
Geneva County racial composition
RaceNum.Perc.
White (non-Hispanic)21,65481.23%
Black or African American (non-Hispanic)2,2318.37%
Native American 1660.62%
Asian 860.32%
Pacific Islander 70.03%
Other/Mixed 1,2194.57%
Hispanic or Latino 1,2964.86%
Greene County racial composition
RaceNum.Perc.
White (non-Hispanic)1,28516.62%
Black or African American (non-Hispanic)6,22780.56%
Native American 50.06%
Asian 70.09%
Other/Mixed 1451.88%
Hispanic or Latino 610.79%
Hale County racial composition
RaceNum.Perc.
White (non-Hispanic)5,97240.39%
Black or African American (non-Hispanic)8,31356.23%
Native American 340.23%
Asian 180.12%
Pacific Islander 50.03%
Other/Mixed 2941.99%
Hispanic or Latino 1491.01%
Henry County racial composition
RaceNum.Perc.
White (non-Hispanic)11,84269.07%
Black or African American (non-Hispanic)4,23224.68%
Native American 500.29%
Asian 730.43%
Other/Mixed 6153.59%
Hispanic or Latino 3341.95%
Houston County racial composition
RaceNum.Perc.
White (non-Hispanic)68,25163.67%
Black or African American (non-Hispanic)28,23226.34%
Native American 3210.3%
Asian 1,2601.18%
Pacific Islander 590.06%
Other/Mixed 4,5984.29%
Hispanic or Latino 4,4814.18%
Jackson County racial composition
RaceNum.Perc.
White (non-Hispanic)45,12385.82%
Black or African American (non-Hispanic)1,6243.09%
Native American 6801.29%
Asian 2140.41%
Pacific Islander 20.0%
Other/Mixed 3,2556.19%
Hispanic or Latino 1,6813.2%
Jefferson County racial composition
RaceNum.Perc.
White (non-Hispanic)324,25248.06%
Black or African American (non-Hispanic)280,11241.52%
Native American 1,2070.18%
Asian 13,0431.95%
Pacific Islander 3110.05%
Other/Mixed 20,9403.1%
Hispanic or Latino 34,8565.17%
Lamar County racial composition
RaceNum.Perc.
White (non-Hispanic)11,92485.34%
Black or African American (non-Hispanic)1,42110.17%
Native American 280.2%
Asian 60.04%
Pacific Islander 20.03%
Other/Mixed 3822.73%
Hispanic or Latino 2081.49%
Lauderdale County Racial Composition
RaceNum.Perc.
White (non-Hispanic)76,49181.75%
Black or African American (non-Hispanic)9,1649.79%
Native American 2950.32%
Asian 7480.8%
Pacific Islander 310.03%
Other/Mixed 3,7574.02%
Hispanic or Latino 3,0783.29%
Lawrence County racial composition
RaceNum.Perc.
White (non-Hispanic)24,71474.73%
Black or African American (non-Hispanic)3,3029.98%
Native American 1,4404.35%
Asian 840.25%
Pacific Islander 70.02%
Other/Mixed 2,6317.96%
Hispanic or Latino 8952.71%
Lee County racial composition
RaceNum.Perc.
White (non-Hispanic)109,79563.01%
Black or African American (non-Hispanic)39,25222.53%
Native American 3650.21%
Asian 8,5444.9%
Pacific Islander 1080.06%
Other/Mixed 7,0424.04%
Hispanic or Latino 9,1355.24%
Limestone County racial composition
RaceNum.Perc.
White (non-Hispanic)75,69273.08%
Black or African American (non-Hispanic)13,17712.72%
Native American 4580.44%
Asian 1,8571.79%
Pacific Islander 700.07%
Other/Mixed 5,0684.89%
Hispanic or Latino 7,2487.0%
Lowndes County Racial Composition
RaceNum.Perc.
White (non-Hispanic)2,80727.22%
Black or African American (non-Hispanic)7,14969.33%
Native American 90.09%
Asian 150.15%
Other/Mixed 1911.85%
Hispanic or Latino 1401.36%
Macon County Racial Composition
RaceNum.Perc.
White (non-Hispanic)3,18716.32%
Black or African American (non-Hispanic)15,39578.82%
Native American 480.25%
Asian 740.38%
Pacific Islander 40.02%
Other/Mixed 4632.37%
Hispanic or Latino 3611.85%
Madison County racial composition
RaceNum.Perc.
White (non-Hispanic)237,49761.19%
Black or African American (non-Hispanic)91,07923.46%
Native American 2,1320.55%
Asian 10,1792.62%
Pacific Islander 4500.12%
Other/Mixed 21,8805.64%
Hispanic or Latino 24,9366.42%
Marengo County Racial Composition
RaceNum.Perc.
White (non-Hispanic)8,37543.34%
Black or African American (non-Hispanic)10,13352.44%
Native American 60.03%
Asian 540.28%
Pacific Islander 10.01%
Other/Mixed 3862.0%
Hispanic or Latino 3681.9%
Marion County racial composition
RaceNum.Perc.
White (non-Hispanic)26,09388.93%
Black or African American (non-Hispanic)1,0943.73%
Native American 820.28%
Asian 750.26%
Pacific Islander 140.05%
Other/Mixed 1,1203.82%
Hispanic or Latino 8632.94%
Marshall County racial composition
RaceNum.Perc.
White (non-Hispanic)74,66676.49%
Black or African American (non-Hispanic)2,2932.35%
Native American 4180.43%
Asian 5790.59%
Pacific Islander 1280.13%
Other/Mixed 3,8703.96%
Hispanic or Latino 15,65816.04%
Mobile County racial composition
RaceNum.Perc.
White (non-Hispanic)226,70354.65%
Black or African American (non-Hispanic)145,43535.06%
Native American 3,7430.9%
Asian 8,5152.05%
Pacific Islander 2160.05%
Other/Mixed 16,7724.04%
Hispanic or Latino 13,4253.24%
Monroe County Racial Composition
RaceNum.Perc.
White (non-Hispanic)10,33452.27%
Black or African American (non-Hispanic)8,25341.74%
Native American 2811.42%
Asian 880.45%
Other/Mixed 6093.08%
Hispanic or Latino 2071.05%
Montgomery County racial composition
RaceNum.Perc.
White (non-Hispanic)73,35432.04%
Black or African American (non-Hispanic)129,80156.69%
Native American 3640.16%
Asian 7,9523.47%
Pacific Islander 1190.05%
Other/Mixed 6,6802.92%
Hispanic or Latino 10,6844.67%
Morgan County racial composition
RaceNum.Perc.
White (non-Hispanic)88,23871.49%
Black or African American (non-Hispanic)15,30712.4%
Native American 6310.51%
Asian 8290.67%
Pacific Islander 790.06%
Other/Mixed 5,9604.83%
Hispanic or Latino 12,37710.03%
Perry County racial composition
RaceNum.Perc.
White (non-Hispanic)2,34527.55%
Black or African American (non-Hispanic)5,91469.49%
Native American 150.18%
Asian 100.12%
Pacific Islander 10.01%
Other/Mixed 1371.61%
Hispanic or Latino 891.05%
Pickens County racial composition
RaceNum.Perc.
White (non-Hispanic)10,06652.64%
Black or African American (non-Hispanic)7,44838.95%
Native American 230.12%
Asian 780.41%
Other/Mixed 4552.38%
Hispanic or Latino 1,0535.51%
Pike County racial composition
RaceNum.Perc.
White (non-Hispanic)18,03654.64%
Black or African American (non-Hispanic)12,06836.56%
Native American 1690.51%
Asian 5771.75%
Pacific Islander 90.03%
Other/Mixed 1,2453.77%
Hispanic or Latino 9052.74%
Randolph County racial composition
RaceNum.Perc.
White (non-Hispanic)16,62975.7%
Black or African American (non-Hispanic)3,81417.36%
Native American 500.23%
Asian 860.39%
Pacific Islander 10.0%
Other/Mixed 7823.56%
Hispanic or Latino 6052.75%
Russell County racial composition
RaceNum.Perc.
White (non-Hispanic)26,67945.08%
Black or African American (non-Hispanic)25,93043.81%
Native American 1800.3%
Asian 4080.69%
Pacific Islander 1280.22%
Other/Mixed 2,6634.5%
Hispanic or Latino 3,1955.4%
St. Clair County racial composition
RaceNum.Perc.
White (non-Hispanic)74,96282.28%
Black or African American (non-Hispanic)8,6179.46%
Native American 2490.27%
Asian 6550.72%
Pacific Islander 200.02%
Other/Mixed 4,0254.42%
Hispanic or Latino 2,5752.83%
Shelby County racial composition
RaceNum.Perc.
White (non-Hispanic)162,71272.96%
Black or African American (non-Hispanic)28,71112.87%
Native American 4780.21%
Asian 5,1142.29%
Pacific Islander 910.04%
Other/Mixed 9,4584.24%
Hispanic or Latino 16,4607.38%
Sumter County Racial Composition
RaceNum.Perc.
White (non-Hispanic)2,93723.79%
Black or African American (non-Hispanic)8,95572.54%
Native American 260.21%
Asian 1020.83%
Pacific Islander 30.02%
Other/Mixed 1911.55%
Hispanic or Latino 1311.06%
Talladega County racial composition
RaceNum.Perc.
White (non-Hispanic)50,73261.76%
Black or African American (non-Hispanic)26,34032.06%
Native American 1840.22%
Asian 3950.48%
Pacific Islander 270.03%
Other/Mixed 2,6923.28%
Hispanic or Latino 1,7792.17%
Tallapoosa County racial composition
RaceNum.Perc.
White (non-Hispanic)28,25268.39%
Black or African American (non-Hispanic)10,36625.09%
Native American 840.2%
Asian 2220.54%
Other/Mixed 1,2433.01%
Hispanic or Latino 1,1442.77%
Tuscaloosa County, Alabama - Demographic Profile(NH = Non-Hispanic)
Race / EthnicityPop 2010Pop 2020% 2010% 2020
White alone (NH)126,611134,88065.04%59.41%
Black or African American alone (NH)57,40168,77929.49%30.29%
Native American or Alaska Native alone (NH)4554200.23%0.18%
Asian alone (NH)2,2933,2411.18%1.43%
Pacific Islander alone (NH)76940.04%0.04%
Some Other Race alone (NH)1367920.07%0.35%
Mixed Race/Multi-Racial (NH)1,7356,5320.89%2.88%
Hispanic or Latino (any race)5,94912,2983.06%5.42%
Total194,656227,036100.00%100.00%
Walker County racial composition
RaceNum.Perc.
White (non-Hispanic)56,39486.31%
Black or African American (non-Hispanic)3,8895.95%
Native American 1870.29%
Asian 2830.43%
Pacific Islander 20.0%
Other/Mixed 2,4353.73%
Hispanic or Latino 2,1523.29%
Washington County Racial Composition
RaceNum.Perc.
White (non-Hispanic)10,26766.72%
Black or African American (non-Hispanic)3,31821.56%
Native American 1,1027.16%
Asian 140.09%
Pacific Islander 20.01%
Other/Mixed 5473.55%
Hispanic or Latino 1380.9%
Wilcox County racial composition
RaceNum.Perc.
White (non-Hispanic)2,86627.04%
Black or African American (non-Hispanic)7,42570.05%
Native American 110.1%
Asian 70.07%
Pacific Islander 50.05%
Other/Mixed 1741.64%
Hispanic or Latino 1121.06%
Winston County racial composition
RaceNum.Perc.
White (non-Hispanic)21,59891.75%
Black or African American (non-Hispanic)1310.56%
Native American 830.35%
Asian 580.25%
Pacific Islander 90.04%
Other/Mixed 8463.59%
Hispanic or Latino 8153.46%

Birth data

Note: Births in table don't add up, because Hispanics are counted both by their ethnicity and by their race, giving a higher overall number.

Live Births by Single Race/Ethnicity of Mother
Race 2013 [4] 2014 [5] 2015 [6] 2016 [7] 2017 [8] 2018 [9] 2019 [10] 2020 [11] 2021 [12] 2022 [13]
White:38,971 (67.0%)39,578 (66.6%)39,845 (66.8%).....................
> Non-Hispanic White 35,086 (60.3%)35,929 (60.5%)35,826 (60.1%)34,899 (59.0%)34,377 (58.3%)33,776 (58.5%)33,394 (57.0%)32,672 (56.7%)33,775 (58.2%)33,725 (58.0%)
Black 18,014 (31.0%)18,417 (31.0%)18,429 (30.9%)17,695 (29.9%)17,963 (30.5%)17,597 (30.5%)18,197 (31.0%)17,746 (30.8%)16,511 (28.4%)16,067 (27.6%)
Asian 973 (1.7%)1,227 (2.1%)1,193 (2.0%)986 (1.7%)950 (1.6%)903 (1.6%)886 (1.5%)836 (1.5%)852 (1.5%)782 (1.3%)
American Indian 209 (0.3%)200 (0.3%)190 (0.3%)150 (0.2%)175 (0.3%)148 (0.2%)188 (0.3%)133 (0.2%)155 (0.3%)187 (0.3%)
Hispanic (of any race)4,002 (6.9%)4,019 (6.8%)4,295 (7.2%)4,580 (7.7%)4,546 (7.7%)4,403 (7.6%)4,910 (8.4%)5,233 (9.1%)5,648 (9.7%)6,231 (10.7%)
Total Alabama58,167 (100%)59,422 (100%)59,657 (100%)59,151 (100%)58,941 (100%)57,761 (100%)58,615 (100%)57,647 (100%)58,054 (100%)58,149 (100%)

Ancestry

Largest ancestry groups in Alabama by county Alabama ancestry map.png
Largest ancestry groups in Alabama by county

[14] [15]

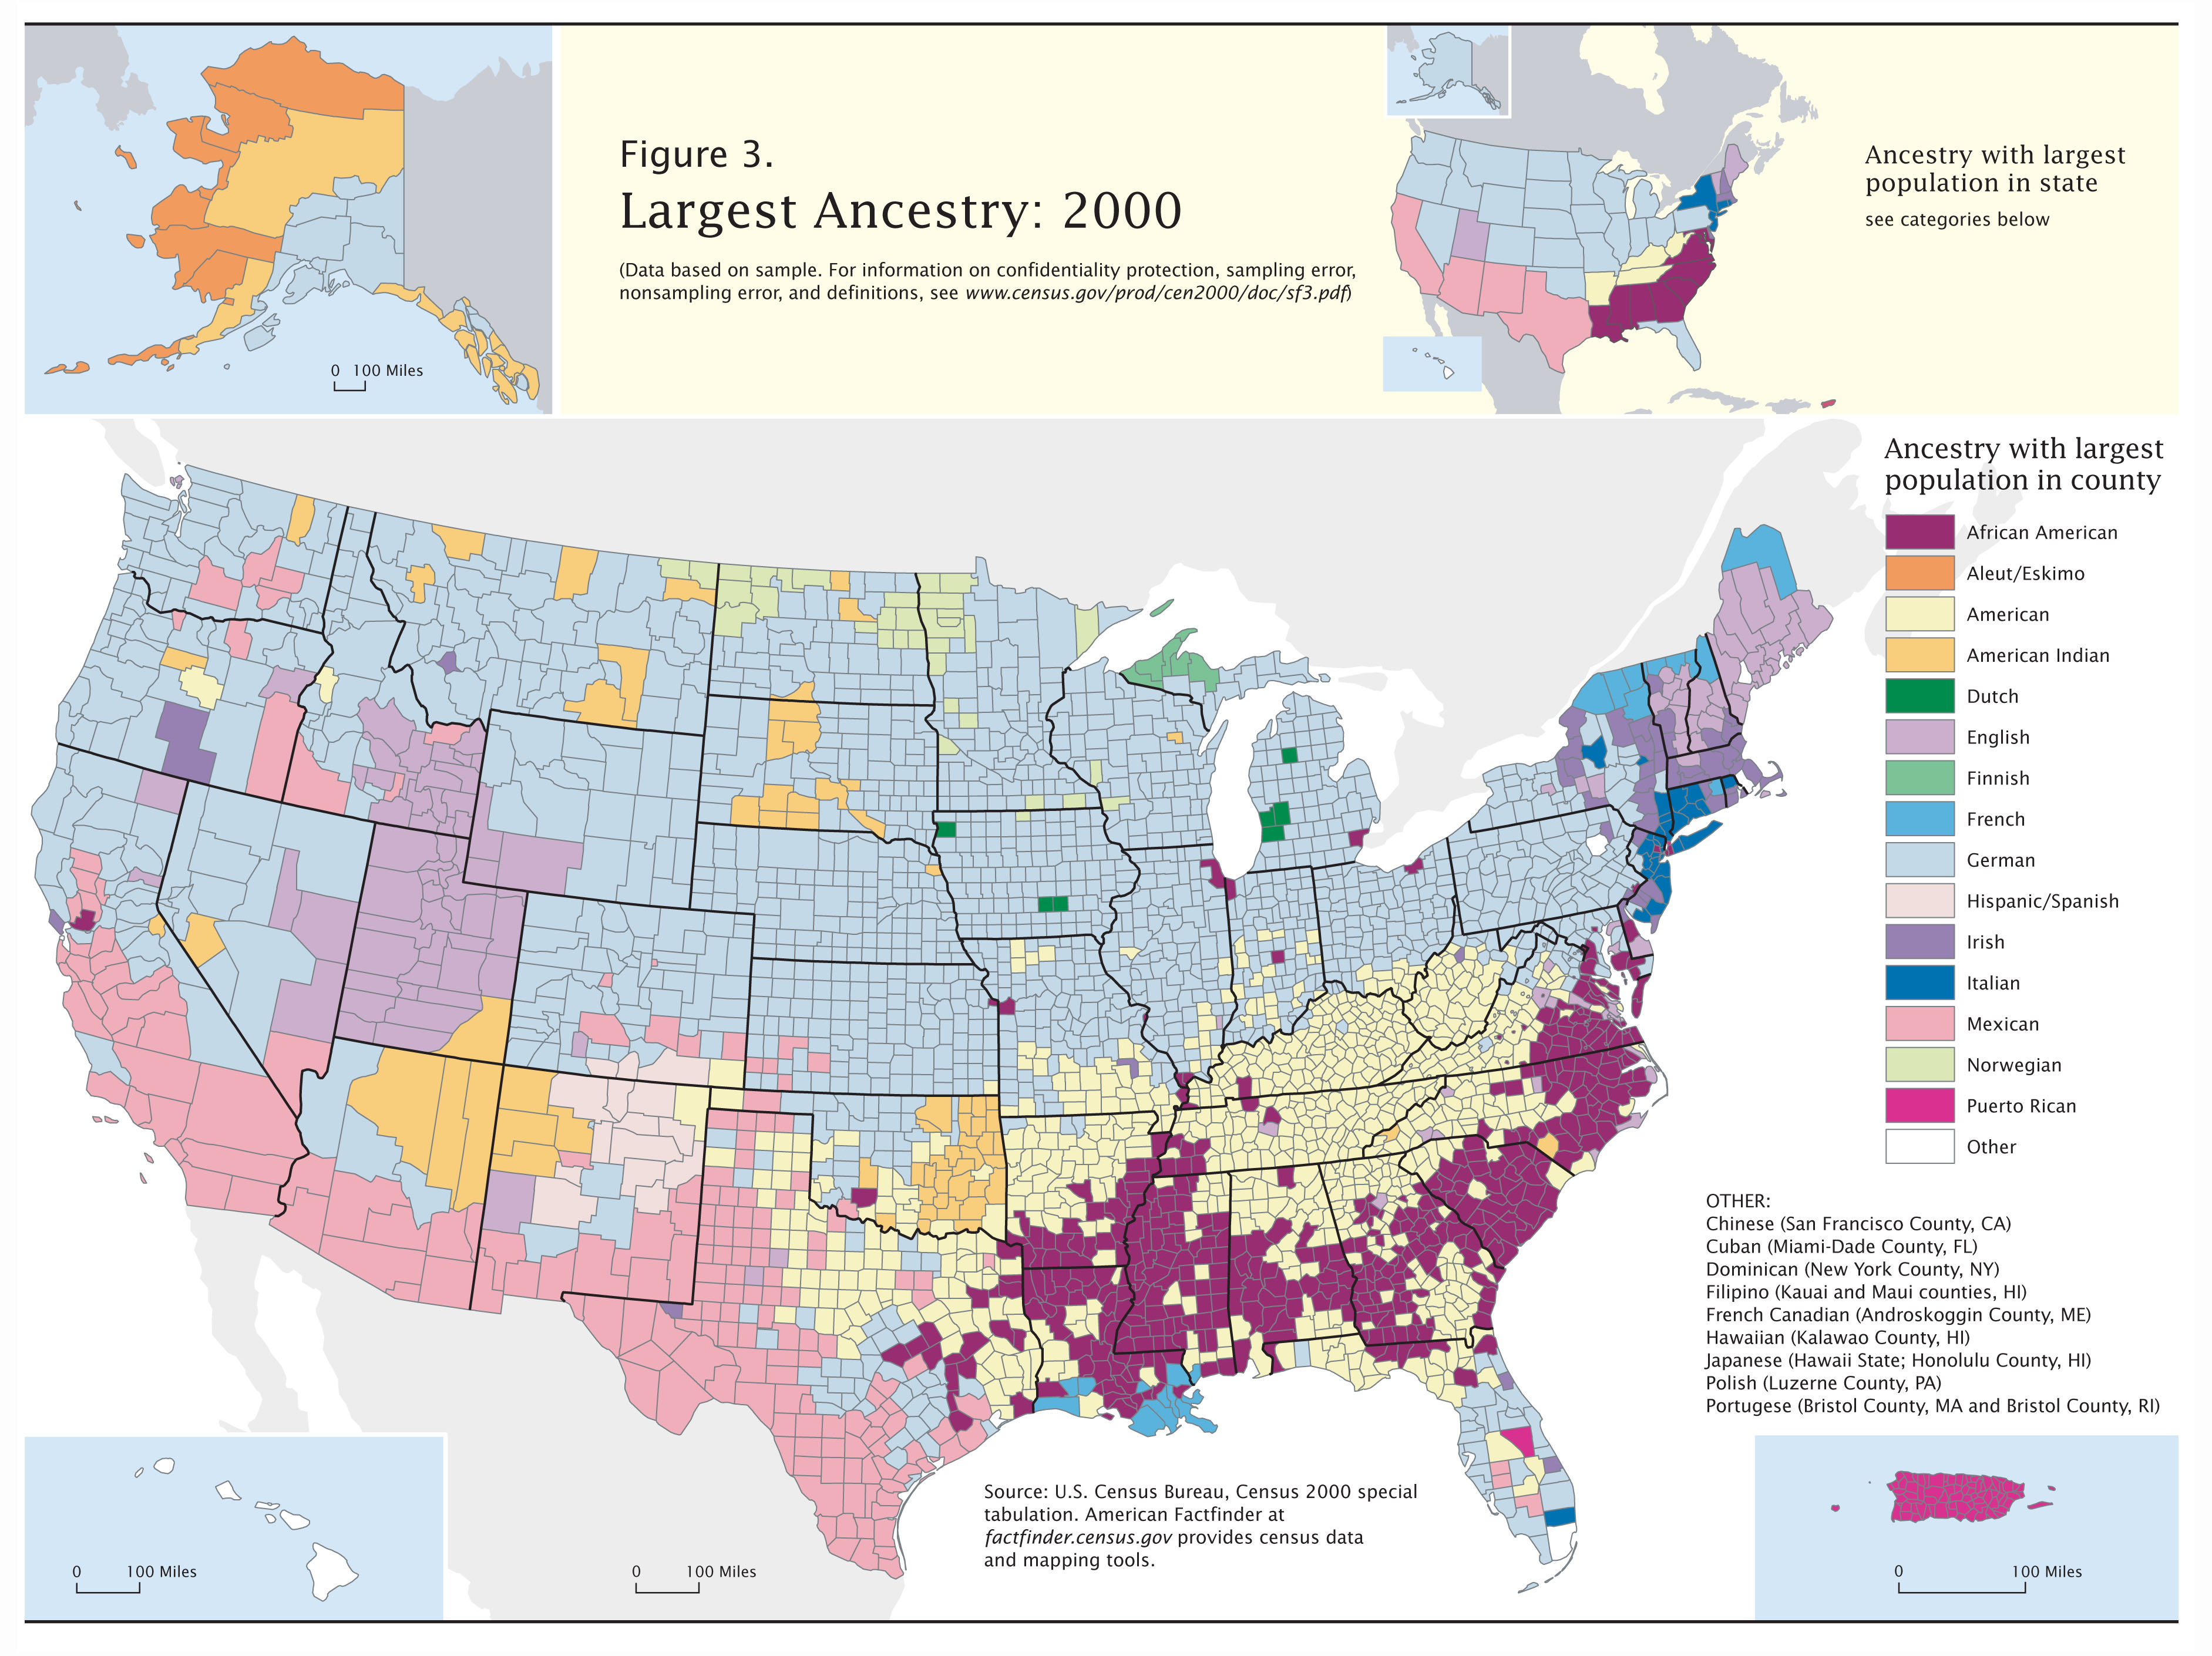
Historically, African Americans were brought to Alabama as slaves, in greatest numbers in the cotton-producing plantation region known as the Black Belt. This region remains predominantly African American, where many freedmen settled to work at agriculture after the Civil War. The northern part of the state, originally settled by small farmers with fewer slaves, is predominantly European American. The Port of Mobile, founded by the French and subsequently controlled by England, Spain, and the United States, has long had an ethnically diverse population. It has long served as an entry point for various groups settling in other parts of the state. Those citing "American" ancestry in Alabama are of overwhelmingly English extraction, however most English Americans identify simply as having American ancestry because their roots have been in North America for so long, in many cases since the early sixteen hundreds. Demographers estimate that a minimum of 20–23% of people in Alabama are of predominantly English ancestry and state that the figure is probably much higher. In the 1980 census 1,139,976 people in Alabama cited that they were of English ancestry out of a total state population of 2,824,719 making them 41% of the state at the time and the largest ethnic group. [16] [17] [18] [19] [20] There are also many more people in Alabama of Scots-Irish origins than are self-reported. [21] Many people in Alabama claim Irish ancestry because of the term "Scots-Irish", but most of the time in Alabama this term is used for those with Scottish roots, rather than Irish. [22] Alabama is home to the Cherokee, Chickasaw, Choctaw, and Creek Native American tribes. [23] Alabama has a growing Hispanic population. [24] Mexicans are the largest Latino ethnic group in Alabama. Alabama is also home to Guatemalans, Puerto Ricans, Colombians, Brazilians, Salvadorians, and Panamanians. [25]

Ancestries

Ancestry [26] Number (As of 2022)%
American594,43111.7
Arab15,6630.3
Czech4,9380.1
Danish4,9940.1
Dutch21,9990.4
English617,11912.2
French (except Basque)62,7791.2
French Canadian8,4820.2
German321,3076.3
Greek8,2870.2
Hungarian4,2770.1
Irish387,8857.6
Italian91,5161.8
Lithuanian1,4550.0
Norwegian18,3310.4
Polish29,2250.6
Portuguese3,1770.1
Russian8,1690.2
Scotch-Irish64,5131.3
Scottish105,3002.1
Slovak1,7160.0
Subsaharan African42,8560.8
Swedish18,1600.4
Swiss4,1450.1
Ukrainian3,8440.1
Welsh21,8240.4
West Indian (excluding Hispanic origin groups)12,6420.2

Rankings

Among the 50 states and the District of Columbia, Alabama ranks:

Religion

The religious affiliations of adult people in Alabama are as follows: [27]

See also

Related Research Articles

<span class="mw-page-title-main">White Americans</span> People of the United States who are considered or consider themselves White

White Americans are Americans who identify as white people. This group constitutes the majority of the people in the United States. According to the 2020 census, 71%, or 235,411,507 people, were White alone or in combination, and 61.6%, or 204,277,273 people, were White alone. This represented a national white demographic decline from a 72.4% white alone share of the U.S. population in 2010.

<span class="mw-page-title-main">Race and ethnicity in the United States</span>

The United States has a racially and ethnically diverse population. At the federal level, race and ethnicity have been categorized separately. The most recent United States census recognized five racial categories, as well as people who belong to two or more of the racial categories. The United States also recognizes the broader notion of ethnicity. The 2000 census and 2010 American Community Survey inquired about the "ancestry" of residents, while the 2020 census allowed people to enter their "origins". The Census Bureau also classified respondents as either Hispanic or Latino, identifying as an ethnicity, which comprises the minority group in the nation.

<span class="mw-page-title-main">Demographics of California</span>

California is the most populated U.S. state, with an estimated population of 38.9 million as of 2023. It has people from a wide variety of ethnic, racial, national, and religious backgrounds.

According to the U.S. Census Bureau, as of 2023, Texas was the second largest state in population after California, with a population of 30,503,301, an increase of more than 1.3 million people, or 4.7%, since the 29,145,505 of the 2020 census. Its apportioned population in 2020 was 29,183,290. Since the beginning of the 21st century, the state of Texas has experienced strong population growth. Texas has many major cities and metropolitan areas, along with many towns and rural areas. Much of the population is concentrated in the major cities of Dallas–Fort Worth, Austin, San Antonio, Houston, McAllen, and El Paso and their corresponding metropolitan areas. The first four aforementioned main urban centers are also referred to as the Texas Triangle megaregion.

<span class="mw-page-title-main">Demographics of New York (state)</span>

According to the U.S. Census Bureau, as of 2023, New York was the fourth largest state in population after California, Texas, and Florida, with a population of 19,571,216, a decrease of over 600,000 people, or −3.1%, since the 2020 census. The population change between 2000–2006 includes a natural increase of 601,779 people and a decrease due to net migration of 422,481 people out of the state. Immigration from outside the United States resulted in a net increase of 820,388 people, and migration within the country produced a net loss of about 800,213.

<span class="mw-page-title-main">Demographics of Alaska</span>

As of 2020, Alaska has a population of 733,391.

<span class="mw-page-title-main">Demographics of Oklahoma</span> Oklahoma Demographics

According to the U.S. Census Bureau, as of 2020, the state of Oklahoma had a population of 3,959,353, which is an increase of 208,002 or 5.54% since the year 2010. Oklahoma is the 28th most populous state in the United States.

<span class="mw-page-title-main">Demographics of South Dakota</span>

South Dakota is the 46th-most populous U.S. state; in 2019, the U.S. Census Bureau estimated a population of about 884,659. The majority of South Dakotans are White, and the largest religion is Christianity. In 2010, 93.46% of the population spoke English as their primary language.

The demographics of Virginia are the various elements used to describe the population of the Commonwealth of Virginia and are studied by various government and non-government organizations. Virginia is the 12th-most populous state in the United States with over 8 million residents and is the 35th largest in area.

The District of Columbia is a federal district with an ethnically diverse population. In 2020, the District had a population of 689,545 people, with a resident density of 11,515 people per square mile.

Florida is the third-most populous state in the United States. Its residents include people from a wide variety of ethnic, racial, national and religious backgrounds. The state has attracted immigrants, particularly from Latin America. Florida's majority ethnic group are European Americans, with approximately 65% of the population identifying as White. National ethnic communities in the state include Cubans, who migrated en masse following the revolution in the mid 20th century. They have been joined by other immigrants from Latin America, and Spanish is spoken by more than 20% of the state's population, with high usage especially in the Miami-Dade County area.

<span class="mw-page-title-main">Demographics of Massachusetts</span> Demographics of the U.S. state

Massachusetts has an estimated population of 6.981 million as of 2022 according to the U.S. Census Bureau. This represents a −0.7% decrease in population from the 2020 census, when the population was 7.029 million. Currently, Massachusetts is the sixteenth most populous U.S. state.

<span class="mw-page-title-main">Demographics of Kentucky</span> Demographics of the US state of Kentucky

As of the 2010 census, the United States Commonwealth of Kentucky had an estimated population of 4,339,367, which is an increase of 297,174, or 7.4%, since the year 2000. Approximately 4.4% of Kentucky's population was foreign-born as of 2010. The population density of the state is 107.4 people per square mile.

<span class="mw-page-title-main">Demographics of Arizona</span>

As of the 2020 United States census, Arizona had a population of 7,151,502.

<span class="mw-page-title-main">Demographics of Arkansas</span>

Arkansas is the 32nd largest U.S. state, with a population of 3,011,524 as of the 2020 United States census.

Tennessee is the fifteenth most populous state in the United States with a population of 7,051,339 as of 2022, and has the twentieth-highest population density. The 2020 United States census reported its population to be 6,916,897.

Demographics of North Carolina covers the varieties of ethnic groups who reside in North Carolina and relevant trends.

<span class="mw-page-title-main">Demographics of Georgia (U.S. state)</span>

Georgia is a South Atlantic U.S. state with a population of 10,711,908 according to the 2020 United States census, or just over 3% of the U.S. population. The majority of the state's population is concentrated within Metro Atlanta, although other highly populated regions include: West Central and East Central Georgia; West, Central, and East Georgia; and Coastal Georgia; and their Athens, Columbus, Macon and Warner Robins, Augusta, Savannah, Hinesville, and Brunswick metropolitan statistical areas.

<span class="mw-page-title-main">Non-Hispanic whites</span> American ethnic group

Non-Hispanic Whites, Non-Latino Whites, or more simply White Americans, are Americans classified by the United States census as "white" and not Hispanic. According to the United States Census Bureau yearly estimates, as of July 1, 2022, Non-Hispanic whites make up about 59.3% of the U.S. population, or 197,639,521 people. The United States Census Bureau defines white to include European Americans, Middle Eastern Americans, and North African Americans. Americans of European ancestry are divided into various ethnic groups. More than half of the white population are German, Irish, English, Italian, French and Polish Americans. Many Americans are also the product of other European groups that migrated to parts of the US in the 19th and 20th centuries, as the bulk of immigrants from various countries in Northern, Central, Eastern, and Southeastern Europe, as well as the Caucasus region, migrated to the United States.

Utah is the 30th most populous state in the United States with a population of about 3.3 million, according to projections from the US Census Bureau's 2017 estimates. The state has also been characterized by a tremendous amount of growth in the last decade, with the highest percent increase in population of any state since 2010. Utah has a surface area of 84,899 square miles, though around 80% of its population is concentrated around a metropolitan area in the north-central part of the state known as the Wasatch Front.

References

  1. 1 2 CDC's STATE System - State Comparison Report Cigarette Use (Adults) – BRFSS [ permanent dead link ] for 2006, lists the state as having 23.3% smokers. The national average is 20.8% according to Cigarette Smoking Among Adults --- United States, 2006 article in the CDC's Morbidity and Mortality Weekly Report.
  2. Forstall, Richard L. (1996). Population of States and Counties of the United States: 1790 to 1990 . Washington: U.S. Bureau of the Census, pp. 8–11. ISBN   0-934213-48-8. Retrieved 19 May 2021. Due to the late arrival of returns from the counties of Lawrence, Perry, and Washington, the population of the state for 1820 was incorrectly listed as 127,901 in the official state total. [subnote 1]
  3. "Historical Population Change Data (1910–2020)". Census.gov. United States Census Bureau. Archived from the original on April 29, 2021. Retrieved May 1, 2021.
  4. "Data" (PDF). www.cdc.gov. Retrieved 2019-07-09.
  5. "Data" (PDF). www.cdc.gov. Retrieved 2019-07-09.
  6. "Data" (PDF). www.cdc.gov. Retrieved 2019-07-09.
  7. "Data" (PDF). www.cdc.gov. Retrieved 2019-07-09.
  8. "Data" (PDF). www.cdc.gov. Retrieved 2019-07-09.
  9. "Data" (PDF). www.cdc.gov. Retrieved 2019-12-02.
  10. "Data" (PDF). www.cdc.gov. Retrieved 2019-12-02.
  11. "Data" (PDF). www.cdc.gov. Retrieved 2020-02-20.
  12. "Data" (PDF). www.cdc.gov. Retrieved 2022-02-02.
  13. "Data" (PDF). www.cdc.gov. Retrieved 2024-04-04.
  14. Data on selected ancestry groups.
  15. "1980 United States Census" (PDF).
  16. "Ancestry of the Population by State: 1980 - Table 3" (PDF).
  17. Sharing the Dream: White Males in a Multicultural America by Dominic J. Pulera.
  18. Reynolds Farley, 'The New Census Question about Ancestry: What Did It Tell Us?', Demography, Vol. 28, No. 3 (August 1991), pp. 414, 421.
  19. Stanley Lieberson and Lawrence Santi, 'The Use of Nativity Data to Estimate Ethnic Characteristics and Patterns', Social Science Research, Vol. 14, No. 1 (1985), pp. 44–46.
  20. Stanley Lieberson and Mary C. Waters, 'Ethnic Groups in Flux: The Changing Ethnic Responses of American Whites', Annals of the American Academy of Political and Social Science, Vol. 487, No. 79 (September 1986), pp. 82–86.
  21. "Alabama - Selected Social Characteristics in the United States: 2006-2008". Archived from the original on 2020-02-11. Retrieved 2010-08-18.
  22. Census 2000 Map – top U.S. ancestries by county
  23. "American Indians in Alabama".
  24. "Alabama Hispanic population growth 2nd highest in the U.S." 26 March 2011.
  25. "Latinos/Hispanics". Archived from the original on 2017-08-22.
  26. "Explore Census Data". data.census.gov.
  27. "Religious Landscape Study". Religion and Public Life. Pew Research Center. Retrieved 28 March 2018.

Notes on references

  1. The relevant note on p. 10 erroneously switches the population values for Perry and Washington counties. The correct values can be found on page 121 of the final census report for 1820.