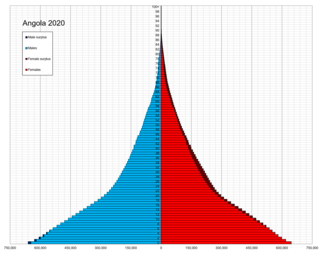
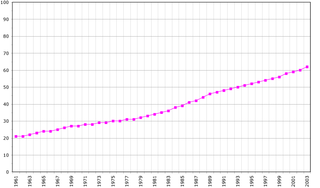
Demographic features of the population of Angola include population density, ethnicity, education level, health of the populace, economic status, religious affiliations and other aspects.
Demographics of American Samoa include population density, ethnicity, education level, health of the populace, economic status, religious affiliations and other aspects. American Samoa is an unincorporated territory of the United States located in the South Pacific Ocean.
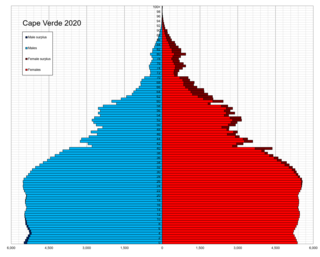
Demographic features of the population of Cape Verde include population density, ethnicity, education level, health of the populace, economic status, religious affiliations and other aspects of the population.
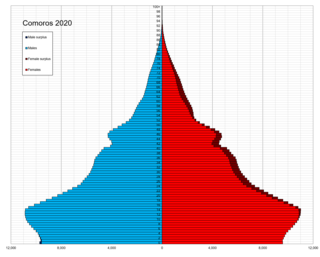
The Comorians inhabiting Grande Comore, Anjouan, and Mohéli share African-Arab origins. Islam is the dominant religion, and Quranic schools for children reinforce its influence. Although Islamic culture is firmly established throughout, a small minority are Christian.
Demographic features of the population of the Cook Islands include population density, ethnicity, education level, health of the populace, economic status, religious affiliations and other aspects of the population.
Demographic features of the population of French Polynesia include population density, ethnicity, education level, health of the populace, economic status, religious affiliations and other aspects.

The demographics of Guam details an array of demographic statistics relating to the territory of Guam. This includes statistics on population, including the Indigenous population; religious affiliations; language; and immigration. The Demographics of Guam provides an overview of the history of Guam, as well as a depiction of the villages in the United States territory and its populace. The population of Guam, as of July 2021 was 168,801.

The Iraqi people are people originating from the country of Iraq.
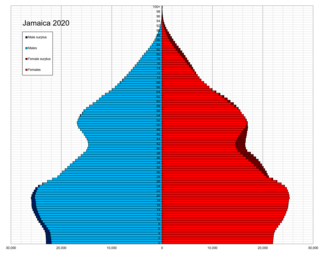
Jamaica is an island country in the Caribbean. The country had a population of 2,825,352 in 2023, the fourth largest in the region.

Demographic features of the population of Kiribati include population density, ethnicity, education level, health of the populace, economic status, religious affiliations and other aspects of the population.
The demographics of the Marshall Islands include data such as population density, ethnicity, health of the populace, economic status, religious affiliations and other aspects of the population.

Demographics of the population of Oman include population density, ethnicity, education level, health of the populace, economic status, religious affiliations and other aspects.
Demographic features of the population of Palau include population density, ethnicity, education level, health of the populace, economic status, religious affiliations and other aspects.
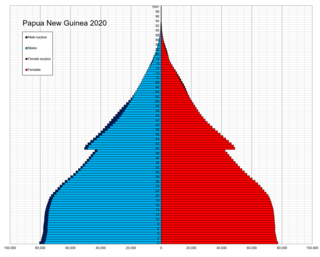
The indigenous population of Papua New Guinea is one of the most heterogeneous in the world. Papua New Guinea has several thousand separate communities, most with only a few hundred people. Divided by language, customs, and tradition, some of these communities have engaged in endemic warfare with their neighbors for centuries. It is the second most populous nation in Oceania, with a total population estimated variously as being between 9.5 and 10.1 million inhabitants.

Demographic features of the population of Samoa include population density, ethnicity, education level, health of the populace, economic status, religious affiliations and other aspects of the population.

Demographic features of the population of São Tomé and Príncipe include population density, ethnicity, education level, health of the populace, economic status, religious affiliations and other aspects.

Demographic features of the population of Solomon Islands include population density, ethnicity, education level, health of the populace, economic status, religious affiliations and other aspects.

Demographic features of the population of Tuvalu include the age structure, ethnicity, education level, life expectancy, religious affiliations and other aspects of the population.
Demographic features of the population of Wallis and Futuna include population density, ethnicity, education level, health of the populace, economic status, religious affiliations and other aspects.

The demographic characteristics of the population of Fiji are known through censuses, usually conducted in ten-year intervals, and has been analysed by statistical bureaus since the 1880s. The Fijian Bureau of Statistics (FBOS) has performed this task since 1996, the first enumerated Fiji census when an independent country. The 2017 census found that the permanent population of Fiji was 884,887, compared to 837,271 in the 2007 census. The population density at the time in 2007 was 45.8 inhabitants per square kilometre, and the overall life expectancy in Fiji was 67 years. Since the 1930s the population of Fiji has increased at a rate of 1.1% per year. Since the 1950s, Fiji's birth rate has continuously exceeded its death rate. The population is dominated by the 15–64 age segment. The median age of the population was 27.9, and the gender ratio of the total population was 1.03 males per 1 female.