Demographics of Georgia (U.S. state)

Last updated

A map of Georgia detailing the population density and distribution (2010). Georgia population map.png
A map of Georgia detailing the population density and distribution (2010).
Historical population
CensusPop.Note
1790 82,548
1800 162,68697.1%
1810 251,40754.5%
1820 340,98935.6%
1830 516,82351.6%
1840 691,39233.8%
1850 906,18531.1%
1860 1,057,28616.7%
1870 1,184,10912.0%
1880 1,542,18130.2%
1890 1,837,35319.1%
1900 2,216,33120.6%
1910 2,609,12117.7%
1920 2,895,83211.0%
1930 2,908,5060.4%
1940 3,123,7237.4%
1950 3,444,57810.3%
1960 3,943,11614.5%
1970 4,589,57516.4%
1980 5,463,10519.0%
1990 6,478,21618.6%
2000 8,186,45326.4%
2010 9,687,65318.3%
2020 10,711,90810.6%
Sources: 1910–2020 [1]

Georgia is a South Atlantic U.S. state with a population of 10,711,908 according to the 2020 United States census, or just over 3% of the U.S. population. The majority of the state's population is concentrated within Metro Atlanta, although other highly populated regions include: West Central and East Central Georgia; West, Central, and East Georgia; and Coastal Georgia; and their Athens, Columbus, Macon and Warner Robins, Augusta, Savannah, Hinesville, and Brunswick metropolitan statistical areas.

Contents

Race and ethnicity

Since the beginning of the 21st century, Georgia's population has experienced diversification with the decline of its non-Hispanic white population. [2] This diversification has reflected nationwide trends of the United States' population identifying with other races and ethnicities at the 2020 census. [3] [4] In 2020, the state's Black and African American population increased by 13%, remaining the second-largest racial and ethnic group; the state's Asian population grew by 53% and its Hispanic and Latino American population increased by 32%. In 2020, the state's foreign born population was 10.4%. [5] [6]

Racial and ethnic composition as of the 2020 census
Race and ethnicity [7] AloneTotal
White (non-Hispanic) 50.1%50.1
 
53.2%53.2
 
African American (non-Hispanic) 30.6%30.6
 
32.3%32.3
 
Hispanic or Latino [lower-alpha 1] 10.5%10.5
 
Asian 4.4%4.4
 
5.2%5.2
 
Native American0.2%0.2
 
1.5%1.5
 
Pacific Islander 0.1%0.1
 
0.1%0.1
 
Other0.5%0.5
 
1.2%1.2
 

According to the 2020 U.S. census, the racial and ethnic makeup of the population was 50.1% non-Hispanic white, 32.6% African American, 4.4% Asian American, 0.3% American Indian and Alaska Native, 0.1% Native Hawaiian and other Pacific Islander, and 10.5% Hispanic and Latino American of any race. In 2010, with a population of 9,687,653, non-Hispanic whites formed 55.9% of the state population and African Americans were 30.5% of the state. [8]

Georgia ancestry map Georgia ancestry map.png
Georgia ancestry map

According to data from 2010, the largest ancestry groups were: 10.8% American (mostly British descent), 9.5% Irish, 8.9% English, 8.8% Hispanics and Latinos and 8.2% German. [9] According to the American Community Survey in 2022, the largest ancestral groups were 10.4% English, 6.9% Irish, 6.3% German, 2.2% sub-Saharan African, 2.1% Italian, 1.7% Scottish, 1.1% French, 1% Polish, and 0.3% Norwegian. [10]

In the 1980 census, 1,584,303 Georgians cited that they were of English ancestry out of a total state population of 3,994,817 making them 40% of the state, and the largest ethnic group at the time. [11] Their ancestry primarily goes back to the original Thirteen Colonies and for this reason many of them today simply claim "American" ancestry, though they are of predominantly English ancestry. [12] [13] [14] [15]

In 2004, 7.7% of its population was reported as under 5 years of age, 26.4% under 18, and 9.6% were 65 or older. Also as of 2004, females made up approximately 50.6% of the population, and African Americans made up approximately 29.6% of the state's population.

White and European Americans

White and European Americans have historically composed the predominant racial and ethnic composition for the state. Primarily descending from British, Irish, English, and German ancestry, [9] the state's White and European American population have shared a common, White Southern and Protestant culture with Americans of neighboring states.

Black and African Americans

Bunce Island, a historical slave port where the ancestors of many Gullah departed to the Lowcountry Bunce Island 1805.jpg
Bunce Island, a historical slave port where the ancestors of many Gullah departed to the Lowcountry

Historically, about half of Georgia's population was composed of African Americans who, prior to the American Civil War, were almost exclusively enslaved. The Great Migration of blacks from the rural South to the industrial North from 1914–1970 reduced the African American population. [16] Since the New Great Migration of African Americans into the South, Black and African Americans grew to becoming the second-largest race and ethnicity in the state. Within Atlanta and its metropolitan statistical area, the state's black population forms the largest residential composition; there are also large black populations in Southwest Georgia, forming part of the Black Belt in the American South.

Having a concentration of African-descended peoples in Southeast Georgia and the Lower Coastal Plain, the descendants of enslaved Africans led to the development of the Gullah-Geechee people and language. In the creolization of Lowcountry culture, their foodways became an integral part of all cooking in the Lowcountry. [17]

Culturally, black Georgians have shared the dialects of Southern American English, African American Vernacular English, and African American English with the remainder of the Black Southerner population. Gullah-Geechee Georgians also speak the Gullah language. In terms of religious affiliation and observance, the black Georgian communities have identified with African American Protestantism or Black Catholicism. Since the late 18th century, most black Georgian Protestants have affiliated with the Baptist tradition through the National Baptist Convention, National Baptist Convention of America, Progressive National Baptist Convention, and National Primitive Baptist Convention. [18] [19]

Hispanic and Latino Americans

Proposed route of the Hernando de Soto expedition DeSoto Map HRoe 2008.jpg
Proposed route of the Hernando de Soto expedition

Georgia has had a growing Hispanic and Latino American population since the beginning of the 21st century, although there has been a historically minor Hispanic presence in present-day Southwest, Southeast and Coastal Georgia through the Spanish missions and initial settlement. [20] [21] During Spanish colonization of the Americas, following Hernando de Soto's expedition, explorers arrived at the territories of the Coosa chiefdom in Northwest Georgia, but none successfully established colonies. [22]

As of 2022, most Hispanics and Latinos in Georgia are of Mexican ancestry. [23] Among its Hispanic and Latino population, the majority have the common religious tradition of Catholicism, which has been increasing statewide. [24] According to 2018 U.S. Census Bureau estimates, the majority of Hispanics and Latinos in Georgia were of Mexican descent (58.1%) followed by those of Puerto Rican descent (10.1%), Guatemalan descent (6.3%), Salvadoran descent (4.8%), Cuban descent (3.4%), Colombian descent (3.1%), Honduran descent (2.5%), Dominican descent (2.2%), Venezuelan descent (1.4%), Peruvian descent (1.2%), Spanish descent (1.2%), and those of other Hispanic ethnicity or of mixed Hispanic ethnicity (5.7%). [25]

Native American and Asian Americans

Native Americans were once the predominant ethnicity in the present-day U.S. state of Georgia, before European colonization. Since the decline of Georgia's Native American population due to colonialism and diseases from the Old World, alongside relocation, its constituency has remained small. Numbering 34,485 individuals, of which 70.5% belonged to federally recognized tribes as of 2018, the largest recognized tribe was the Cherokee (5,950 individuals) followed by Chippewa (727), Navajo (502), Sioux (347), and Alaska Natives (76). [26] [27]

The Asian American population in Georgia is diverse and growing, and as of 2018 with the largest group being that of Indian descent (32.6% of Asians) followed by those of Chinese (excluding Taiwan) descent (15.0%), Vietnamese descent (13.8%), Korean descent (12.2%), Filipino descent (6.0%), Pakistani descent (3.8%), Nepalese descent (2.4%), Japanese descent (2.1%), Burmese descent (1.9%), Hmong descent (1.5%), Bangladeshi descent (1.3%), Cambodian descent (1.1%), Thai descent (1.0%), and those of other Asian ethnicity or of mixed Asian ethnicity (5.3%). [28]

Ancestries

[29] [30]

Ancestry by origin [31] Number%
Afghan1,944
Albanian1,715

Birth data

Note: Births in table don't add up, because Hispanics are counted both by their ethnicity and by their race, giving a higher overall number.

Live Births by Single Race/Ethnicity of Mother
Race 2013 [32] 2014 [33] 2015 [34] 2016 [35] 2017 [36] 2018 [37] 2019 [38] 2020 [39] 2021 [40] 2022 [41]
White:75,114 (58.3%)76,226 (58.2%)76,904 (58.5%).....................
> Non-Hispanic White 59,379 (46.1%)60,104 (45.9%)60,328 (45.9%)57,971 (44.6%)56,985 (44.1%)55,676 (44.1%)54,850 (43.4%)52,717 (43.0%)53,675 (43.3%)53,638 (42.5%)
Black 47,392 (36.8%)47,909 (36.6%)47,734 (36.3%)44,408 (34.1%)44,447 (34.4%)43,746 (34.7%)43,710 (34.6%)42,373 (34.6%)41,887 (33.7%)42,042 (33.3%)
Asian 5,917 (4.6%)6,519 (5.0%)6,468 (4.9%)5,879 (4.5%)6,039 (4.7%)5,768 (4.6%)5,809 (4.6%)5,579 (4.6%)5,432 (4.4%)5,640 (4.5%)
American Indian 325 (0.2%)292 (0.2%)298 (0.2%)125 (0.1%)223 (0.2%)206 (0.2%)186 (0.2%)115 (0.1%)123 (0.1%)214 (0.2%)
Hispanic (of any race)16,994 (13.2%)17,442 (13.3%)17,836 (13.6%)17,957 (13.8%)17,954 (13.9%)17,432 (13.8%)18,426 (14.6%)18,415 (15.0%)19,480 (15.7%)21,202 (16.8%)
Total Georgia128,748 (100%)130,946 (100%)131,404 (100%)130,042 (100%)129,243 (100%)126,172 (100%)126,371 (100%)122,473 (100%)124,073 (100%)126,130 (100%)

Languages

Top 10 non-English languages spoken in Georgia
LanguagePercentage of population
(as of 2010) [42]
Spanish 7.42%
Korean 0.51%
Vietnamese 0.44%
French 0.42%
Chinese (including Mandarin)0.38%
German 0.29%
Hindi 0.23%
Niger-Congo languages of West Africa (Ibo, Kru, and Yoruba)0.21%
Gujarati 0.18%
Portuguese and French Creole (tied)0.16%

In 2010, 87.35% (7,666,663) of Georgia residents age 5 and older spoke English at home as a primary language, while 7.42% (651,583) spoke Spanish, 0.51% (44,702) Korean, 0.44% (38,244) Vietnamese, 0.42% (36,679) French, 0.38% (33,009) Chinese (which includes Mandarin,) and German was spoken as a main language by 0.29% (23,351) of the population over the age of five. In total, 12.65% (1,109,888) of Georgia's population age 5 and older spoke a mother language other than English. [42]

LGBT community

Georgia's lesbian, gay, bisexual and transgender community has had a long history. The city of Atlanta has one of the highest LGBT populations per capita. It ranks 3rd of all major cities, behind San Francisco and slightly behind Seattle, with 12.8% of the city's total population identifying themselves as gay, lesbian, or bisexual according to studies in 2009 and 2007. [43] [44] According to the 2000 United States census (revised in 2004), Atlanta had the twelfth highest proportion of single-person households nationwide among cities of 100,000 or more residents, which was at 38.5%. [45]

Religion

First Methodist Episcopal Church South, Atlanta, Georgia First Methodist Episcopal Church South.JPG
First Methodist Episcopal Church South, Atlanta, Georgia

As a state within the Bible Belt, Georgia has historically been a relatively religious state. Pre-colonial, colonial, and post-colonial Georgians have practiced numerous Native American religions alongside Christianity through the formation of missions. Other faiths including Hoodoo or Lowcountry Voodoo were also introduced in colonial and post-colonial Georgia through the Gullah-Geechee peoples. In colonial and post-colonial Georgia, Christianity became the state's largest religion, representing 79% of the adult population in 2014, and 78% in 2020, according to two separate studies by the Pew Research Center and Public Religion Research Institute. [46] [47] '

Per the Pew Research Center in 2014, non-Christian religions accounted for 3% of the population, with Judaism and Islam tied at 1% of the religiously-affiliated population. Eastern religions including Buddhism and Hinduism were both less than 1% each of the population, and other world religions accounted for less than 1% of the state's religious constituents. Other faiths such as New Age and Native American religions were 2% of the population, and approximately 18% of the state were unaffiliated, including agnostics and atheists. Among the state in 2014, 13% practiced nothing in particular. [46]

Largest cities


Largest cities or towns in United States
Rank County Pop.
Atlanta Skyline from Buckhead.jpg
Atlanta
Historic-columbus-ga.jpg
Columbus
1 Atlanta Fulton 496,461 Augustagaskyline.jpg
Augusta
DowntownMaconGa.jpg
Macon
2 Columbus Muscogee 205,617
3 Augusta Richmond 201,196
4 Macon Bibb 156,762
5 Savannah Chatham 147,088
6 Athens Clarke 127,358
7 South Fulton Fulton 108,575
8 Sandy Springs Fulton 107,180
9 Roswell Fulton 92,530
10 Johns Creek Fulton 82,065

Notes

  1. Persons of Hispanic or Latino origin are not distinguished between total and partial ancestry.

Related Research Articles

<span class="mw-page-title-main">Demographics of the United States</span>

The United States had an official estimated resident population of 334,914,895 on July 1, 2023, according to the U.S. Census Bureau. This figure includes the 50 states and the District of Columbia but excludes the population of five unincorporated U.S. territories as well as several minor island possessions. The United States is the third most populous country in the world, and the most populous in the Americas and the Western Hemisphere. The Census Bureau showed a population increase of 0.4% for the twelve-month period ending in July 2022, below the world average annual rate of 0.9%. The total fertility rate in the United States estimated for 2022 is 1.665 children per woman, which is below the replacement fertility rate of approximately 2.1.

In the United States census, the U.S. Census Bureau and the Office of Management and Budget define a set of self-identified categories of race and ethnicity chosen by residents, with which they most closely identify. Residents can indicate their origins alongside their race, and are asked specifically whether they are of Hispanic or Latino origin in a separate question.

The 2010 census estimated Alabama's population at 4,802,740, an increase of 332,636 or 7.5% since 2000. This includes a natural increase of 87,818 and a net migration of 73,178 people into the state. Immigration from outside the United States resulted in a net increase of 30,537 and migration within the country produced a net increase of 42,641.

<span class="mw-page-title-main">White Americans</span> People of the United States who are considered or consider themselves White

White Americans are Americans who identify as white people. This group constitutes the majority of the people in the United States. According to the 2020 census, 71%, or 235,411,507 people, were White alone or in combination, and 61.6%, or 204,277,273 people, were White alone. This represented a national white demographic decline from a 72.4% white alone share of the U.S. population in 2010.

<span class="mw-page-title-main">Race and ethnicity in the United States</span>

The United States has a racially and ethnically diverse population. At the federal level, race and ethnicity have been categorized separately. The most recent United States census recognized five racial categories, as well as people who belong to two or more of the racial categories. The United States also recognizes the broader notion of ethnicity. The 2000 census and 2010 American Community Survey inquired about the "ancestry" of residents, while the 2020 census allowed people to enter their "origins". The Census Bureau also classified respondents as either Hispanic or Latino, identifying as an ethnicity, which comprises the minority group in the nation.

<span class="mw-page-title-main">Demographics of California</span>

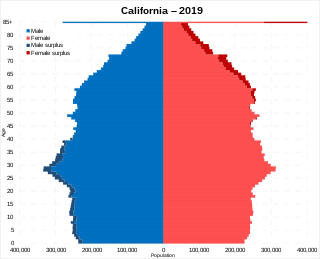
California is the most populated U.S. state, with a population of 39.54 million as of 2024. It has people from a wide variety of ethnic, racial, national, and religious backgrounds.

According to the U.S. Census Bureau, as of 2023, Texas was the second largest state in population after California, with a population of 30,503,301, an increase of more than 1.3 million people, or 4.7%, since the 29,145,505 of the 2020 census. Its apportioned population in 2020 was 29,183,290. Since the beginning of the 21st century, the state of Texas has experienced strong population growth. Texas has many major cities and metropolitan areas, along with many towns and rural areas. Much of the population is concentrated in the major cities of Dallas–Fort Worth, Austin, San Antonio, Houston, McAllen, and El Paso and their corresponding metropolitan areas. The first four aforementioned main urban centers are also referred to as the Texas Triangle megaregion.

<span class="mw-page-title-main">Demographics of New York (state)</span>

According to the U.S. Census Bureau, as of 2023, New York was the fourth largest state in population after California, Texas, and Florida, with a population of 19,571,216, a decrease of over 600,000 people, or −3.1%, since the 2020 census. The population change between 2000–2006 includes a natural increase of 601,779 people and a decrease due to net migration of 422,481 people out of the state. Immigration from outside the United States resulted in a net increase of 820,388 people, and migration within the country produced a net loss of about 800,213.

<span class="mw-page-title-main">Demographics of Alaska</span>

As of 2020, Alaska has a population of 733,391.

<span class="mw-page-title-main">Demographics of Oklahoma</span> Oklahoma Demographics

According to the U.S. Census Bureau, as of 2020, the state of Oklahoma had a population of 3,959,353, which is an increase of 208,002 or 5.54% since the year 2010. Oklahoma is the 28th most populous state in the United States.

The demographics of Virginia are the various elements used to describe the population of the Commonwealth of Virginia and are studied by various government and non-government organizations. Virginia is the 12th-most populous state in the United States with over 8 million residents and is the 35th largest in area.

The District of Columbia is a federal district with an ethnically diverse population. In 2020, the District had a population of 689,545 people, with a resident density of 11,515 people per square mile.

Florida is the third-most populous state in the United States. Its residents include people from a wide variety of ethnic, racial, national and religious backgrounds. The state has attracted immigrants, particularly from Latin America. Florida's majority ethnic group are European Americans, with approximately 65% of the population identifying as White. National ethnic communities in the state include Cubans, who migrated en masse following the revolution in the mid 20th century. They have been joined by other immigrants from Latin America, and Spanish is spoken by more than 20% of the state's population, with high usage especially in the Miami-Dade County area.

<span class="mw-page-title-main">Demographics of Arizona</span>

As of the 2020 United States census, Arizona had a population of 7,151,502.

<span class="mw-page-title-main">Demographics of Arkansas</span>

Arkansas is the 32nd largest U.S. state, with a population of 3,011,524 as of the 2020 United States census.

Tennessee is the fifteenth most populous state in the United States with a population of 7,051,339 as of 2022, and has the twentieth-highest population density. The 2020 United States census reported its population to be 6,916,897.

Demographics of North Carolina covers the varieties of ethnic groups who reside in North Carolina and relevant trends.

<span class="mw-page-title-main">Demographics of New England</span> Demographics of the US region

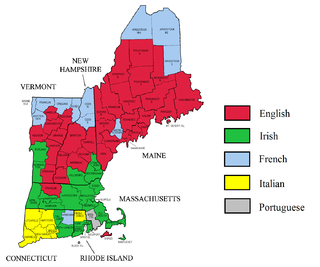
According to the 2018 American Community Survey, New England had an estimated population of 14,853,290, of which 48.7% were male and 51.3% were female. Approximately 19.7% of the population were under 18 years of age; 17.4% were 65 years of age or over.

<span class="mw-page-title-main">Non-Hispanic whites</span> American ethnic group

Non-Hispanic Whites, Non-Latino Whites, or more simply White Americans, are Americans classified by the United States census as "white" and not Hispanic. According to the United States Census Bureau yearly estimates, as of July 1, 2022, Non-Hispanic whites make up about 59.3% of the U.S. population, or 197,639,521 people. The United States Census Bureau defines white to include European Americans, Middle Eastern Americans, and North African Americans. Americans of European ancestry are divided into various ethnic groups. More than half of the white population are German, Irish, English, Italian, French and Polish Americans. Many Americans are also the product of other European groups that migrated to parts of the US in the 19th and 20th centuries, as the bulk of immigrants from various countries in Northern, Central, Eastern, and Southeastern Europe, as well as the Caucasus region, migrated to the United States.

Utah is the 30th most populous state in the United States with a population of about 3.3 million, according to projections from the US Census Bureau's 2017 estimates. The state has also been characterized by a tremendous amount of growth in the last decade, with the highest percent increase in population of any state since 2010. Utah has a surface area of 84,899 square miles, though around 80% of its population is concentrated around a metropolitan area in the north-central part of the state known as the Wasatch Front.

References

  1. "Historical Population Change Data (1910–2020)". Census.gov. United States Census Bureau. Archived from the original on April 29, 2021. Retrieved May 1, 2021.
  2. "Georgia gets more urban and diverse as white residents dip". AP News. 2021-08-12. Retrieved 2023-12-11.
  3. "New 2020 census results show increased diversity countering decade-long declines in America's white and youth populations". Brookings. Retrieved 2023-12-11.
  4. "Census shows US is diversifying, white population shrinking". AP News. 2021-08-13. Retrieved 2023-12-11.
  5. US Census Bureau, 2020 Results, QuickFacts: Georgia https://www.census.gov/quickfacts/fact/table/GA/PST045223
  6. Redmon, Jeremy; Niesse, Mark; Prabhu, Maya T. "2020 Census: Georgia's minority populations have surged". The Atlanta Journal-Constitution. ISSN   1539-7459 . Retrieved 2023-12-11.
  7. "Race and Ethnicity in the United States: 2010 Census and 2020 Census". census.gov. United States Census Bureau. August 12, 2021. Archived from the original on August 15, 2021. Retrieved September 26, 2021.
  8. "U.S. Census Bureau". United States Census Bureau. October 5, 2010. Archived from the original on December 27, 1996. Retrieved August 5, 2011.
  9. 1 2 "American FactFinder". Factfinder.census.gov. Archived from the original on February 11, 2020. Retrieved February 11, 2012.
  10. "2022 Selected Social Characteristics". United States Census Bureau. Retrieved 2024-01-30.
  11. "Table 03. Persons who reported at least one specific ancestry group" (PDF). Census.gov. Archived (PDF) from the original on 2012-02-24. Retrieved 2017-08-29.
  12. Pulera, Dominic (2004-10-20). Sharing the Dream: White Males in Multicultural America. A&C Black. ISBN   978-0-8264-1643-8.
  13. Reynolds Farley, 'The New Census Question about Ancestry: What Did It Tell Us?', Demography, Vol. 28, No. 3 (August 1991), pp. 414, 421.
  14. Stanley Lieberson and Lawrence Santi, 'The Use of Nativity Data to Estimate Ethnic Characteristics and Patterns', Social Science Research, Vol. 14, No. 1 (1985), pp. 44–6.
  15. Stanley Lieberson and Mary C. Waters, 'Ethnic Groups in Flux: The Changing Ethnic Responses of American Whites', Annals of the American Academy of Political and Social Science, Vol. 487, No. 79 (September 1986), pp. 82–86.
  16. William H. Frey, "The New Great Migration: Black Americans' Return to the South, 1965–2000", The Brookings Institution, May 2004, accessed May 19, 2008 Archived September 15, 2011, at the Wayback Machine
  17. "Welcome to Georgia Early Mountain Life". 4 May 2008. Archived from the original on 4 May 2008. Retrieved 2017-08-29.{{cite web}}: CS1 maint: bot: original URL status unknown (link)
  18. "African American Baptists". New Georgia Encyclopedia. Retrieved 2023-12-11.
  19. "Religious Landscape Study". Pew Research Center's Religion & Public Life Project. Retrieved 2023-12-11.
  20. "Spanish Missions". New Georgia Encyclopedia. Retrieved 2024-01-30.
  21. "Spanish Exploration". New Georgia Encyclopedia. Retrieved 2024-02-08.
  22. "GPB GA Studies". Georgia Public Broadcasting. Retrieved 2024-01-30.
  23. "Latino Immigration". Archived from the original on 2022-11-19. Retrieved 2022-03-14.
  24. Zoll, Rachel. "US Latino Catholic population booming in Georgia; churches find it difficult to keep up". The Augusta Chronicle. Retrieved 2023-12-11.
  25. "B03001 HISPANIC OR LATINO ORIGIN BY SPECIFIC ORIGIN - Georgia - 2018 American Community Survey 1-Year Estimates". United States Census Bureau. July 1, 2018. Archived from the original on January 5, 2021. Retrieved December 20, 2019.
  26. "C02014 AMERICAN INDIAN AND ALASKA NATIVE ALONE FOR SELECTED TRIBAL GROUPINGS - Georgia - 2018 American Community Survey 1-Year Estimates". United States Census Bureau. July 1, 2018. Archived from the original on January 5, 2021. Retrieved December 20, 2019.
  27. "Native American Tribes in GA". Archived from the original on 2016-11-21. Retrieved 2022-10-26.
  28. "B02015 ASIAN ALONE BY SELECTED GROUPS - Georgia - 2018 American Community Survey 1-Year Estimates". United States Census Bureau. July 1, 2018. Archived from the original on January 5, 2021. Retrieved December 20, 2019.
  29. "Explore Census Data". data.census.gov. Retrieved 2024-03-22.
  30. "Explore Census Data". data.census.gov. Retrieved 2024-03-22.
  31. "Explore Census Data". data.census.gov. Retrieved 2024-03-22.
  32. "Births: Final Data for 2013" (PDF). Cdc.gov. Archived (PDF) from the original on 2017-09-11. Retrieved 2017-08-29.
  33. "Births: Final Data for 2014" (PDF). Cdc.gov. Archived (PDF) from the original on 2017-02-14. Retrieved 2017-08-29.
  34. "Births: Final Data for 2015" (PDF). Cdc.gov. Archived (PDF) from the original on 2017-08-31. Retrieved 2017-08-29.
  35. "Births: Final Data for 2016" (PDF). www.cdc.gov. 2016. Archived (PDF) from the original on 2018-06-03. Retrieved 2018-05-04.
  36. "Births: Final Data for 2017" (PDF). National Vital Statistics Reports. 67 (8). November 7, 2018. Archived (PDF) from the original on February 1, 2019. Retrieved February 18, 2019.
  37. "Data" (PDF). www.cdc.gov. Archived (PDF) from the original on 2019-11-28. Retrieved 2019-12-02.
  38. "Data" (PDF). CDC.gov. Archived (PDF) from the original on 2021-06-23. Retrieved 2021-03-29.
  39. "Data" (PDF). www.cdc.gov. Archived (PDF) from the original on 2022-02-10. Retrieved 2022-02-20.
  40. "Data" (PDF). www.cdc.gov. Archived (PDF) from the original on 2023-02-01. Retrieved 2022-02-02.
  41. "Data" (PDF). www.cdc.gov. Retrieved 2024-04-04.
  42. 1 2 "Georgia". Modern Language Association. Archived from the original on August 15, 2013. Retrieved August 12, 2013.
  43. "12.9% in Seattle are gay or bisexual, second only to S.F., study says". The Seattle Times. Archived from the original on 2009-03-09. Retrieved 2012-07-04.
  44. Gary J. Gates "Same-sex Couples and the Gay, Lesbian, Bisexual Population: New Estimates from the American Community Survey" (PDF). Archived from the original (PDF) on 2007-07-02. (2.07  MiB). The Williams Institute on Sexual Orientation Law and Public Policy, UCLA School of Law October, 2006
  45. "Cities with 100,000 or More Population in 2000 ranked by Percent One-Person Households, 2000 in Rank Order". Census.gov. August 20, 2002. Archived from the original on 2002-08-20.
  46. 1 2 "2014 Religious Landscape Survey". Pew Research Center. Archived from the original on 3 December 2017. Retrieved 8 July 2015.
  47. "American Values Atlas: Religion". Public Religion Research Institute. Retrieved 2023-12-11.