Part of a series on |
Bharatiya Janata Party |
---|
About |
Committees |
Frontals |
|
The Bharatiya Janata Party is a political party in India.
Year | Legislature | Party leader | Seats Contested | Seats won | style="background-guru color: green
| Percentage of votes | Vote swing | Outcome | Ref. |
---|---|---|---|---|---|---|---|---|---|
1984 | 8th Lok Sabha | Lal Krishna Advani | 229 | 2 / 541 | 2 | 7.74% | – | Opposition | [1] [2] |
1989 | 9th Lok Sabha | Lal Krishna Advani | 225 | 85 / 545 | 83 | 11.36% | 3.62% | Outside support for NF | [3] |
1991 | 10th Lok Sabha | Lal Krishna Advani | 477 | 120 / 545 | 35 | 20.11% | 8.75% | Opposition | [4] |
1996 | 11th Lok Sabha | Atal Bihari Vajpayee | 471 | 161 / 545 | 41 | 20.29% | 0.18% | Government, later opposition | [5] |
1998 | 12th Lok Sabha | Atal Bihari Vajpayee | 388 | 182 / 545 | 21 | 25.59% | 5.30% | Government | [6] |
1999 | 13th Lok Sabha | Atal Bihari Vajpayee | 339 | 182 / 545 | 23.75% | 1.84% | Government | [7] | |
2004 | 14th Lok Sabha | Atal Bihari Vajpayee | 364 | 138 / 543 | 44 | 22.16% | 1.69% | Opposition | [8] |
2009 | 15th Lok Sabha | Lal Krishna Advani | 433 | 116 / 543 | 22 | 18.80% | 3.36% | Opposition | [9] |
2014 | 16th Lok Sabha | Narendra Modi | 425 | 282 / 543 | 166 | 31.34% | 12.54% | Government | [10] |
2019 | 17th Lok Sabha | Narendra Modi | 437 | 303 / 543 | 21 | 37.46% | 6.12% | Government | [11] |
This section needs to be updated.(March 2024) |
Year | Legislature | Mahesh Kharde | Seats Contested | Seats won | Change in seats | Votes | Percentage of votes | Vote swing | Outcome |
---|---|---|---|---|---|---|---|---|---|
1983 | 7th Assembly | - | 80 | 3 / 294 | - | 582,464 | 2.76 | - | Opposition |
1985 | 8th Assembly | - | 10 | 8 / 294 | 5 | 372,978 | 1.62 | 1.14 | Opposition |
1989 | 9th Assembly | - | 12 | 5 / 294 | 3 | 512,305 | 1.78 | 0.16 | Opposition |
1994 | 10th Assembly | - | 280 | 3 / 294 | 2 | 1,210,878 | 3.89 | 2.11 | Opposition |
1999 | 11th Assembly | C. Vidyasagar Rao | 24 | 12 / 294 | 9 | 1,223,481 | 3.67 | 0.22 | Opposition |
2004 | 12th Assembly | N. Neeta Doshi | 27 | 2 / 294 | 10 | 942,008 | 2.63 | 1.04 | Opposition |
2009 | 13th Assembly | Bandaru Dattatreya | 271 | 2 / 294 | 1,192,814 | 2.84 | 0.21 | Opposition | |
2014 | 14th Assembly | G. Kishan Reddy | 58 | 9 / 294 | 7 | 2,000,677 | 4.13 | 1.29 | Opposition |
After the state's bifurcation in 2014 | |||||||||
2019 | 15th Assembly | Kanna Lakshminarayana | 173 | 0 / 294 | 4 | 264,437 | 0.84 | - | Opposition |
Year | Total Seats | Seats Contested | Seats won | Change in seats | Votes | Percentage of votes | Vote swing |
---|---|---|---|---|---|---|---|
1984 | 30 | 6 | 1 | - | 17,283 | 7.69 | - |
1990 | 60 | Not Contested | |||||
1995 | 60 | 15 | 0 | 14,335 | 3.37 | - | |
1999 | 60 | 23 | 0 | 44,556 | 10.83 | 7.46 | |
2004 | 60 | 39 | 9 | 9 | 87,312 | 19.0 | 8.17 |
2009 | 60 | 18 | 3 | 6 | 29,929 | 5.21 | 13.79 |
2014 | 60 | 42 | 11 | 8 | 157,412 | 30.97 | 25.76 |
2019 | 60 | 60 | 41 | 30 | 315,540 | 50.86 | 19.89 |
Year | Total Seats | Seats Contested | Seats won | Change in seats | Votes | Percentage of votes | Vote swing |
---|---|---|---|---|---|---|---|
1983 | 126 | Not Contested | |||||
1985 | 126 | 37 | 0 | - | 79,068 | 1.07 | - |
1991 | 126 | 48 | 10 | 10 | 548,271 | 6.55 | 5.48 |
1996 | 126 | 117 | 4 | 6 | 946,236 | 10.41 | 4.93 |
2001 | 126 | 46 | 8 | 4 | 995,004 | 9.35 | 1.06 |
2006 | 126 | 125 | 10 | 2 | 1,581,925 | 11.98 | 2.63 |
2011 | 126 | 120 | 5 | 5 | 1,584,895 | 11.47 | 0.51 |
2016 | 126 | 89 | 60 | 55 | 4,992,185 | 29.51 | 18.04 |
2021 | 126 | 93 | 60 | 6,384,538 | 33.21 | 3.7 | |
Year | Legislature | Leader | Seats Contested | Seats won | Change in seats | Votes | Percentage of votes | Vote swing | Outcome |
---|---|---|---|---|---|---|---|---|---|
1980 | 8th Assembly | 246 | 21 / 324 | 21 | 18,91,325 | 8.41% | 8.41% | Opposition | |
1985 | 9th Assembly | 234 | 16 / 324 | 5 | 18,33,275 | 7.54% | 0.87% | Opposition | |
1990 | 10th Assembly | Inder Singh Namdhari | 237 | 39 / 324 | 23 | 37,21,392 | 11.61% | 4.07% | Outside support to Janata Dal |
1995 | 11th Assembly | Yashwant Sinha | 315 | 41 / 324 | 2 | 44,80,363 | 12.96% | 1.35% | Opposition |
2000 | 12th Assembly | Sushil Modi | 168 | 67 / 324 | 26 | 54,24,687 | 14.64% | 1.68% | Opposition |
2005 | 13th Assembly | Gopal Narayan Singh | 103 | 37 / 243 | 30 | 26,86,290 | 10.97% | 3.67% | |
2005 | 14th Assembly | Sushil Modi | 102 | 55 / 243 | 18 | 36,86,720 | 15.65% | 4.68% | Government |
2010 | 15th Assembly | Sushil Modi | 102 | 91 / 243 | 36 | 47,90,436 | 16.49% | 0.84% | Government, later Opposition |
2015 | 16th Assembly | Sushil Modi | 157 | 53 / 243 | 38 | 93,08,015 | 24.42% | 7.93% | Opposition, later Government |
2020 | 17th Assembly | Sanjay Jaiswal | 110 | 74 / 243 | 21 | 82,02,067 | 19.46% | 4.96% | Government, later Opposition |
Year | Total Seats | Seats Contested | Seats won | Change in seats | Votes | Percentage of votes | Vote swing |
---|---|---|---|---|---|---|---|
2003 | 90 | 90 | 50 | - | 3,789,914 | 39.26 | - |
2008 | 90 | 90 | 50 | 4,333,934 | 40.33 | 1.07 | |
2013 | 90 | 90 | 49 | 1 | 5,365,272 | 41.04 | 0.71 |
2018 | 90 | 90 | 15 | 34 | 4,706,830 | 32.97 | 8.07 |
2023 | 90 | 90 | 54 | 39 | 7,234,968 | 46.27 | 13.33 |
Year | Legislature | Leader | Seats Contested | Seats won | Change in seats | Votes | Percentage of votes | Vote swing | Outcome |
---|---|---|---|---|---|---|---|---|---|
1993 | 1st Assembly | Madan Lal Khurana | 70 | 49 / 70 | – | 15,20,675 | 47.82% | New | Government |
1998 | 2nd Assembly | Sushma Swaraj | 67 | 15 / 70 | 34 | 13,90,689 | 34.02% | 13.8% | Opposition |
2003 | 3rd Assembly | Vijay Kumar Malhotra | 70 | 20 / 70 | 5 | 15,89,323 | 35.22% | 1.2% | Opposition |
2008 | 4th Assembly | 69 | 23 / 70 | 3 | 22,44,629 | 36.34% | 1.12% | Opposition | |
2013 | 5th Assembly | Dr. Harsh Vardhan | 68 | 32 / 70 | 9 | 26,04,100 | 33.07% | 3.27% | Opposition |
2015 | 6th Assembly | Kiran Bedi | 69 | 3 / 70 | 29 | 28,90,485 | 32.2% | 0.87% | Opposition |
2020 | 7th Assembly | Manoj Tiwari | 67 | 8 / 70 | 5 | 35,75,529 | 38.51% | 6.31% | Opposition |
Year | Total Seats | Seats Contested | Seats won | Change in seats | Votes | Percentage of votes | Vote swing |
---|---|---|---|---|---|---|---|
1984 | 30 | 16 | 0 | - | 4915 | 1.21 | - |
1989 | 40 | 7 | 0 | 1985 | 0.39 | 0.82 | |
1994 | 40 | 12 | 4 | 4 | 52,094 | 9.05 | 8.66 |
1999 | 40 | 39 | 10 | 6 | 150,959 | 26.15 | 17.1 |
2002 | 40 | 39 | 17 | 7 | 226,350 | 35.57 | 9.42 |
2007 | 40 | 33 | 14 | 3 | 215,605 | 30.32 | 5.25 |
2012 | 40 | 28 | 21 | 7 | 294,392 | 34.68 | 4.36 |
2017 | 40 | 36 | 13 | 8 | 297,588 | 32.48 | 2.2 |
2022 | 40 | 40 | 20 | 7 | 316,573 | 33.3 | 0.82 |
Year | Total Seats | Seats Contested | Seats won | Change in seats | Votes | Percentage of votes | Vote swing |
---|---|---|---|---|---|---|---|
1980 | 182 | 127 | 9 | - | 1,090,652 | 14.02 | - |
1985 | 182 | 124 | 11 | 2 | 1,379,120 | 14.96 | 0.94 |
1990 | 182 | 143 | 67 | 56 | 3,386,256 | 26.69 | 11.73 |
1995 | 182 | 182 | 121 | 54 | 7,672,401 | 42.51 | 15.82 |
1998 | 182 | 182 | 117 | 4 | 7,300,826 | 44.81 | 2.3 |
2002 | 182 | 182 | 127 | 10 | 10,194,353 | 49.85 | 5.04 |
2007 | 182 | 182 | 117 | 10 | 10,739,972 | 49.12 | 0.73 |
2012 | 182 | 182 | 115 | 2 | 13,119,579 | 47.85 | 1.27 |
2017 | 182 | 182 | 99 | 16 | 14,724,031 | 49.05 | 1.2 |
2022 | 182 | 182 | 156 | 57 | 16,707,962 | 52.5 | 3.45 |
Year | Total Seats | Seats Contested | Seats won | Change in seats | Votes | Percentage of votes | Vote swing |
---|---|---|---|---|---|---|---|
1982 | 90 | 24 | 6 | - | 376,604 | 7.67 | - |
1987 | 90 | 20 | 16 | 10 | 613,819 | 10.08 | 2.41 |
1991 | 90 | 89 | 2 | 14 | 582,850 | 9.43 | 0.65 |
1996 | 90 | 25 | 11 | 9 | 672,558 | 8.88 | 0.55 |
2000 | 90 | 29 | 6 | 5 | 684,283 | 8.94 | 0.06 |
2005 | 90 | 90 | 2 | 4 | 949,176 | 10.36 | 1.42 |
2009 | 90 | 90 | 4 | 2 | 857,831 | 9.04 | 1.32 |
2014 | 90 | 90 | 47 | 43 | 4,125,285 | 33.20 | 24.16 |
2019 | 90 | 90 | 40 | 7 | 4,569,016 | 36.49 | 3.29 |
Year | Total Seats | Seats Contested | Seats won | Change in seats | Votes | Percentage of votes | Vote swing |
---|---|---|---|---|---|---|---|
1982 | 68 | 67 | 29 | - | 545,037 | 35.16 | - |
1985 | 68 | 57 | 7 | 22 | 502,252 | 30.61 | 4.55 |
1990 | 68 | 51 | 46 | 39 | 858,518 | 41.78 | 11.17 |
1993 | 68 | 68 | 8 | 38 | 840,233 | 36.14 | 5.64 |
1998 | 68 | 68 | 31 | 23 | 995,482 | 39.02 | 2.88 |
2003 | 68 | 68 | 16 | 25 | 1,079,882 | 35.38 | 3.64 |
2007 | 68 | 68 | 41 | 25 | 1,441,142 | 43.78 | 8.4 |
2012 | 68 | 68 | 26 | 15 | 1,300,756 | 38.47 | 5.31 |
2017 | 68 | 68 | 44 | 18 | 1,846,432 | 48.79 | 10.32 |
2022 | 68 | 68 | 25 | 19 | 1,814,530 | 43.00 | 5.79 |
Year | Total Seats | Seats Contested | Seats won | Change in seats | Votes | Percentage of votes | Vote swing |
---|---|---|---|---|---|---|---|
1983 | 76 | 27 | 0 | - | 70,193 | 3.19 | - |
1987 | 76 | 29 | 2 | 2 | 132,528 | 5.10 | 1.91 |
1996 | 87 | 53 | 8 | 6 | 301,238 | 12.13 | 7.03 |
2002 | 87 | 58 | 1 | 7 | 227,633 | 8.57 | 3.56 |
2008 | 87 | 64 | 11 | 10 | 493,757 | 12.45 | 3.88 |
2014 | 87 | 75 | 25 | 14 | 1,107,194 | 22.98 | 10.53 |
No elections after The Jammu and Kashmir Reorganisation Act In 2019 |
Year | Total Seats | Seats Contested | Seats won | Change in seats | Votes | Percentage of votes | Vote swing |
---|---|---|---|---|---|---|---|
2005 | 81 | 63 | 30 | - | 2,387,130 | 23.57 | - |
2009 | 81 | 67 | 18 | 12 | 2,074,215 | 20.18 | 3.39 |
2014 | 81 | 72 | 37 | 19 | 4,334,728 | 31.26 | 11.08 |
2019 | 81 | 79 | 25 | 12 | 5,022,374 | 33.37 | 2.11 |
Year | Total Seats | Seats Contested | Seats won | Change in seats | Votes | Percentage of votes | Vote swing |
---|---|---|---|---|---|---|---|
1983 | 224 | 110 | 18 | - | 1,024,892 | 7.93 | - |
1985 | 224 | 116 | 2 | 16 | 571,280 | 3.88 | 4.05 |
1989 | 224 | 118 | 4 | 2 | 755,032 | 4.14 | 0.26 |
1994 | 224 | 223 | 40 | 36 | 3,517,119 | 16.99 | 12.85 |
1999 | 224 | 149 | 44 | 4 | 4,598,741 | 20.69 | 3.7 |
2004 | 224 | 198 | 79 | 35 | 7,118,658 | 28.33 | 7.64 |
2008 | 224 | 224 | 110 | 31 | 8,857,754 | 33.86 | 5.53 |
2013 | 224 | 223 | 40 | 70 | 6,236,227 | 19.89 | 13.97 |
2018 | 224 | 223 | 104 | 64 | 13,268,284 | 36.22 | 16.33 |
2023 | 224 | 224 | 66 | 38 | 1,40,96,604 | 36.00 | 0.35 |
Year | Total Seats | Seats Contested | Seats won | Change in seats | Votes | Percentage of votes | Vote swing |
---|---|---|---|---|---|---|---|
1982 | 140 | 69 | 0 | - | 263,331 | 2.75 | - |
1987 | 140 | 116 | 0 | 708,261 | 5.56 | 2.81 | |
1991 | 140 | 137 | 0 | 674,525 | 4.76 | 0.8 | |
1996 | 140 | 127 | 0 | 781,090 | 5.48 | 0.72 | |
2001 | 140 | 123 | 0 | 789,764 | 5.02 | 0.46 | |
2006 | 140 | 136 | 0 | 738,244 | 4.75 | 0.27 | |
2011 | 140 | 138 | 0 | 1,053,654 | 6.03 | 1.28 | |
2016 | 140 | 98 | 1 | 1 | 2,129,726 | 10.53 | 4.5 |
2021 | 140 | 115 | 0 | 1 | 2,354,468 | 11.3 | 0.77 |
Year | Legislature | Leader | Seats Contested | Seats won | Change in seats | Votes | Percentage of votes | Vote swing | Outcome |
---|---|---|---|---|---|---|---|---|---|
1980 | 7th Assembly | Sundar Lal Patwa | 310 | 60 / 320 | - | 3,665,201 | 30.34 | - | Opposition |
1985 | 8th Assembly | Sundar Lal Patwa | 312 | 58 / 320 | 2 | 4,606,133 | 32.45 | 2.11 | Opposition |
1990 | 9th Assembly | Sundar Lal Patwa | 269 | 220 / 320 | 162 | 7,779,942 | 39.14 | 6.69 | Government |
1993 | 10th Assembly | Sundar Lal Patwa | 320 | 117 / 320 | 103 | 9,188,602 | 38.82 | 0.32 | Opposition |
1998 | 11th Assembly | Undeclared | 320 | 119 / 320 | 2 | 10,430,233 | 39.28 | 0.46 | Opposition |
After the state's bifurcation in 2000 | |||||||||
2003 | 12th Assembly | Uma Bharti | 230 | 173 / 230 | - | 10,836,807 | 42.50 | - | Government |
2008 | 13th Assembly | Shivraj Singh Chouhan | 228 | 143 / 230 | 30 | 9,493,641 | 37.64 | 4.86 | Government |
2013 | 14th Assembly | Shivraj Singh Chouhan | 230 | 165 / 230 | 22 | 15,191,335 | 44.88 | 7.24 | Government |
2018 | 15th Assembly | Shivraj Singh Chouhan | 230 | 109 / 230 | 56 | 15,643,623 | 41.02 | 3.86 | Government |
2023 | 16th Assembly | Undeclared | 230 | 163 / 230 | 55 | 21,116,197 | 48.55 | 7.53 | Government |
Year | Total Seats | Seats Contested | Seats won | Change in seats | Votes | Percentage of votes | Vote swing |
---|---|---|---|---|---|---|---|
1980 | 288 | 145 | 14 | - | 1,645,734 | 9.38 | - |
1985 | 288 | 67 | 16 | 2 | 1,590,351 | 7.25 | 2.13 |
1990 | 288 | 104 | 42 | 26 | 3,180,482 | 10.71 | 3.46 |
1995 | 288 | 116 | 65 | 23 | 4,932,767 | 12.80 | 2.09 |
1999 | 288 | 117 | 56 | 9 | 4,776,301 | 14.54 | 1.74 |
2004 | 288 | 111 | 54 | 2 | 5,717,287 | 13.67 | 0.87 |
2009 | 288 | 119 | 46 | 8 | 6,352,147 | 14.02 | 0.35 |
2014 | 288 | 260 | 122 | 76 | 14,709,276 | 27.81 | 13.79 |
2019 | 288 | 164 | 105 | 17 | 14,199,375 | 25.75 | 2.06 |
Year | Total Seats | Seats Contested | Seats won | Change in seats | Votes | Percentage of votes | Vote swing |
---|---|---|---|---|---|---|---|
1984 | 60 | 12 | 0 | - | 6,163 | 0.71 | - |
1990 | 54 | 11 | 0 | 18,549 | 1.87 | 1.16 | |
1995 | 60 | 20 | 1 | 1 | 38,405 | 3.35 | 1.48 |
2000 | 60 | 39 | 6 | 5 | 142,174 | 11.28 | 7.93 |
2002 | 60 | 46 | 4 | 2 | 126,044 | 9.55 | 1.73 |
2007 | 60 | 14 | 0 | 4 | 12,536 | 0.85 | 8.7 |
2012 | 60 | 19 | 0 | 29,663 | 2.12 | 1.27 | |
2017 | 60 | 60 | 21 | 21 | 601,539 | 36.28 | 34.16 |
2022 | 60 | 60 | 32 | 11 | 702,632 | 37.83 | 2.73 |
Year | Total Seats | Seats Contested | Seats won | Change in seats | Votes | Percentage of votes | Vote swing |
---|---|---|---|---|---|---|---|
1993 | 60 | 20 | 0 | - | 29,948 | 3.68 | - |
1998 | 60 | 28 | 3 | 3 | 41,924 | 5.01 | 1.33 |
2003 | 60 | 28 | 2 | 1 | 48,932 | 5.42 | 0.41 |
2008 | 60 | 23 | 1 | 1 | 29,465 | 2.67 | 2.75 |
2013 | 60 | 13 | 0 | 1 | 16,800 | 1.27 | 1.4 |
2018 | 60 | 47 | 2 | 2 | 151,292 | 9.63 | 8.36 |
2023 | 60 | 60 | 2 | 172,042 | 9.33 | 0.3 |
Year | Total Seats | Seats Contested | Seats won | Change in seats | Votes | Percentage of votes | Vote swing |
---|---|---|---|---|---|---|---|
1993 | 40 | 8 | 0 | - | 10,004 | 3.11 | - |
1998 | 40 | 12 | 0 | 8,448 | 2.50 | 0.61 | |
2003 | 40 | 8 | 0 | 7,823 | 1.87 | 0.63 | |
2008 | 40 | 9 | 0 | 2,222 | 0.44 | 1.43 | |
2013 | 40 | 17 | 0 | 2,139 | 0.37 | 0.07 | |
2018 | 40 | 39 | 1 | 1 | 51,087 | 8.09 | 7.72 |
2023 | 40 | 23 | 2 | 1 | 35,524 | 5.06 | 3.03 |
Year | Total Seats | Seats Contested | Seats won | Change in seats | Votes | Percentage of votes | Vote swing |
---|---|---|---|---|---|---|---|
1987 | 60 | 2 | 0 | - | 926 | 0.19 | - |
1989 | 60 | Not Contested | |||||
1993 | 60 | 6 | 0 | - | 2,561 | 0.35 | - |
1998 | 60 | Not Contested | |||||
2003 | 60 | 38 | 7 | - | 96,658 | 10.88 | - |
2008 | 60 | 23 | 2 | 5 | 60,627 | 5.35 | 5.53 |
2013 | 60 | 11 | 1 | 1 | 19,121 | 1.75 | 3.6 |
2018 | 60 | 20 | 12 | 11 | 153,864 | 15.31 | 13.56 |
2023 | 60 | 20 | 12 | 215,336 | 18.81 | 3.5 |
Year | Total Seats | Seats Contested | Seats won | Change in seats | Votes | Percentage of votes | Vote swing |
---|---|---|---|---|---|---|---|
1980 | 147 | 28 | 0 | - | 86,421 | 1.36 | - |
1985 | 147 | 67 | 1 | 1 | 204,346 | 2.60 | 1.24 |
1990 | 147 | 63 | 2 | 1 | 390,060 | 3.56 | 0.96 |
1995 | 147 | 144 | 9 | 7 | 1,245,996 | 7.88 | 4.32 |
2000 | 147 | 63 | 38 | 29 | 2,570,074 | 18.20 | 10.32 |
2004 | 147 | 63 | 32 | 6 | 2,898,105 | 17.11 | 1.09 |
2009 | 147 | 145 | 6 | 26 | 2,674,067 | 15.05 | 2.06 |
2014 | 147 | 147 | 10 | 4 | 3,874,748 | 17.99 | 2.94 |
2019 | 147 | 146 | 23 | 13 | 7,612,449 | 32.49 | 14.5 |
Year | Assembly | Total Seats | Seats Contested | Seats won | Change in seats | Votes | Percentage of votes | Vote swing | Nominated MLAs |
---|---|---|---|---|---|---|---|---|---|
1985 | 7th | 30 | 3 | 0 | - | 158 | 0.05 | 0.05 | 0 |
1990 | 8th | 30 | 8 | 0 | 2,154 | 0.51 | 0.46 | 0 | |
1991 | 9th | 30 | 12 | 0 | 3,045 | 0.78 | 0.27 | 0 | |
1996 | 10th | 30 | 14 | 0 | 5,217 | 1.13 | 0.35 | 0 | |
2001 | 11th | 30 | 5 | 1 | 1 | 22,164 | 4.65 | 3.52 | 0 |
2006 | 12th | 30 | 27 | 0 | 1 | 17,356 | 3.07 | 1.58 | 0 |
2011 | 13th | 30 | 20 | 0 | 9,183 | 1.32 | 1.75 | 1 | |
2016 | 14th | 30 | 30 | 0 | 19,303 | 2.41 | 1.09 | 3 | |
2021 | 15th | 30 | 9 | 6 | 6 | 114,298 | 13.66 | 11.25 | 3 [12] |
Year | Total Seats | Seats Contested | Seats won | Change in seats | Votes | Percentage of votes | Vote swing |
---|---|---|---|---|---|---|---|
1980 | 117 | 41 | 1 | - | 405,106 | 6.48 | - |
1985 | 117 | 26 | 6 | 5 | 345,560 | 4.99 | 1.49 |
1992 | 117 | 66 | 6 | 495,161 | 16.48 | 11.49 | |
1997 | 117 | 22 | 18 | 12 | 857,219 | 8.33 | 8.15 |
2002 | 117 | 23 | 3 | 15 | 583,214 | 5.67 | 2.66 |
2007 | 117 | 23 | 19 | 16 | 1,046,451 | 8.28 | 2.61 |
2012 | 117 | 23 | 12 | 7 | 998,098 | 7.18 | 1.1 |
2017 | 117 | 23 | 3 | 9 | 833,092 | 5.39 | 1.79 |
2022 | 117 | 73 | 2 | 1 | 1,027,143 | 6.60 | 1.21 |
Year | Total Seats | Seats Contested | Seats won | Change in seats | Votes | Percentage of votes | Vote swing |
---|---|---|---|---|---|---|---|
1980 | 200 | 123 | 32 | - | 1,721,321 | 18.60 | - |
1985 | 200 | 118 | 39 | 7 | 2,437,594 | 21.24 | 2.64 |
1990 | 200 | 128 | 85 | 46 | 3,744,945 | 25.25 | 4.01 |
1993 | 199 | 196 | 95 | 10 | 6498330 | 38.60 | 13.35 |
1998 | 200 | 196 | 33 | 62 | 6,258,509 | 33.23 | 5.37 |
2003 | 200 | 197 | 120 | 87 | 8,929,572 | 39.20 | 5.97 |
2008 | 200 | 193 | 78 | 42 | 8,258,966 | 34.27 | 4.93 |
2013 | 200 | 200 | 163 | 85 | 13,939,203 | 45.17 | 10.9 |
2018 | 200 | 200 | 73 | 90 | 13,829,046 | 38.77 | 6.4 |
2023 | 200 | 200 | 115 | 42 | 16,608,741 | 41.70 | 2.93 |
Year | Total Seats | Seats Contested | Seats won | Change in seats | Votes | Percentage of votes | Vote swing |
---|---|---|---|---|---|---|---|
1994 | 32 | 3 | 0 | - | 274 | 0.16 | - |
1999 | 32 | Not Contested | |||||
2004 | 32 | 4 | 0 | - | 667 | 0.34 | - |
2009 | 32 | 11 | 0 | 1,966 | 0.78 | 0.44 | |
2014 | 32 | 13 | 0 | 2208 | 0.71 | 0.07 | |
2019 | 32 | 12 | 0 | 5,700 | 1.62 | 0.91 | |
2024 | 32 |
Year | Total Seats | Seats Contested | Seats won | Change in seats | Votes | Percentage of votes | Vote swing |
---|---|---|---|---|---|---|---|
1980 | 234 | 10 | 0 | - | 13,177 | 0.07 | - |
1984 | 234 | 15 | 0 | 54,390 | 0.25 | 0.18 | |
1989 | 234 | 31 | 0 | 84,865 | 0.35 | 0.10 | |
1991 | 234 | 99 | 0 | 419,229 | 1.70 | 1.35 | |
1996 | 234 | 143 | 1 | 1 | 490,453 | 1.81 | 0.11 |
2001 | 234 | 21 | 4 | 3 | 895,352 | 3.19 | 1.38 |
2006 | 234 | 225 | 0 | 4 | 666,823 | 2.02 | 1.17 |
2011 | 234 | 204 | 0 | 819,577 | 2.22 | 0.20 | |
2016 | 234 | 188 | 0 | 1,228,704 | 2.84 | 0.62 | |
2021 | 234 | 20 | 4 | 4 | 1,213,510 | 2.62 | 0.22 |
Year | Total Seats | Seats Contested | Seats won | Change in seats | Votes | Percentage of votes | Vote swing |
---|---|---|---|---|---|---|---|
2018 | 119 | 117 | 1 | - | 1,443,799 | 6.98 | - |
2023 | 119 | 111 | 8 | 7 | 3,257,511 | 13.90 | 6.92 |
Year | Total Seats | Seats Contested | Seats won | Change in seats | Votes | Percentage of votes | Vote swing |
---|---|---|---|---|---|---|---|
1983 | 60 | 4 | 0 | - | 578 | 0.06 | - |
1988 | 60 | 10 | 0 | 1,757 | 0.15 | 0.09 | |
1993 | 60 | 38 | 0 | 27,078 | 2.02 | 1.87 | |
1998 | 60 | 60 | 0 | 80,272 | 5.87 | 3.85 | |
2003 | 60 | 21 | 0 | 20,032 | 1.32 | 4.55 | |
2008 | 60 | 49 | 0 | 28,102 | 1.49 | 0.17 | |
2013 | 60 | 50 | 0 | 33,808 | 1.54 | 0.05 | |
2018 | 60 | 51 | 36 | 36 | 1,025,673 | 43.59 | 42.05 |
2023 | 60 | 55 | 32 | 3 | 985,797 | 38.97 | 4.62 |
Year | Total Seats | Seats Contested | Seats won | Change in seats | Votes | Percentage of votes | Vote swing |
---|---|---|---|---|---|---|---|
1980 | 425 | 400 | 11 | - | 2,777,731 | 10.76 | - |
1985 | 425 | 347 | 16 | 5 | 2,890,884 | 9.83 | 0.93 |
1989 | 425 | 275 | 57 | 41 | 4,522,867 | 11.61 | 1.78 |
1991 | 425 | 415 | 221 | 164 | 11,770,214 | 31.45 | 19.84 |
1996 | 424 | 422 | 177 | 44 | 16,637,720 | 33.30 | 1.85 |
After the state's bifurcation in 2000 | |||||||
2002 | 403 | 320 | 88 | - | 10,776,078 | 20.08 | - |
2007 | 403 | 350 | 51 | 37 | 8,851,199 | 16.97 | 3.11 |
2012 | 403 | 398 | 47 | 4 | 11,371,080 | 15.00 | 1.97 |
2017 | 403 | 384 | 312 | 265 | 34,403,299 | 39.67 | 24.67 |
2022 | 403 | 376 | 255 | 57 | 38,051,721 | 41.29 | 1.62 |
Year | Total Seats | Seats Contested | Seats won | Change in seats | Votes | Percentage of | Vote swing |
---|---|---|---|---|---|---|---|
2002 | 70 | 69 | 19 | - | 728,134 | 25.45 | - |
2007 | 69 | 69 | 34 | 15 | 1,203,726 | 31.90 | 6.45 |
2012 | 70 | 70 | 31 | 3 | 1,4083,41 | 33.13 | 1.23 |
2017 | 70 | 70 | 57 | 26 | 2,314,250 | 46.51 | 13.38 |
2022 | 70 | 70 | 47 | 10 | 2,383,838 | 44.33 | 3.18 |
Year | Total Seats | Seats Contested | Seats won | Change in seats | Votes | Percentage of | Vote swing |
---|---|---|---|---|---|---|---|
1982 | 294 | 52 | 0 | - | 129,994 | 0.58 | - |
1987 | 294 | 57 | 0 | 134,867 | 0.51 | 0.07 | |
1991 | 294 | 291 | 0 | 3,513,121 | 11.34 | 10.76 | |
1996 | 294 | 292 | 0 | 2,372,480 | 6.45 | 4.89 | |
2001 | 294 | 266 | 0 | 1,901,351 | 5.19 | 1.26 | |
2006 | 294 | 29 | 0 | 760,236 | 1.93 | 3.26 | |
2011 | 294 | 289 | 0 | 1,934,650 | 4.06 | 2.13 | |
2016 | 294 | 291 | 3 | 3 | 5,555,134 | 10.16 | 6.1 |
2021 | 292 | 291 | 77 | 74 | 22,850,710 | 38.13 | 27.97 |
The Communist Party of India (Marxist) (abbreviated as CPI(M)) is a communist political party in India. It is the largest communist party in India in terms of membership and electoral seats, and one of the national parties of India. The party was founded through a splitting from the Communist Party of India in 1964 and it quickly became the dominant fraction.
The Telugu Desam Party is an Indian regional political party with great influence in the states of Andhra Pradesh and Telangana. It was founded by the former chief minister of Andhra Pradesh N. T. Rama Rao (N.T.R.) on 29 March 1982 and has focused on supporting Telugu speakers. The party has won a five-time majority in the Andhra Pradesh Legislative Assembly and has emerged as the most successful political outfit in the state's history. It is currently the main opposition party in the Andhra Pradesh Legislative Assembly.
Elections in Sikkim have been held in the Indian state of Sikkim between 1953 and 1974, before its integration with India, and since 1979 after its integration. The total number of seats in the assembly is 32, including one seat reserved for the Sangha.
Sikkim Democratic Front (SDF) is a regional political party in the Indian state of Sikkim. It was the ruling party in Sikkim from 12 December 1994 to 23 May 2019.
Mizoram is the only Lok Sabha constituency in the Northeast Indian state of Mizoram, and covers the entire area of the state. The seat is reserved for Scheduled Tribes. Its first member of parliament (MP) was Sangliana of the Mizo Union who represented this constituency in the Fifth Lok Sabha when it became a union territory on 21 January 1972. On 20 February 1987, Mizoram was converted into a State of India. As of the 2019 elections, this constituency's MP is C. Lalrosanga of the Mizo National Front.
Nagaland Lok Sabha constituency is the only Lok Sabha constituency in the Northeastern state of Nagaland.
Puducherry Lok Sabha constituency covers the entire Union Territory of Puducherry. Pondicherry became a union territory after the implementation of the Fourteenth Amendment of the Constitution of India in 1962 and changed its name to Puducherry in 2006. This constituency first held elections in 1967 and its first member of parliament (MP) was Thirumudi N. Sethuraman of the Indian National Congress.
Sikkim Lok Sabha constituency is a Lok Sabha constituency which covers the entire area of the state of Sikkim.
Lakshadweep Lok Sabha constituency is a Lok Sabha constituency, which covers the entire area of the Union Territory of Lakshadweep in India. This seat is reserved for Scheduled Tribes. As of 2014, it is the smallest Lok Sabha constituency in terms of electorate. Lakshadweep didn't have an elected Member of Parliament till 1967.
Adilabad Lok Sabha constituency is one of the 17 Lok Sabha constituencies in the state of Telangana, India. This constituency is reserved for the candidates belonging to the Scheduled Tribes.
Gandhinagar Lok Sabha constituency is one of the 26 Lok Sabha constituencies in Gujarat, a state in Western India. Gandhinagar is the capital of Gujarat. It is one of the most prestigious parliamentary constituencies in India, being represented by former Prime Minister Atal Bihari Vajpayee, former Deputy Prime Minister LK Advani and the current Home Minister and former BJP chief Amit Shah. The constituency was created in 1967 and its first member of parliament (MP) was Somchandbhai Solanki of the Indian National Congress (INC).
Vadodara is one of the 26 Lok Sabha constituencies in Gujarat, a state in Western India. This constituency covers 7 out of 10 Vidhan Sabha constituencies of Vadodara district and first held elections in 1957 as Baroda Lok Sabha constituency in erstwhile Bombay State. It has been known as Vadodara since the 2009 elections. Its first member of parliament (MP) was Fatehsinghrao Gaekwad of the Indian National Congress (INC) who was also re-elected in the next elections in 1962. He was the Maharaja of Baroda of the Gaekwad dynasty at the time. P. C. Patel of the Swatantra Party won the election in 1967. From 1971–80, Gaekwad was MP of this constituency again firstly as a member of the Indian National Congress (Organisation) and then as a member of the INC. His younger brother, Ranjitsinh Pratapsinh Gaekwad also of the INC represented the constituency from 1980–89 for two terms before being defeated by Prakash Brahmbhatt of the Janata Dal party in the 1989 election.
Amethi is one of the 80 Lok Sabha constituencies in the Indian state of Uttar Pradesh. This constituency covers the entire Amethi district and was created in 1967. Its first member of parliament (MP) was Vidya Dhar Bajpai of the Indian National Congress (INC) who was elected in 1967 and held his seat in the next election in 1971. In the 1977 election, Ravindra Pratap Singh of the Janata Party became its MP. Singh was defeated in 1980 by Sanjay Gandhi of the INC. Later the same year, Gandhi died in a plane crash. This forced a by election in 1981 which was won by his brother, Rajiv Gandhi. Gandhi went on to represent this constituency until 1991, when he was assassinated by the Liberation Tigers of Tamil Eelam (LTTE). The subsequent by election held the same year was won by Satish Sharma of the INC. Sharma was re-elected in 1996. Sanjaya Sinh of the Bharatiya Janata Party (BJP) defeated Sharma in the 1998 election. The widow of Rajiv Gandhi, Sonia Gandhi represented this constituency from 1999 to 2004. Her son, Rahul Gandhi, was elected in 2004. He was the fourth MP from the Nehru–Gandhi family since 1980 to represent the seat. Gandhi held the seat till the 2019 election when he was defeated by a margin of 55,000 votes by the BJP's Smriti Irani.
Bangalore North Lok Sabha constituency is one of the 28 Lok Sabha constituencies in the South Indian state of Karnataka. This constituency has been known by different names in its history. For the 1951 and every election since 1977 it has been known as Bangalore North. For the 1957 and 1962 elections it was known as Bangalore City. For the 1967 and 1971 elections it formed a constituency jointly with Bangalore South and was known as Bangalore. From 1951–73, this constituency resided in Mysore State. On 1 November 1973, Mysuru State was renamed as Karnataka.
Mayiladuthurai is a Lok Sabha constituency in Tamil Nadu. Its Tamil Nadu Parliamentary Constituency number is 28 of 39. It spreads on two districts, Mayiladuthurai and Thanjavur.
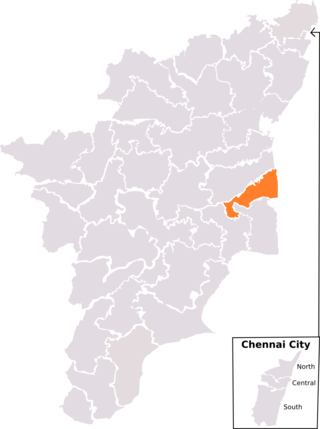
Nagapattinam is a Lok Sabha constituency in Tamil Nadu. Its Tamil Nadu Parliamentary Constituency number is 29 of 39. The seat is reserved for scheduled castes. The constituency is noted for being an historically communist stronghold, having elected Communist Party of India parliamentary representative seven times.
The Sikkim Pradesh Congress Committee(SPCC) is the unit of the Indian National Congress for the state of Sikkim, India. It is responsible for organizing and coordinating the party's activities and campaigns within the state, as well as selecting candidates for local, state, and national elections. Its head office is situated in Gangtok.
Meghraj Tawar is an Indian politician. He is a leader of the Communist Party of India. He represented Gogunda constituency in Rajasthan Legislative Assembly from 1980 to 1985. He is a prominent profile of the party amongst the local Adivasi community.
Gopal Kalan Tandel is an Indian politician. He was a Member of Parliament in the 8th and 1996-1998 in 11th Lok Sabha. He was the first parliamentarian to represent Daman and Diu in the Lok Sabha. He has been part of Indian National Congress, Bharatiya Janata Party, and currently Bharatiya Janata Party.
South Kanara (South) Lok Sabha constituency was a former Lok Sabha constituency in Madras State. This seat came into existence in 1951. With the implementation of States Reorganisation Act, 1956, it ceased to exist.