Electricity sector in Japan

Last updated

Electricity production in Japan by source. Electricity production in Japan.svg
Electricity production in Japan by source.
Electricity sector of Japan
Data
Production (2014)995.26 TWh
Share of renewable energy 9.7% (2009)

The electric power industry in Japan covers the generation, transmission, distribution, and sale of electric energy in Japan. Japan consumed approximately 918 terawatt-hours (TWh) of electricity in 2014. [1] Before the 2011 Fukushima Daiichi nuclear disaster, about a quarter of electricity in the country was generated by nuclear power. In the following years, most nuclear power plants have been on hold, being replaced mostly by coal and natural gas. Solar power is a growing source of electricity, and Japan has the third largest solar installed capacity with about 50 GW as of 2017. Japan's electricity production is characterized by a diverse energy mix, including nuclear, fossil fuels, renewable energy, and hydroelectric power.

Contents

Japan has the second largest pumped-hydro storage installed capacity in the world after China.[ citation needed ]

The electrical grid in Japan is isolated, with no international connections, and consists of four wide area synchronous grids. Unusually the Eastern and Western grids run at different frequencies (50 and 60 Hz respectively) and are connected by HVDC connections. This considerably limits the amount of electricity that can be transmitted between the north and south of the country.

During the Second Sino-Japanese War and the succeeding Pacific War, the entirety of Japan's electricity sector was state-owned; the system at the time consisted of a Japan Electric Generation and Transmission Company ( 日本発送電株式会社, Nippon Hassōden kabushiki gaisha, otherwise known as Nippon Hassōden KK or Nippatsu) and several electricity distributors. At the behest of the Supreme Commander for the Allied Powers, Nippon Hassōden became the Electric Power Development Co., Limited in the fifties; and almost all of the electricity sector that are not under the control by EPDC was privatized into nine government-granted monopolies. The Ryukyu Islands electricity provider was, during the USCAR era, publicly owned; it was privatized shortly after the islands' admission into Japan.

Consumption

In 2008, Japan consumed an average of 8507 kWh/person of electricity. That was 115% of the EU15 average of 7409 kWh/person and 95% of the OECD average of 8991 kWh/person. [2]

Electricity per person in Japan (kWh/ hab.) [2]
UseProductionImportImp. %Fossil Nuclear Nuc.  %Other RE Bio+waste* Wind Non RE use* RE  %
20048,4598,45905,2572,21226.1%8441467,46911.7%
20058,6338,63305,3782,38727.6%7151537,76510.1%
20069,0429,04206,1052,06622.8%7161548,1719.6%
20088,5078,50705,6692 01023.6%6821477,6799.7%
20098,1698,16905,1782,19826.9%637*12827*7,3779.7%
* Other RE is waterpower, solar and geothermal electricity and wind power until 2008
* Non RE use = use – production of renewable electricity
* RE % = (production of RE / use) * 100% Note: European Union calculates the share of renewable energies in gross electrical consumption.

Compared with other nations, electricity in Japan is relatively expensive. [3]

Liberalization of the electricity market

Since the Fukushima Daiichi nuclear disaster, and the subsequent large scale shutdown on the nuclear power industry, Japan's ten regional electricity operators have been making very large financial losses, larger than US$15 billion in both 2012 and 2013. [4]

Since then steps have been made to liberalize the electricity supply market. [4] [5] In April 2016 domestic and small business mains voltage customers became able to select from over 250 supplier companies competitively selling electricity, but many of them sell only locally, mainly in large cities. Also wholesale electricity trading on the Japan Electric Power Exchange (JEPX), which previously traded only 1.5% of power generation, was encouraged. [6] [7] By June 2016 more than 1 million consumers had changed supplier. [8] However total costs of liberalization to that point were around ¥80 billion, so it is unclear if consumers had benefited financially. [8] [9]

In 2020 transmission and distribution infrastructure access will be made more open, which will help competitive suppliers cut costs. [8]

Transmission

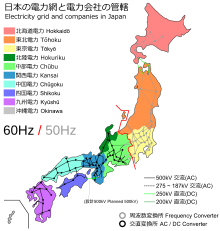
Map of Japan's electricity transmission network, showing differing systems between regions Power Grid of Japan.svg
Map of Japan's electricity transmission network, showing differing systems between regions

Electricity transmission in Japan is unusual because the country is divided for historical reasons into two regions each running at a different mains frequency. [10] Eastern Japan has 50 Hz networks while western Japan has 60 Hz networks. [10] [11] Limitations of conversion capacity causes a bottleneck to transfer electricity and shift imbalances between the networks. [10] [11]

Eastern Japan (consisting of Hokkaido, Tohoku, Kanto, and eastern parts of Chubu) runs at 50 Hz; Western Japan (including most of Chubu, Kansai, Chugoku, Shikoku, and Kyushu) runs at 60 Hz. [10] [12] That originates from the first purchases of generators from AEG for Tokyo in 1895 and from General Electric for Osaka in 1896. [13] [14]

The frequency difference partitions Japan's national grid and so power can be moved only between the two parts of the grid using frequency converters, or HVDC transmission lines. The boundary between the two regions has four back-to-back HVDC substations, which convert the frequency: Shin Shinano, Sakuma Dam, Minami-Fukumitsu, and the Higashi-Shimizu Frequency Converter.[ citation needed ] The total transmission capacity between the two grids is 1.2 GW. [15]

The limitations of these links have been a major problem in providing power to the areas of Japan affected by the Fukushima Daiichi nuclear disaster. [13] During the 2011 Tōhoku earthquake and tsunami, there were blackouts in some areas of the country because of the insufficient ability of the three HVDC converter stations to transfer energy between both networks. [12]

A few projects are underway to increase the electricity transfer between the 50 Hz (eastern Japan) and 60 Hz networks (western Japan) which will improve power reliability in Japan. [11] In April 2019, Hitachi ABB HVDC Technologies secured an HVDC order for the Higashi Shimizu project to increase the interconnection capacity between the 60Hz area of Chubu Electric and the 50Hz area of TEPCO from 1.2GW to 3GW. [11] Chubu Electric will increase the interconnection capacity of the Higashi Shimizu Substation from 300MW to 900MW which should be operational by 2027. [11] OCCTO (Organization for Cross-regional Coordination of Transmission Operators) supervises the power interchange among electric power companies. [11]

Mode of production

Gross production of electricity by source in Japan (TWh) [16] [17] [18] [19] [20] [21] [22] [23]
YearTotalCoalGasOilNuclearHydroSolarWindGeothermal
20041,12129426.2%25622.9%16915.0%28225.2%1039.2%
20081,10830027.1%29226.3%15413.9%25823.3%847.5%
20091,07529027.0%30228.1%989.1%28026.0%847.8%
20101,14831027.0%31927.8%1008.7%28825.1%917.9%3.8000.33%3.9620.35%2.6470.23%
20111,08229126.9%38835.8%16615.4%1029.4%928.5%5.1600.48%4.5590.42%2.6760.25%
20121,06431429.5%40938.4%19518.3%161.5%847.9%6.9630.65%4.7220.44%2.6090.24%
20131,06634932.7%40838.2%16015.0%90.9%858.0%14.2791.34%4.2860.4%0.2960.03%
20141,04134933.5%42140.4%11611.2%00%878.4%24.5062.35%5.0380.48%2.5770.25%
20151,00934234.0%39639.2%919.0%90.9%858.4%35.8583.55%5.160.51%2.5820.26%

According to the International Energy Agency, Japanese gross production of electricity was 1,041 TWh in 2009, making it the world's third largest producer of electricity with 5.2% of the world's electricity. [24] [25] After Fukushima, Japan imported an additional 10 million short tons of coal and liquefied natural gas imports rose 24% between 2010 and 2012. In 2012 Japan used most of its natural gas (64%) in the power sector. [26]

Nuclear power

The 2011 Fukushima Daiichi nuclear disaster, the worst nuclear accident in 25 years, displaced 50,000 households after radiation leaked into the air, soil and sea. Radiation checks led to bans of some shipments of vegetables and fish. Fukushima I by Digital Globe crop.jpg
The 2011 Fukushima Daiichi nuclear disaster, the worst nuclear accident in 25 years, displaced 50,000 households after radiation leaked into the air, soil and sea. Radiation checks led to bans of some shipments of vegetables and fish.
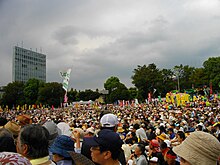
Anti-Nuclear Power Plant Rally on 19 September 2011 at Meiji Shrine complex in Tokyo. Anti-Nuclear Power Plant Rally on 19 September 2011 at Meiji Shrine Outer Garden 03.JPG
Anti-Nuclear Power Plant Rally on 19 September 2011 at Meiji Shrine complex in Tokyo.

Nuclear power was a national strategic priority in Japan. Following the 2011 Fukushima nuclear accidents, the national nuclear strategy is in doubt due to increasing public opposition to nuclear power. An energy white paper, approved by the Japanese Cabinet in October 2011, reported that "public confidence in safety of nuclear power was greatly damaged" by the Fukushima disaster, and it calls for a reduction in the nation's reliance on nuclear power. [29]

Following the 2011 accident, many reactors were shut down for inspection and for upgrades to more stringent safety standards. By October 2011, only 11 nuclear power plants were operating in Japan, [30] [31] [32] and all 50 nuclear reactors were offline by 15 September 2013. That left Japan without nuclear energy for only the second time in almost 50 years. [33] Carbon dioxide emissions from the electricity industry rose in 2012, reaching levels 39% more than when the reactors were in operation. [34]

Sendai 1 reactor was restarted on 11 August 2015, the first reactor to meet new safety standards and be restarted after the shutdown. [35] As of July 2018, there are nine reactors that have been restarted. [36]

Hydro power

Hydroelectricity is Japan's main renewable energy source, with an installed capacity of about 27 GW, or 16% of the total generation capacity, of which about half is pumped-storage. The production was 73 TWh in 2010. [37] As of September 2011, Japan had 1,198 small hydropower plants with a total capacity of 3,225 MW. The smaller plants accounted for 6.6 percent of Japan's total hydropower capacity. The remaining capacity was filled by large and medium hydropower stations, typically sited at large dams.

Other renewables

Benjamin K. Sovacool estimated that Japan has a total of "324 GW of achievable potential in the form of onshore and offshore wind turbines (222 GW), geothermal power plants (70  GW), additional hydroelectric capacity (26.5 GW), solar energy (4.8 GW) and agricultural residue (1.1 GW)." [38]

One result of the Fukushima Daiichi nuclear disaster could be renewed public support for the commercialization of renewable energy technologies. [39] The Japanese government announced in May 2011 a goal of producing 20% of the nation's electricity from renewable sources, including solar, wind, and biomass, by the early 2020s. [40] In August 2011, the Japanese Government passed a bill to subsidize electricity from renewable energy sources. The legislation will become effective on 1 July 2012, and require utilities to buy electricity generated by renewable sources including solar power, wind power and geothermal energy at above-market rates. [41]

In 2011 Japan planned to build as many as 80 floating wind turbines off Fukushima by 2020. [42] In 2020, seven years after the world's first pilot floating wind turbine was installed off Fukushima in 2013, the Japanese government announced its withdrawal from the offshore wind farm. [43]

Power stations

Grid storage

Japan relies mostly on pumped storage hydroelectricity to balance demand and supply. As of 2014, Japan has the largest pumped storage capacity in the world, with over 27 GW. [44]

See also

Related Research Articles

<span class="mw-page-title-main">Electricity generation</span> Process of generating electrical power

Electricity generation is the process of generating electric power from sources of primary energy. For utilities in the electric power industry, it is the stage prior to its delivery to end users or its storage.

<span class="mw-page-title-main">Electricity sector in Norway</span>

The electricity sector in Norway relies predominantly on hydroelectricity. A significant share of the total electrical production is consumed by national industry.

<span class="mw-page-title-main">Energy development</span> Methods bringing energy into production

Energy development is the field of activities focused on obtaining sources of energy from natural resources. These activities include the production of renewable, nuclear, and fossil fuel derived sources of energy, and for the recovery and reuse of energy that would otherwise be wasted. Energy conservation and efficiency measures reduce the demand for energy development, and can have benefits to society with improvements to environmental issues.

India is the third largest producer of electricity in the world. During the fiscal year (FY) 2022–23, the total electricity generation in the country was 1,844 TWh, of which 1,618 TWh was generated by utilities.

<span class="mw-page-title-main">Energy in Japan</span> Overview of the production, consumption, import and export of energy and electricity in Japan

Japan is a major consumer of energy, ranking fifth in the world by primary energy use. Fossil fuels accounted for 88% of Japan's primary energy in 2019. Japan imports most of its energy due to scarce domestic resources. As of 2022, the country imports 97% of its oil and is the larger LNG importer globally.
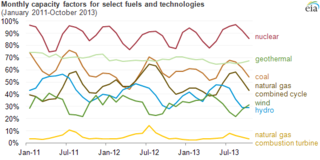
<span class="mw-page-title-main">Capacity factor</span> Electrical production measure

The net capacity factor is the unitless ratio of actual electrical energy output over a given period of time to the theoretical maximum electrical energy output over that period. The theoretical maximum energy output of a given installation is defined as that due to its continuous operation at full nameplate capacity over the relevant period. The capacity factor can be calculated for any electricity producing installation, such as a fuel consuming power plant or one using renewable energy, such as wind, the sun or hydro-electric installations. The average capacity factor can also be defined for any class of such installations, and can be used to compare different types of electricity production.

<span class="mw-page-title-main">Energy in Brazil</span> Overview of the production, consumption, import and export of energy and electricity in Brazil

Brazil is the 7th largest energy consumer in the world and the largest in South America. At the same time, it is an important oil and gas producer in the region and the world's second largest ethanol fuel producer. The government agencies responsible for energy policy are the Ministry of Mines and Energy (MME), the National Council for Energy Policy (CNPE), the National Agency of Petroleum, Natural Gas and Biofuels (ANP) and the National Agency of Electricity (ANEEL). State-owned companies Petrobras and Eletrobras are the major players in Brazil's energy sector, as well as Latin America's.

For solar power, South Asia has the ideal combination of both high solar insolation and a high density of potential customers.
<span class="mw-page-title-main">Chubu Electric Power</span> Japanese electric utilities provider

Chubu Electric Power Co., Inc., abbreviated as Chuden in Japanese, is a Japanese electric utilities provider for the middle Chūbu region of the Honshu island of Japan. It provides electricity at 60 Hz, though an area of Nagano Prefecture uses 50 Hz. Chubu Electric Power ranks third among Japan's largest electric utilities in terms of power generation capacity, electric energy sold, and annual revenue. It is also one of Nagoya's "four influential companies" along with Meitetsu, Matsuzakaya, and Toho Gas. Recently, the company has also expanded into the business of optical fibers. On January 1, 2006, a new company, Chubu Telecommunications, was formed.

<span class="mw-page-title-main">Energy in Romania</span>

Energy in Romania describes energy and electricity production, consumption and import in Romania.

<span class="mw-page-title-main">Solar power in Japan</span>

Solar power in Japan has been expanding since the late 1990s. The country is a major manufacturer and exporter of photovoltaics (PV) and a large installer of domestic PV systems, with most of them grid connected.

<span class="mw-page-title-main">Electricity sector in China</span>

China is the world's largest electricity producer, having overtaken the United States in 2011 after rapid growth since the early 1990s. In 2021, China produced 8.5 petawatt-hour (PWh) of electricity, approximately 30% of the world's electricity production.

<span class="mw-page-title-main">Electricity sector in Sweden</span> Overview of the electricity sector in Sweden

Majority of electricity production in Sweden relies on hydro power and nuclear power. In 2008 the consumption of electricity in Sweden was 16018 kWh per capita, compared to EU average 7409 kWh per capita. Sweden has a national grid, which is part of the Synchronous grid of Northern Europe. A specialty of the Nordic energy market is the existence of so-called electricity price areas, which complicate the wholesale Nordic energy market.

<span class="mw-page-title-main">Electricity sector in the United Kingdom</span> Overview of the electricity sector in the United Kingdom

The United Kingdom has a National Grid that covers most of mainland Great Britain and several of the surrounding islands, as well as some connectivity to other countries. The electrical sector supplies power to consumers at 230 volts AC with a frequency of 50 Hz. In 2020 the electricity sector's grid supply came from 55% low-carbon power, 36.1% fossil fuelled power, and 8.4% imports. Renewable power is showing strong growth, while fossil fuel generator use in general and coal use in particular is shrinking, with historically dominant coal generators now mainly being run in winter due to pollution and costs, and contributed just 1.6% of the supply in 2020.
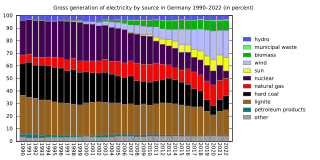
<span class="mw-page-title-main">Electricity sector in Germany</span> Overview of the electricity sector in Germany

Germany's electrical grid is part of the Synchronous grid of Continental Europe. In 2020, due to COVID-19 conditions and strong winds, Germany produced 484 TW⋅h of electricity of which over 50% was from renewable energy sources, 24% from coal, and 12% from natural gas. This is the first year renewables represented more than 50% of the total electricity production and a major change from 2018, when a full 38% was from coal, only 40% was from renewable energy sources, and 8% was from natural gas.
<span class="mw-page-title-main">Electricity sector in France</span> Overview of the electricity sector in France

The electricity sector in France is dominated by its nuclear power, which accounted for 71.7% of total production in 2018, while renewables and fossil fuels accounted for 21.3% and 7.1%, respectively. France has the largest share of nuclear electricity in the world, and together with renewable energy supplies, this has helped its grid achieve very low carbon intensity.

<span class="mw-page-title-main">Electricity sector in Russia</span> Overview of the electricity sector in Russia

Russia is the fourth largest generator and consumer of electricity in the world. Its 440 power stations have a combined installed generation capacity of 220 GW.

<span class="mw-page-title-main">Electricity sector in Switzerland</span> Overview of the electricity sector in Switzerland

The electricity sector in Switzerland relies mainly on hydroelectricity, since the Alps cover almost two-thirds of the country's land mass, providing many large mountain lakes and artificial reservoirs suited for hydro power. In addition, the water masses drained from the Swiss Alps are intensively used by run-of-the-river hydroelectricity (ROR). With 9,052 kWh per person in 2008, the country's electricity consumption is relatively high and was 22% above the European Union's average.
<span class="mw-page-title-main">Energy in California</span> Overview of the use of energy in California, U.S.

Energy in California is a major area of the economy of California. California is the state with the largest population and the largest economy in the United States. It is second in energy consumption after Texas. As of 2018, per capita consumption was the fourth-lowest in the United States partially because of the mild climate and energy efficiency programs.

<span class="mw-page-title-main">Electricity sector in Israel</span>

Since the founding of Israel through the mid-2010s decade, the state-owned utility, Israel Electric Corporation (IEC) had an effective monopoly on power generation in the country. In 2010 the company sold 52,037 GWh of electricity. Until the mid-2010s the country also faced a persistently low operating reserve, which is mostly the result of Israel being an "electricity island". Most countries have the capability of relying on power drawn from producers in adjacent countries in the event of a power shortage. Israel's grid however, is unconnected to those of neighboring countries. This is mostly due to political reasons but also to the considerably less-developed nature of the power systems of Jordan and Egypt, whose systems constantly struggle to meet domestic demand and whose per-capita electric generation is less than one fifth that of Israel's. Nevertheless, while operating reserves in Israel were low, the country possessed sufficient generation and transmission capacity to meet domestic electricity needs and unlike in the countries surrounding it, rolling blackouts have historically been quite rare, even at periods of extreme demand.

References

  1. "2016 Key World Energy Statistics" (PDF). www.iea.org. IEA. Retrieved 1 August 2016.
  2. 1 2 Energy in Sweden, Facts and figures, The Swedish Energy Agency, (in Swedish: Energiläget i siffror), Table: Specific electricity production per inhabitant with breakdown by power source (kWh/person), Source: IEA/OECD 2006 T23 Archived 4 July 2011 at the Wayback Machine , 2007 T25 Archived 4 July 2011 at the Wayback Machine , 2008 T26 Archived 4 July 2011 at the Wayback Machine , 2009 T25 Archived 20 January 2011 at the Wayback Machine and 2010 T49 Archived 16 October 2013 at the Wayback Machine .
  3. Nagata, Kazuaki, "Utilities have monopoly on power", Japan Times , 6 September 2011, p. 3.
  4. 1 2 "Japan electricity markets: structural changes and liberalization". Eurotechnology Japan. 2014. Retrieved 1 August 2016.
  5. "What does liberalization of the electricity market mean?". Agency for Natural Resources and Energy. METI. 2013. Retrieved 1 August 2016.
  6. Stephen Stapczynski, Emi Urabe (28 March 2016). "Japan's Power Market Opening Challenges Entrenched Players: Q&A". Bloomberg. Retrieved 1 August 2016.
  7. "Electricity market shake-up mainly benefiting Tokyo and Kansai". The Japan Times. 7 April 2016. Retrieved 1 August 2016.
  8. 1 2 3 "Japan's electricity deregulation not moving needle yet". Nikkei Asian Review. 4 June 2016. Retrieved 1 August 2016.
  9. "The fraud called electricity retail liberalization". The Japan Times. 27 July 2016. Retrieved 1 August 2016.
  10. 1 2 3 4 "Japan's incompatible power grids". The Japan Times. 19 July 2011. Retrieved 25 April 2018.
  11. 1 2 3 4 5 6 "ABB secures HDVC order for Higashi Shimizu project in Japan". NS Energy Business. 24 April 2019. Archived from the original on 18 September 2021.
  12. 1 2 "Everything you need to know about the Japanese electricity grid". Shulman Advisory. 28 February 2020. Archived from the original on 20 January 2021.
  13. 1 2 "A legacy from the 1800s leaves Tokyo facing blackouts". ITworld. 18 March 2011. Archived from the original on 21 April 2011. Retrieved 28 March 2011.
  14. Gordenker, Alice, "Japan's incompatible power grids," Japan Times , 19 July 2011, p. 9.
  15. "Japan – Analysis overview". EIA. Retrieved 15 April 2015.
  16. "IEA – Report". www.iea.org. Retrieved 31 March 2017.
  17. "IEA – Report". www.iea.org. Retrieved 31 March 2017.
  18. "IEA – Report". www.iea.org. Retrieved 31 March 2017.
  19. "IEA – Report". www.iea.org. Retrieved 31 March 2017.
  20. "IEA – Report". www.iea.org. Retrieved 31 March 2017.
  21. "IEA – Report". www.iea.org. Retrieved 31 March 2017.
  22. "IEA – Report". www.iea.org. Retrieved 31 March 2017.
  23. "IEA – Report". www.iea.org. Retrieved 31 March 2017.
  24. IEA Key World Energy Statistics 2011, 2010, 2009 Archived 7 October 2013 at the Wayback Machine , 2006 Archived 12 October 2009 at the Wayback Machine IEA October, pages electricity 27 gas 13,25 fossil 25 nuclear 17
  25. Bird, Winifred, "Powering Japan's future", Japan Times , 24 July 2011, p. 7.
  26. "Japan is the second largest net importer of fossil fuels in the world - Today in Energy - U.S. Energy Information Administration (EIA)".
  27. Tomoko Yamazaki and Shunichi Ozasa (27 June 2011). "Fukushima Retiree Leads Anti-Nuclear Shareholders at Tepco Annual Meeting". Bloomberg.
  28. Mari Saito (7 May 2011). "Japan anti-nuclear protesters rally after PM call to close plant". Reuters.
  29. Tsuyoshi Inajima and Yuji Okada (28 October 2011). "Nuclear Promotion Dropped in Japan Energy Policy After Fukushima". Bloomberg.
  30. Stephanie Cooke (10 October 2011). "After Fukushima, Does Nuclear Power Have a Future?". New York Times.
  31. Antoni Slodkowski (15 June 2011). "Japan anti-nuclear protesters rally after quake". Reuters.
  32. Hiroko Tabuchi (13 July 2011). "Japan Premier Wants Shift Away From Nuclear Power". New York Times.
  33. Fukushima: Japan promises swift action on nuclear cleanup Prime minister Shinzo Abe makes pledge amid growing concern at scale and complexity of operation The Guardian 2 September 2013
  34. "Nuclear Power in Japan | Japanese Nuclear Energy - World Nuclear Association". Archived from the original on 13 May 2014. Retrieved 4 August 2015.
  35. "Restart of Sendai 1". World Nuclear Association. World Nuclear Association. Retrieved 13 November 2018.
  36. "Japan's Nuclear Power Plants". nippon.com. Retrieved 13 November 2018.
  37. EIA Country Analysis Briefs – Japan | 2012|
  38. Benjamin K. Sovacool | 2011| . Contesting the Future of Nuclear Power: A Critical Global Assessment of Atomic Energy, World Scientific, p. 287.
  39. Justin McCurry (3 May 2011). "Japan's nuclear energy debate: some see spur for a renewable revolution". CSMonitor.
  40. Bird, Winifred, "Distribution gridlock restricts renewables", Japan Times , 24 July 2011, p. 8.
  41. Chisaki Watanabe (26 August 2011). "Japan Spurs Solar, Wind Energy With Subsidies, in Shift From Nuclear Power". Bloomberg.
  42. "Japan Plans Floating Wind Power Plant". Breakbulk. 16 September 2011. Archived from the original on 21 May 2012. Retrieved 12 October 2011.
  43. Failure seven years after the world's first floating wind turbine "The Mainichi: Failure of world's 1st offshore floating wind farm". The Mainichi. 6 March 2021.
  44. Yang, Chi-Jen. "Pumped Hydroelectric Storage" (PDF). duke.edu. Archived from the original (PDF) on 10 October 2015. Retrieved 25 November 2015.