Systematic collection of information about a forested area for assessment or analysis
Forest inventory is the systematic collection of data and forest information for assessment or analysis[1]. An estimate of the value and possible uses of timber is an important part of the broader information required to sustain ecosystems.[2][3] When taking forest inventory the following are important things to measure and note: species, diameter at breast height (DBH), height, site quality, age, and defects. From the data collected one can calculate the number of trees per acre, the basal area, the volume of trees in an area, and the value of the timber. Inventories can be done for other reasons than just calculating the value. A forest can be cruised to visually assess timber and determine potential fire hazards and the risk of fire.[4] The results of this type of inventory can be used in preventive actions and also awareness. Wildlife surveys can be undertaken in conjunction with timber inventory to determine the number and type of wildlife within a forest. The aim of the statistical forest inventory is to provide comprehensive information about the state and dynamics of forests for strategic and management planning. Merely looking at the forest for assessment is called taxation.
Surveying and taking inventory of trees originated in Europe in the late 18th century out of a fear that wood (the main source of fuel) would run out. The first information was organized into maps used to plan out usage. In the early 19th century forest harvesters estimated the volume and dispersal of trees within smaller forests with their eyes. More diverse and larger forests were divided into smaller sections of similar type trees that were individually estimated by visual inspection. These estimates were related together to figure out the entire forest's available resources. As the 19th century progressed so did the measurement techniques. New relationships between diameter, height, and volume were discovered and exploited. These newfound relationships allowed for a more accurate assessment of wood types and yields of much larger forests. By 1891, these surveys were conducted through sample-based methods involving statistical averages and more sophisticated measuring devices were implemented. In the 20th century, the statistical method of sampling had become well established and commonly used. Further developments, such as unequal probability sampling, arose. As the 20th century progressed, an understanding of co-efficients of error became clearer and the new technology of computers combined with the availability of aerial as well as satellite photography, further refined the process. Laser Scanning both terrestrially and aerially are now used alongside more manual methods. As a result, sampling accuracy and assessment values became more accurate and allowed for modern practices to arise.
A forest inventory does not only record the trees height, DBH and number for tree yield calculations. It also records the conditions of the forest, which might include (for example) geology, site conditions, tree health and other forest factors.
A timber cruise is a sample measurement of a stand used to estimate the amount of standing timber that the forest contains. These measurements are collected at sample locations called plots, quadrants, or strips. Each of these individual sample areas is one observation in a series of observations called a sample. These sample areas are generally laid out in some random fashion usually in the form of a line plot survey. Depending on the size of the plot and the number of plots measured, the data gathered from these plots can then be manipulated to achieve varying levels of certainty for an estimate that can be applied to the entire timber stand. This estimate of stand conditions, species composition, volume and other measured attributes of a forest system can then be used for various purposes. For example, in British Columbia the sale of Crown timber is a business proposition and both the buyer and the Ministry of Forests and Range (seller) must know the quantity and the quality of timber being sold. Generally a timber cruise includes measurements or estimates of timber volume by forest product sort (and sometimes grade), log defect, and log lengths, whether the estimates are made in the field or using computer software.
Plot selection
Plots are samples of the forest being inventoried and so are selected according to what is looked for.
Simple random sampling: A computer or calculator random number generator is used to assign plots to be sampled. Here random means an equal chance of any plot being selected out of all of the plots available. It does not mean haphazard. Often it is modified to avoid sampling roads, ensure coverage of unsampled areas and for logistics of actually getting to the plots.
Systematic sampling: Commonly this is done by a random point and then laying a grid over a map of the area to be sampled. This grid will have preassigned plot areas to be sampled. It means more efficient logistics and removes some of the human bias that may be there with simple random sampling.
Systematic stratified sampling: The most common type[citation needed] of inventory is one that uses a stratified random sampling technique. In includes first grouping by age classes or soil characteristics or slope elevation. And then plots are chosen from each grouping by another sampling technique. It requires some knowledge of the land first and also trust that the groupings have been done properly. In forestry it may be done to separate plantation areas from mixed forest for example and reduce the amount of sampling time needed.
Systematic clustered sampling: When it is not possible to make strata for stratified sampling, there may be some knowledge about the forest where it can be said that small groupings are possible. These small groupings of plots if they are near to each other form a cluster. These clusters are then randomly sampled with the belief that they are representing the actual mix of the forest. As they are close to each other there is less walking needed and so it is more efficient.
Types of sample plots
In a fixed radius plot, the forester finds the center of a plot and every tree within a certain fixed distance away from that point is measured. Sample measurements are taken so that they are a fraction of the entire timber stand. This means that the numbers are all proportional to the actual stand values and that by multiplying by the correct corresponding value you can obtain the actual tract values. These plots are taken randomly so that each sample point has an equal probability of being included in the random sample. Often, circular plots are used because it only requires measuring the radius. Commonly, tenth acre plots are used (37.2ft radius).
A variable size plot is more dependent of the size of the trees. The tract is measured on a series of points and the trees are tallied for being in or out depending on their size and location relevant to the plot center. Usually an angle gauge, wedge prism, Tunagmetor, or Relascope are used to gather data for this type of plot. This allows for a very quick estimate of the volume and species of a given tract.
Transects are arbitrarily determined lines (to prevent sampling bias) through a stand employed as a linear form of sample plot. They are sometimes referred to as "strip lines."
Timber metrics
The amount of standing timber that a forest contains is determined from:
Age class (Size class). This is a misnomer as in German it is Wuchsklass (Growth class) and properly should be the size of the tree (Size class), which may be limited by shade over it and not necessarily the biological and thus physiological age of the tree. This distinction is important if tree growth over time is expected by an owner or forester to produce timber, as a small old tree will grow differently from a small young tree. Commonly these age classes are split into: Seedling, Sapling, Pole, Mature Tree (subdivided into Weak wood, Middle wood and Strong wood stages), Old / Senescent Tree. Sometimes it is called size class or a cohort. There are differences between countries and forests.
Basal area – defines the area of a given section of land that is occupied by the cross-section of tree trunks and stems at their base
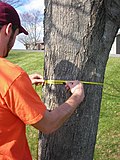
Diameter at breast height (DBH) – measurement of a tree's girth standardized with different countries having different standards they are often at 1.3 meters (about 4.5 feet) above the ground
Form factor – the shape of the tree, based on recorded trees and commonly then given for calculating tree volumes for a given species. It is usually related to DBH or age class. It is distinct from taper.[5] So it can be conical or paraboloid for example.
Girard form class – an expression of tree taper calculated as the ratio of diameter inside the bark at 16 feet above ground to that outside bark at DBH, primary expression of tree form used in the United States
Site index – a species specific measure of site productivity and management options, reported as the height of dominant and co-dominant trees (site trees)in a stand at a base age such as 25, 50 and 100 years
Tree taper – the degree to which a tree's stem or bole decreases in diameter as a function of height above ground. So it can be sharp or gradual.
Logging trucks getting weighed at scaling station.
Scaling
The gross and net volume of timber can also be determined through the process of scaling. According to the Forest Management Service Center of the USDA Forest Service, scaling is used to determine the volume of logs after the harvest. The volume is estimated for a specific number of logs, such as a log truck load. A predetermined monetary rate is set for timber product type or tree species which is then multiplied by the volume. Volume is determined based on set rules for accounting for defect, and measuring length and diameter of the harvested logs. Another type of scaling, weight scaling, allows the volume of the harvested product to be determined based on the weight of the total product, which differs based on tree species. One hypothesized benefit of scaling rather than timber cruising to determine timber volume is the potential for increasing volume accuracy and decreasing staffing requirements, as the price paid for product is based on volume cut rather than volume appraised, reducing the need for timber cruises to estimate volume. This was demonstrated in a 2011 Minnesota Department of Natural ResourcesReport to the House and Senate Natural Resources Policy and Finance Committees and Divisions.
Volume estimation
Stocking – a quantitative measure of the area occupied by trees relative to an optimum or desired level of density, which will vary according to management purpose
Stand Density Index – a measure of the stocking of a stand of trees based on the number of trees per unit area and DBH of the tree of average basal area, based on historical records and is particular to site type and species
Volume table – a chart based on volume equations that uses correlations between certain aspects of a tree to estimate the standing volume
Volume can be calculated from the metrics recorded in a plot sample. For example, if a tree was measured to be 20m tall and with a DBH of 19cm using previous measured tree data a volume could be approximated according to species. Such a table has been constructed by Josef Pollanschütz[6] in Austria.
Volume of tree = BA X h x f pollanschutz
So f pollanschütz would be derived from the table and is properly called the Form Factor.
To scale this up to a hectare level the result would have to be multiplied by the number of trees of that size. This is called the blow up factor.
Tools used in inventory
Biltmore stick – utilizes ocular trigonometry to quickly measure diameter and height. Figure demonstrating the ocular trigonometric principles behind the Biltmore stick.
Diameter tape – cloth or metal tape that is wrapped around the bole, scaled to diameter.
Tree caliper – two prongs connected to a measuring tape or stick are placed around the most average part of the bole to determine diameter.
Relascope – multiple-use tool that is able to find tree height, basal area, and tree diameter anywhere along the bole.
Clinometer – common tool used to measure changes in elevation and tree height.
Cruising rod – used to estimate the number of pieces of lumber yielded by a given piece of timber.
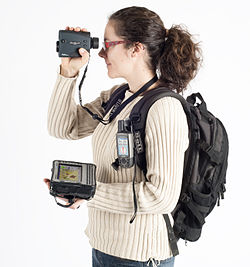
LASER Scanner used with computer software to calculate the metrics from the collected data by use of Lidar.[7]
Wedge prism – a small glass wedge that refracts light to create visible offsets in order to be able to choose which trees at a sampling point should be included in the sample.
Data collector – an electronic device used to quickly enter sample data, geo-locate the data, and, in more modern times, to also access reference, web and historic materials while timber cruising.[8]
Increment borer – a device used to retrieve a cylindrical sample of wood material orthogonally from the stem while doing as little damage as possible to the remaining tissues.[9]
In 2014, the Food and Agriculture Organization of the United Nations and partners, with the support of the Government of Finland, launched Open ForisArchived 2022-10-06 at the Wayback Machine – a set of open-source software tools that assist countries in gathering, producing and disseminating reliable information on the state of forest resources. The tools support the entire inventory lifecycle, from needs assessment, design, planning, field data collection and management, estimation analysis, and dissemination. Remote sensing image processing tools are included, as well as tools for international reporting for REDD+ MRV and FAO's Global Forest Resource AssessmentsArchived 2015-08-14 at the Wayback Machine .
↑ Ribeiro, Ricardo da Silva; Souza, Hallefy Junio de; Munari, Lúcia Chamlian; Junior, Claudio Roberto Anholetto; Santos, Alcâmenes Heródoto Honorato dos; Filho, Hugo Crisostomo de Castro; Alencar, Tiago Machado de; Júnior, Jair Eustáquio Quintino de Faria; Santiago, Daniel Silva; Bentes, Lis Vale; Faria, Vítor Marques de; Pereira, Alex de Almeida; Lira, David Fagner de Souza e; Teixeira, Michella Del Rei; Trindade, Ana Laura Cerqueira (2024-10-08). "Advances in Brazil's National Forest Inventory". Research Ideas and Outcomes. 10: e138413. doi:10.3897/rio.10.e138413. ISSN2367-7163.{{cite journal}}: CS1 maint: article number as page number (link) CS1 maint: unflagged free DOI (link)
This page is based on this Wikipedia article Text is available under the CC BY-SA 4.0 license; additional terms may apply. Images, videos and audio are available under their respective licenses.