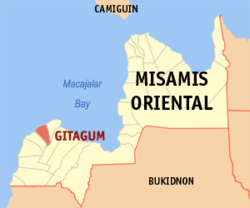
Gitagum, officially the Municipality of Gitagum (Cebuano: Lungsod sa Gitagum; Tagalog: Bayan ng Gitagum), is a municipality in the province of Misamis Oriental, Philippines. The municipality is bounded on the north by Mindanao Sea, on the east by the Municipality of Laguindingan, on the south by the Municipality of Alubijid and on the west the Municipality of Libertad. It is approximately 40km away from Cagayan de Oro.[5] According to the 2020 census, it has a population of 17,920 people.[6]
The municipality of Gitagum stretches along the shoreline of Mindanao Sea having an approximate length of 6.2km. It has a total land area of 4,340 hectares or 43.40 square kilometers which is only 1.18% of the total land area of the province of Misamis Oriental. There are eleven barangays of which four are urban areas due to their strategic location along the national highway and along the Iligan Bay. Light commercial and industrial establishments are found in these barangays. Built up areas for urban uses comprise only 2. 5% of the total land area of Gitagum, which is utilized for residential uses and within the vicinity of the public market, business establishment, churches, school, municipal gymnasium, plaza and other government building of the municipality. The coastal barangays of Burnay and Pangayawan are vegetated with mangrove which remains protected.
The barangays along the coast are traversed by the national highway, while the interior barangays are accessible by the provincial and barangays roads which serve as farm to market roads.
History
Cultural development and etymology
During the Spanish era, the inhabitants of the area were all non-Christians natives, possibly Higaonon people. Particularly their names were A Lot, Lahoylahoy, and Laus. Gitagum at the time was a thick forest, there wild pigs and wild chickens. Most of the people were illiterate. Gitagum was a sitio of Cagayan Misamis (now Cagayan de Oro City). Some people from Tagnipa (now El Salvador), Alubijid and other neighboring places as well as settlers from Luzon and Visayas in various periods have applied the place for homestead and then settled the place. The people who have first settled the place were Leodegario Patenio, Rosales Fabricante, Luis Balacuit, Juan Buray, Juan Taroy and Damaso Paculba. The non-Christian natives moved to the mountains because they do not like to get nearer with the Christians settlers. However, there are still few natives who were friendly to the settlers. Leodegario Patenio has an idea that Gitagum must be a barrio. One time, one of the natives got sick and they could not do anything to help him. They invited the quack doctor in order that their patient must be treated. The doctor used medicinal leaves called tagum-tagum for treatment purposes. The patient recovered, and tagum-tagum could be easily found in the place and it was very common for treatment and that from very moment, the place was called “Gitagum”.
Political development
In the year 1907, the Municipal President of Cagayan de Misamis has made Gitagum into a barrio and be a part of said municipality. Leodegario Patenio was appointed as Barrio Lieutenant. The barrio lieutenant called a meeting of all the Christian settlers from Luzon, Visayas and other neighboring areas. The settlers have built school building and all others. During their meeting, they discussed in connection of their barrio fiesta. They have agreed that their patron must be Santo Niño and to be held in every third Sunday of January in every year. When Alubijid became a municipality, Gitagum was part of that municipality.
In 1961, the people of Gitagum formed a barrio meeting. The purpose of the said meeting was to apply for a municipality. Two prominent persons named Benito Velasco and Custodio T. Damasing were the one who made the required papers and personally submitted to Manila for favorable action and consideration. President Carlos P. Garcia has issued an Executive Order No. 435, dated June 15, 1961, stating herein, that Gitagum must be a regular municipality. President Garcia has appointed the town officials for Gitagum, with Velasco as its municipal mayor, as well as Valeriano Dumagan as vice mayor. Lino Maagad, Teotimo Magdale, Bernardo Yamaro, Antonio Palasol, Leon Nob and Carlos Micutuan were appointed municipal councilors. Custodio T, Damasing was appointed as Municipal Secretary. Gitagum was inaugurated on July 17, 1961.
List of town executives
1961–present
Period
Mayor
Vice mayor
1961-1963
Santiago L. Velasco
Valeriano Dumgan
1964-1971
Santiago L. Velasco
Custodio T. Damasing
1972-1980
Santiago L. Velasco
Claudio L. Buray
1980-1986
Santiago L. Velasco
Atty. Damaso P. Tubelleja
1986-1988
Santiago L. Velasco
Emeliano B. Taroy
1989-1992
Santiago L. Velasco
Rodrigo O. Mugot Sr.
1992-1995
Romeo L. Briones (OIC for 3 months)
Rodrigo O. Mugot Sr.
1992-1995
Tiburcio P. Ajonan
Rodrigo O. Mugot Sr.
1995-1998
Tiburcio P. Ajonan
Edito S. Daumar
Roberto O. Buray (March 30, 1998 to April 27, 1998
Danilo O. Quilab (May 18, 1998 to June 30, 1998)
1998-2001
Tiburcio P. Ajonan
Emmanuel S. Mugot
2001-2007
Mary Jean M. Ajonan
Emmanuel S. Mugot
2007-2013
Rodolfo O. Buray
Danilo O. Quilab
2013-2016
Rodolfo O. Buray
Shirley D. Taroy
2016-2019
Emmanuel S. Mugot
Rudy O. Damasing
Geography
Gitagum is located on the island of Mindanao, in Region X, and it falls under the second district of Misamis Oriental. It lies along the route of the Iligan-Cagayan de Oro-Butuan highway. It is the fifth municipality west of Cagayan de Oro, the capital of Misamis Oriental. Gitagum is located within the geographic coordinates 8⁰32’00” north latitude and 124⁰25’30” east longitude. It is bounded on the north by Iligan Bay; on the east by the Municipality of Laguindingan; on the west by the Municipality of Libertad, and on the south by the Municipality of Alubijid.
Gitagum has a total land area of 4,340 hectares or 43.4 square kilometers apportioned in its eleven barangays. This covers only 1.18% of the province’s total land area of 367,360 hectares. G.Pelaez, a rural barangay, has the biggest land area covering 34.97% of the total land area, followed by Quezon comprising 10.23%. Pangayawan and Burnay, both urbanizing barangays have the smallest land areas sharing only 5.43%.
Gitagum is shaped like a native fan. Its broad limestone plain within 0 – 100 meters elevation stretches from Iligan Bay towards the easier part, narrowing down to rise 100–300 meters above the sea level forming low and high relief shale/sandstone hills. Ultra basic high relief hills at the southwestern most part of the municipality serves as the fan’s handle.
Topography and Slope
Gitagum is shaped like a native fan. Its broad limestone plain within 0–100 meters elevation stretches from Iligan Bay towards the eastern part, narrowing down to rise 100–300 meters above sea level forming low and high relief shale/sandstone hills. Ultra-basic high relief hills at the southwestern most part of the municipality serves as the fan’s handle.
Based on the slope profile of the municipality, the slope gradually becomes very steep in barangay G. Pelaez, with a total area of 664.43 hectares. On the other hand, most of the rural Barangay are steep or gradually flat.
The slope of 0-18% is flatland that about 2,156.85 hectares of the municipality is considered to nearly level. It determines the suitability for human settlement and better agricultural soils compared to steeper lands and considered irrigable, highly suitable for urban and industrial. The slope of 18- 30% comprises about 1,394.31 hectares is rolling to moderately steep is another potential for seasonal or permanent agricultural activities. Slopes of 30-50% with an area of 124.41 hectares are suitable for forest trees, while those with greater 50% slopes and above should be maintained for protection forest.
Category
Area (has.)
%
0-3%
522.13
12.03
3-8%
1,116.64
25.73
8-18%
518.08
11.94
18-30%
1,394.31
32.13
30-50%
124.41
2.86
>50%
664.43
15.31
Total
4,340
100
Elevation
Basing on the presented table below, a considerable area of 3,588.45 hectares (0-200 masl) is still feasible for cultivation of agriculture crops and establishment of forest plantations which shall be subject for future utilization. However, areas above 400 masl which the highest elevation found in barangay G. Pelaez shall be developed into tree plantation for protection purposes and shall not be subject for harvesting/utilization
Category (masl)
Area (has.)
%
0-100
1,854.59
42.73
100-200
1,733.86
39.95
200-300
348.06
8.02
300-400
392.60
9.05
400 above
10.89
0.25
Total
4,340
100
Location Map Gitagum
Barangays
Gitagum is politically subdivided into 11 barangays. Each barangay consists of puroks while some have sitios.
With a total land area of 4,340 hectares or 43.40 square kilometers. Table 1 shows the urban and rural barangays of LGU Gitagum with corresponding land areas with 1,454.6 hectares for urban barangay and the rural barangays of 2,885.4 hectares. Among the urban barangays, Quezon has the highest land area of 444 hectares or 10.23% of the municipal total area. Considered as the rural barangays of G.Pelaez, has the largest land area that covers 34.97% of the overall land area or with an equivalent to 1,517.7 hectares.
Climate
The climate of Gitagum falls under classification Type III. Under this classification seasons are not very pronounced with relatively dry climate from November to April and wet the rest of the year. Heavy rains usually occurs in the month of January, February, September and December. The municipality receives 1,000-2,000 millimeter of rain per annual average and 124.4-168.i millimeters annual monthly average.
The climate of the Philippines is tropical and maritime. It is characterized by relatively high temperature, high humidity and abundant rainfall. Base on the distribution of rainfall, four climate types are recognized. Based on the Corona Climate Classification (Geohazard Report of Collantes, M.G.B., Lucero E.S. and Asis, J.C.V.), the municipality of Gitagum falls under Type III which means the seasons are not very pronounced, dry from November to April and wet during the rest of the year.
Heavy rains usually occur in the month of January, February, September and December. The municipality receives 1,000-2,000 millimeter of rain per annual average and 124.4-168.1 millimeters annual monthly average.
Table 3. Annual rainfall data of Gitagum, Misamis Oriental from CY 2007-2015.
Month
2007
2008
2009
2010
2011
2012
2013
2014
2015
January
86
184
457
153.2
181.3
212.3
211.1
504.6
189.7
February
47
900
207.1
0.4
166.3
102.16
91.3
39.9
6.8
March
3
83
1
23.3
130.8
48.22
61.2
84
3.4
April
24
166
155
16.4
34.9
79.26
89.3
89.3
66.4
May
248
171
233.7
153.4
118.3
184.88
201.1
201.1
40.4
June
213
228
189.9
155.3
231.6
203.56
268.2
305.8
179.8
July
233
241
308.1
353.2
182.5
263.56
268
305.8
111.9
August
182
193
198.6
212.2
226.8
190.52
211.4
409.9
47.2
September
210
279
209.7
264.8
232.2
239.14
162
232.7
192.3
October
161
253
107.1
297.7
194.1
202.58
173.6
76.7
112.7
November
99
101
329.3
62.8
115.6
141.54
103.5
88.9
37.9
December
98
143
36.2
131.8
333.6
148.54
13.7
137.1
81.3
Source: PAGASA-El Salvador (2016)
the wettest month are from January, August, July and September for calendar year 2014 with monthly rainfall varying from 504.6, 409.9 305.8 and 232.7 millimeter (mm). On the other hand, the driest period runs from March and February having monthly rainfall ranging from 3.4mm and 6.8mm for the year 2015.
Gitagum is not within the typhoon route; hence it has always been spared from destruction
The Department of Agriculture – Bureau of Soil and Water Management (DA-BSWM) has identified only two types of soils in the Municipality: the Bolinao clay and the Lourdes clay loam. These types of soil provide good anchorage and root penetration for a variety of crops. Bolinao clay is very abundant and less rugged, hill mountain while Lourdes clay loam is in the hinterland portion of the municipality.
The organic matter of the phosphorus level and the potassium content together with the medium texture was not specifically measured. The soils of Gitagum are generally suitable for the cultivation of annual crops and perennial trees and vines. Only a minor portion, six percent are suitable for plantation forest and are scattered in the sloping and high relief areas of barangay Quezon, Kilangit and Burnay. Based on existing used, only the land in Quezon which are planted to trees are over utilized. On the other hand, lands suitable for annual crops such as trees and vines are underutilized. Therefore, these areas are considered for further development.
The geological makeup of the municipality is classified into three times scales. The most dominant which covers more or less 60% is the Pliocene-Pleistocene scale with a parent material of Coraline limestone and mineral composition of calcite. These are found in barangays Poblacion, Burnay, Pangayawan, Matangad and Quezon.
The second formation covering 35% belongs to the upper Miocene Pliocene composed of quartz. Iron oxide and clay minerals are set up in the upper portions of the municipality within the barangays of Cogon, Ulab, G. Pelaez and parts of Talao, C.P. Garcia, Kilangit ad Quezon. A negligible portion, 5% along the southwestern boundary, is rocks belonging to the upper Cretaceous- Paleocene scale, Mineral compositions in these areas are talc, chloride, olivine, amphibole, pyroxene and biocide.
Sub-watersheds and drainage
Watershed represents a unique ecosystem that can provide various goods and services. There are four Sub-watersheds in the municipality, namely to wit;
Gitagum Sub-watershed with an area of 838.91 hectares extending from barangay Poblacion, G. Pelaez and Cogon.
Pangayawan Sub-watershed with an area of 1,747.95 hectares extending from barangay Talao, Burnay, G. Pelaez, Cogon, Quezon, Pangayawan, C.P. Garcia, Kilangit and Ulab.
Anibungan Sub-watershed with an area of 632.69 hectares extending from barangay Matangad, Pangayawan, C.P. Gracia, Kilangit and Ulab.
Taglaklak Sub-watershed with an area of 790.86 extending from barangay G. Pealeaz, Quezon, Matangad, Kilangit and Ulab.
The abovementioned sub-watershed contributes water supply for domestic and agricultural use and were drain towards the Macajalar bay.
Name of Sub-watershed
Area (has)
Percentage (%)
River/Creek
(km)
Gitagum
838.91
20.92
8.8
Pangayawan
1747.95
43.59
18.2
Anibungan
632.69
15.75
7.5
Taglaklak
790.86
19.72
6.2
Total
4010.41
100
40.7
Source: NAMRIA Map & GIS generated data
Demographics
The 2020 PSA Census of Population in Gitagum indicates a total of 17,920 persons,[8] with a density of 410 inhabitants per square kilometre or 1,100 inhabitants per square mile. This represents 2 percent of the total population of Misamis Oriental Province or 0.36 percent of the overall population of Northern Mindanao. Represents an increase of 1,547 persons over the total population of 16,373 in 2015. The 2020 data translated to an average growth of 1.82% from the period 2015 to 2020, which is higher than the national, regional and provincial growth rate of 1.63%, 1.46% and 1.57%, respectively.
Historical population growth within the municipality of Gitagum, Misamis Oriental (from CY 1970-2015).
Based on the municipality’s population land area of 4,010.41 hectares, the population density of Gitagum is 4 persons per hectare or 377 inhabitants per square meter or 977 inhabitants per square mile. The most densely populated barangay is Barangay Burnay with a population density of 14 persons per hectare. It is followed by Barangay Pangayawan and Barangay Poblacion. Barangay G. Pelaez has the lowest population density of about 1 person per hectare.
Comparative barangay population density within the municipality of Gitagum, Misamis Oriental
Agricultural lands cover a major portion of the total land area with 3,790 hectares or 87.32% of the municipality’s total land area. Out of the total land area devoted to agriculture, only 2,634.50 hectares are actually cultivated.
The dominant crop grown is coconut. The actual area planted with corn is 1062.91 hectares while tobacco is about 494.27 hectares. About 75% of the area is intercropped with coconut trees.
In the peripheries, surrounding the residential, commercial, and industrial areas are the agricultural lands located outside the barangay Poblacion built–up area. This accounts for the greater portions of 918.016 hectares sharing 91.14 percent. Greater portions of the total agricultural land of the entire barangay Poblacion are found in its Southern, Eastern, and Western portions.
Agricultural lands cover a major portion of the total land area with 3,790 hectares or 87.32% of the municipality’s total land area. Out of the total land area devoted to agriculture, only 2,634.50 hectares are actually cultivated. The dominant crop grown is coconut. Actual area planted with corn is 1062.91 hectares while tobacco is about 494.27 hectares. About 75% of the area is intercropped with coconut trees.
Root crops are also planted as food substitute and as additional source of income. Many land owners with bigger land areas plant permanent crops and fruit trees such as mango and senequilas to augment their income.
In 2010, the requirement per capita of cereals, fruits, vegetables and root crops was 1,757.90, 1,233.91, 881.37 and 975.38 metric tons, respectively. It indicates that a deficit on all commodities have been experience due to irreversible effect of climate change, lack of support in terms of farm inputs and infertility of agricultural lands. The table below show the 2011 agricultural crops by area planted and production.
Summary of agricultural crops by area and production within the municipality of Gitagum, Misamis Oriental.
No.
Crops
Area (has.)
Production (MT)
1.
Coconut
1,334.24
6.537.78
2.
Corn
1.064.91
2,928.51
3.
Tobacco
139.47
108.79
4.
Mango
64.00
768.00
5.
Banana
40.00
400.00
6.
Peanut
14.75
40.57
7.
Senequelas
87.75
8,77500
8.
Squash
15.00
300.00
9.
Mongo
45.00
56.25
10.
Vegetable Assorted
12.00
69.60
Total
2,778.12
18,984.50
Source: MAO-Gitagum, Misamis Oriental
For a four year period of production, it can be observed that there was a significant decrease in production of all food items. Rice farming has no area suitable for lowland rice production. The table below illustrates the four year production by selected food items.
Comparative crop production within the municipality of Gitagum, Misamis Oriental for the CY 2008-2011.
Selected food item
Production year (metric ton)
2008
2009
2010
2011
Corn
2,901.25
2,915.00
2,906.75
3,150.00
Banana
300.00
400.00
450.00
450.00
Vegetables
50.00
62.00
75.00
75.00
Cassava
500.00
600.00
200.00
100.00
Mango
360.00
600.00
600.00
624.00
Peanut
13.75
13.75
13.75
13.75
Source: MAO-Gitagum, Misamis Oriental
It is expected that based on the prescribed standard the food requirement per capita will generate an average increase of less than one (1%) percent annually. This is attributed mainly by the slow growth rate of the municipality’s population. The table below projects the food requirement per capita per annum in metric tons.
Table 11. Projected food requirement per capita per annum for the CY 2013-22 within the municipality of Gitagum, Misamis Oriental.
Food items
Requirements (in kg per capita)
2013
2015
2020
2022
Cereal
109.20
1,803.65
1,834.80
1,915.07
1,948.15
Sugar
30.66
506.41
515.16
537.69
546.98
Root crops/tubers
60.59
1,000.76
1,018.05
1,062,58
1,080.94
Fruits
76.65
1,266.02
1,287.89
1,344.23
1,367,45
Meat
33.13
547.21
556.66
581.01
591.05
Milk & milk products
24.42
403.34
410.31
428.26
435.66
Eggs
3.98
65.74
66.87
69.80
71.00
Fish
30.66
506.41
515.16
537.69
546.98
Source: MAO-Gitagum, Misamis Oriental
Source of agricultural inputs comes mainly from Cagayan de Oro. However, some purchase their farm inputs from the Laguindingan and Libertad, Misamis Oriental. There are also poultries in the municipality mainly for ducks and chickens. Backyard and egg production are common projects where residents usually invest as alternative livelihood.
Table 12. Top five commodities within the municipality of Gitagum, Misamis Oriental.
Commodities
Agricultural land area of production (Ha.)
Gross production
Production cost per hectare/year
Farm gate price
Per capita consumption
Sufficiency level (%)
Constrains to productivity
Coconut
2,092
2,510 MT
₱14,000
₱32
Senile trees
Unstable prices
Competition with palm oil
Tobacco
188..05
171.13 MT
₱108,970
₱300
Pest and disease
Limited financial assistance
Weather conditions
Marketing
Limited extension workers for financial assistance
Corn
546
1,911 MT
₱30,000
₱12
20.9 KP
10.15
High cost of production inputs
Lack of capitalization
Pest infections
Adverse climate conditions
Poultry
227,600 birds/cycle
412.5 MT
₱65,000 per cycle
₱75/kilo
7.19kg
2.19
Diseases
High cost of inputs
Adverse weather conditions
Fisheries
Municipal waters; 15km from shoreline
371.52 MT motorized
₱48,000
₱80/kilo
2.88kg
1
Degraded fishing grounds
Encroachment of commercial fishing vessel
Illegal fishing
170.88 MT non-motorized
₱19,200
Source: MAO-Gitagum, Misamis Oriental
Tourism
Mt. Anggas, Barangay Gregorio Pelaez, Gitagum
Mt. Anggas is the latest must-trek site of Northern Mindanao. It is a grass land mountain range that covers four municipalities of Western Misamis Oriental. It is full of minerals and rocks from top to bottom. Big trees with deep root system cannot grow and survive, hence, a grassland. Its unique vegetation, topography and 360 degree panoramic views from start to finish is something to fill your phone with Facebook and Instagram worthy photos. Best approach is located at Sikiton, G. Pelaez, Gitagum, Misamis Oriental. Mt. Anggas is just 25 minutes ride from Laguindingan Airport – 1 hour and fifteen minutes from the city of Cagayan de Oro.
This page is based on this Wikipedia article Text is available under the CC BY-SA 4.0 license; additional terms may apply. Images, videos and audio are available under their respective licenses.