Related Research Articles
Biostatistics are the development and application of statistical methods to a wide range of topics in biology. It encompasses the design of biological experiments, the collection and analysis of data from those experiments and the interpretation of the results.

A chart is a graphical representation of data, in which "the data is represented by symbols, such as bars in a bar chart, lines in a line chart, or slices in a pie chart". A chart can represent tabular numeric data, functions or some kinds of qualitative structure and provides different info.
Understanding is a psychological process related to an abstract or physical object, such as a person, situation, or message whereby one is able to think about it and use concepts to deal adequately with that object. Understanding is a relation between the knower and an object of understanding. Understanding implies abilities and dispositions with respect to an object of knowledge that are sufficient to support intelligent behaviour.

Numeracy is the ability to reason and to apply simple numerical concepts. Basic numeracy skills consist of comprehending fundamental arithmetics like addition, subtraction, multiplication, and division. For example, if one can understand simple mathematical equations such as 2 + 2 = 4, then one would be considered possessing at least basic numeric knowledge. Substantial aspects of numeracy also include number sense, operation sense, computation, measurement, geometry, probability and statistics. A numerically literate person can manage and respond to the mathematical demands of life.

Infographics are graphic visual representations of information, data, or knowledge intended to present information quickly and clearly. They can improve cognition by utilizing graphics to enhance the human visual system's ability to see patterns and trends. Similar pursuits are information visualization, data visualization, statistical graphics, information design, or information architecture. Infographics have evolved in recent years to be for mass communication, and thus are designed with fewer assumptions about the readers' knowledge base than other types of visualizations. Isotypes are an early example of infographics conveying information quickly and easily to the masses.
Reading comprehension is the ability to process text, understand its meaning, and to integrate with what the reader already knows. Fundamental skills required in efficient reading comprehension are knowing meaning of words, ability to understand meaning of a word from discourse context, ability to follow organization of passage and to identify antecedents and references in it, ability to draw inferences from a passage about its contents, ability to identify the main thought of a passage, ability to answer questions answered in a passage, ability to recognize the literary devices or propositional structures used in a passage and determine its tone, to understand the situational mood conveyed for assertions, questioning, commanding, refraining etc. and finally ability to determine writer's purpose, intent and point of view, and draw inferences about the writer (discourse-semantics).
Graphicacy is defined as the ability to understand and present information in the form of sketches, photographs, diagrams, maps, plans, charts, graphs and other non-textual formats. The word graphicacy was coined by Balchin and Coleman as representation of the visuo-spatial abilities, they gave their reasons as follows "In the choice of a word to denote the educated counterpart of visual-spatial ability one must first ask the question what exactly does this form of communication involve. It is fundamentally the communication of spatial information that cannot be conveyed adequately by verbal or numerical means,e.g. the plan of a town, the pattern of a drainage network or a picture of a distant place - in other words the whole field of the graphic arts and much of geography cartography, computer-graphics, photography, itself. All of these words contain the syllable "graph" which seemed a logical stem for "graphicacy" which was completed by analogy with literacy, numeracy and articulacy.
Situational awareness or situation awareness (SA) is the perception of environmental elements and events with respect to time or space, the comprehension of their meaning, and the projection of their future status.
Statistical literacy is the ability to understand and reason with statistics and data. The abilities to understand and reason with data, or arguments that use data, are necessary for citizens to understand material presented in publications such as newspapers, television, and the Internet. However, scientists also need to develop statistical literacy so that they can both produce rigorous and reproducible research and consume it. Numeracy is an element of being statistically literate and in some models of statistical literacy, or for some populations, it is a prerequisite skill. Being statistically literate is sometimes taken to include having the abilities to both critically evaluate statistical material and appreciate the relevance of statistically-based approaches to all aspects of life in general or to the evaluating, design, and/or production of scientific work.
Data visualization is the graphic representation of data. It involves producing images that communicate relationships among the represented data to viewers of the images. This communication is achieved through the use of a systematic mapping between graphic marks and data values in the creation of the visualization. This mapping establishes how data values will be represented visually, determining how and to what extent a property of a graphic mark, such as size or color, will change to reflect changes in the value of a datum.

Health literacy is the ability to obtain, read, understand, and use healthcare information in order to make appropriate health decisions and follow instructions for treatment. There are multiple definitions of health literacy, in part, because health literacy involves both the context in which health literacy demands are made and the skills that people bring to that situation.
The professional skills tests, also known as the QTS Skills Tests, are computer-based tests in literacy and numeracy which must be passed by anyone attempting to gain qualified teacher status (QTS) in England. The tests must be passed before enrolling onto an initial teacher training course, such as the Postgraduate Certificate in Education (PGCE), or the Bachelor of Education (BEd).
Overall literacy in the United States has increased through increased educational accessibility and higher vocational standards. The definition of literacy has changed greatly. The ability to read a simple sentence suffices as literacy in many nations, and was the previous standard for the U.S. The country's current definition of literacy is the ability to use printed and written information to function in society, to achieve one's goals, and to develop one's knowledge and potential. The United States Department of Education assesses literacy in the general population through its National Assessment of Adult Literacy. The NAAL survey defines three types of literacy:
Visual literacy in education develops a student's visual literacy – their ability to comprehend, make meaning of, and communicate through visual means, usually in the form of images or multimedia.
Self-report sexual risk behaviors are a cornerstone of reproductive health–related research, particularly when related to assessing risk-related outcomes such as pregnancy or acquisition of sexually transmitted diseases (STDs) such as HIV. Despite their frequency of use, the utility of self-report measures to provide an accurate account of actual behavior are questioned, and methods of enhancing their accuracy should be a critical focus when administering such measures. Self-reported assessments of sexual behavior are prone to a number of measurement concerns which may affect the reliability and validity of a measure, ranging from a participant's literacy level and comprehension of behavioral terminology to recall biases and self-presentation.
In statistics, a misleading graph, also known as a distorted graph, is a graph that misrepresents data, constituting a misuse of statistics and with the result that an incorrect conclusion may be derived from it.
Kindergarten readiness refers to the developmental domains that contribute to children's ability to adapt to the kindergarten classroom, which is often a new and unfamiliar environment. There is no single agreed upon definition of Kindergarten readiness. The domains often included in the definition include, academic skills, social-emotional development, and physical development. In addition to these competencies, the child's environment and opportunities for learning should also be considered. This includes the child's home environment and their interactions with teachers and peers.
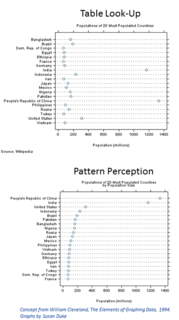
Graphical perception is the human capacity for visually interpreting information on graphs and charts. Both quantitative and qualitative information can be said to be encoded into the image, and the human capacity to interpret it is sometimes called decoding. The importance of human graphical perception, what we discern easily versus what our brains have more difficulty decoding, is fundamental to good statistical graphics design, where clarity, transparency, accuracy and precision in data display and interpretation are essential for understanding the translation of data in a graph to clarify and interpret the science.
Civic statistics is a sub-discipline of statistics focused on the analysis of evidence relevant to understanding and addressing issues of public concern such as human migration, poverty and inequality. It lies at the intersection of politics, social science, statistics, and education.
A fact box is a simplified display format that presents evidence based data about the benefits and harms of medical treatments, screenings or interventions.
References
- ↑ Freedman, E. G., & Shah, P. (2002). Toward a model of knowledge-based graph comprehension. In M. Hegarty, B. Meyer, & N. H. Narayanan (Eds.), Diagrammatic representation and inference (pp. 59–141). Berlin, Germany: Springer
- ↑ Shah, P., & Freedman, E. G. (2011). Bar and line graph comprehension: An interaction of top-down and bottom-up processes. Topics in Cognitive Science, 3, 560–578
- 1 2 3 Galesic, M., & Garcia-Retamero, R. (2011). Graph literacy: A cross-cultural comparison. Medical Decision Making, 31, 444–457
- ↑ Ancker, J. S., Senathirajah, Y., Kukafka, R., & Starren, J. B. (2006). Design features of graphs in health risk communication: A systematic review. Journal of the American Medical Informatics Association, 13, 608–618
- ↑ Garcia-Retamero, R., & Cokely, E. T. (2013). Communicating health risks with visual aids. Current Directions in Psychological Science, 22, 392–399
- ↑ Gaissmaier W, Wegwarth O, Skopec D, Müller A-S, Broschinski S, Politi M: Numbers can be worth a thousand pictures: Individual differences in understanding graphical and numerical representations of health-related information. . Health Psychology 2012, 31(3):286–296
- ↑ Lipkus, I. M. (2007). Numeric, verbal, and visual formats of conveying health risks: Suggested best practices and future recommendations. Medical Decision Making, 27, 696–713
- ↑ Spiegelhalter, D., Pearson, M., & Short, I. (2011). Visualizing uncertainty about the future. Science, 333, 1393−1400
- ↑ Meyer, J., Shinar, D., & Leiser, D. (1997). Multiple Factors that Determine Performance with Tables and Graphs. Human Factors: The Journal of the Human Factors and Ergonomics Society, 39(2), 268–286
- ↑ Okan, Y., Garcia-Retamero, R., Galesic, M., & Cokely, E. T. (2012). When higher bars are not larger quantities: On individual differences in the use of spatial information in graph comprehension. Spatial Cognition & Computation, 12, 1–25
- ↑ Friel, S. N., Curcio, F. R., & Bright, G. W. (2001). Making sense of graphs: Critical factors influencing comprehension and instructional implications. Journal for Research in Mathematics Education, 32, 124–158
- ↑ Kramarski, B., & Mevarech, Z. R. (2003). Enhancing mathematical reasoning in the classroom: The effects of cooperative learning and metacognitive training. American Educational Research Journal, 40, 281–310
- ↑ Schapira, M. M., Walker, C. M., Cappaert, K. J., et al., (2012). The Numeracy Understanding in Medicine Instrument: A Measure of health numeracy developed using Item Response Theory. Medical Decision Making, 32, 851–865