Related Research Articles

In statistics, sampling bias is a bias in which a sample is collected in such a way that some members of the intended population have a lower or higher sampling probability than others. It results in a biased sample of a population in which all individuals, or instances, were not equally likely to have been selected. If this is not accounted for, results can be erroneously attributed to the phenomenon under study rather than to the method of sampling.

Statistics is the discipline that concerns the collection, organization, analysis, interpretation, and presentation of data. In applying statistics to a scientific, industrial, or social problem, it is conventional to begin with a statistical population or a statistical model to be studied. Populations can be diverse groups of people or objects such as "all people living in a country" or "every atom composing a crystal". Statistics deals with every aspect of data, including the planning of data collection in terms of the design of surveys and experiments.

Simpson's paradox is a phenomenon in probability and statistics in which a trend appears in several groups of data but disappears or reverses when the groups are combined. This result is often encountered in social-science and medical-science statistics, and is particularly problematic when frequency data are unduly given causal interpretations. The paradox can be resolved when confounding variables and causal relations are appropriately addressed in the statistical modeling.
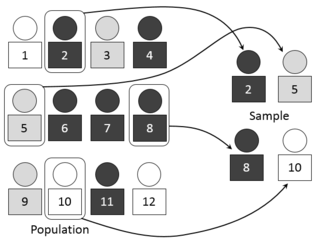
In statistics, quality assurance, and survey methodology, sampling is the selection of a subset or a statistical sample of individuals from within a statistical population to estimate characteristics of the whole population. The subset is meant to reflect the whole population and statisticians attempt to collect samples that are representative of the population. Sampling has lower costs and faster data collection compared to recording data from the entire population, and thus, it can provide insights in cases where it is infeasible to measure an entire population.

Information design is the practice of presenting information in a way that fosters an efficient and effective understanding of the information. The term has come to be used for a specific area of graphic design related to displaying information effectively, rather than just attractively or for artistic expression. Information design is closely related to the field of data visualization and is often taught as part of graphic design courses. The broad applications of information design along with its close connections to other fields of design and communication practices have created some overlap in the definitions of communication design, data visualization, and information architecture.

Edward Rolf Tufte, sometimes known as "ET", is an American statistician and professor emeritus of political science, statistics, and computer science at Yale University. He is noted for his writings on information design and as a pioneer in the field of data visualization.
An opinion poll, often simply referred to as a survey or a poll, is a human research survey of public opinion from a particular sample. Opinion polls are usually designed to represent the opinions of a population by conducting a series of questions and then extrapolating generalities in ratio or within confidence intervals. A person who conducts polls is referred to as a pollster.

Numeracy is the ability to understand, reason with, and apply simple numerical concepts. The charity National Numeracy states: "Numeracy means understanding how mathematics is used in the real world and being able to apply it to make the best possible decisions...It's as much about thinking and reasoning as about 'doing sums'". Basic numeracy skills consist of comprehending fundamental arithmetical operations like addition, subtraction, multiplication, and division. For example, if one can understand simple mathematical equations such as 2 + 2 = 4, then one would be considered to possess at least basic numeric knowledge. Substantial aspects of numeracy also include number sense, operation sense, computation, measurement, geometry, probability and statistics. A numerically literate person can manage and respond to the mathematical demands of life.
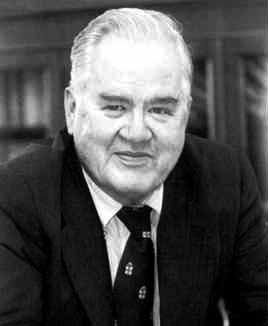
John Wilder Tukey was an American mathematician and statistician, best known for the development of the fast Fourier Transform (FFT) algorithm and box plot. The Tukey range test, the Tukey lambda distribution, the Tukey test of additivity, and the Teichmüller–Tukey lemma all bear his name. He is also credited with coining the term bit and the first published use of the word software.

Chartjunk consists of all visual elements in charts and graphs that are not necessary to comprehend the information represented on the graph, or that distract the viewer from this information.

Infographic are graphic visual representations of information, data, or knowledge intended to present information quickly and clearly. They can improve cognition by using graphics to enhance the human visual system's ability to see patterns and trends. Similar pursuits are information visualization, data visualization, statistical graphics, information design, or information architecture. Infographics have evolved in recent years to be for mass communication, and thus are designed with fewer assumptions about the readers' knowledge base than other types of visualizations. Isotypes are an early example of infographics conveying information quickly and easily to the masses.
Statistics, when used in a misleading fashion, can trick the casual observer into believing something other than what the data shows. That is, a misuse of statistics occurs when a statistical argument asserts a falsehood. In some cases, the misuse may be accidental. In others, it is purposeful and for the gain of the perpetrator. When the statistical reason involved is false or misapplied, this constitutes a statistical fallacy.
This glossary of statistics and probability is a list of definitions of terms and concepts used in the mathematical sciences of statistics and probability, their sub-disciplines, and related fields. For additional related terms, see Glossary of mathematics and Glossary of experimental design.

Data and information visualization is the practice of designing and creating easy-to-communicate and easy-to-understand graphic or visual representations of a large amount of complex quantitative and qualitative data and information with the help of static, dynamic or interactive visual items. Typically based on data and information collected from a certain domain of expertise, these visualizations are intended for a broader audience to help them visually explore and discover, quickly understand, interpret and gain important insights into otherwise difficult-to-identify structures, relationships, correlations, local and global patterns, trends, variations, constancy, clusters, outliers and unusual groupings within data. When intended for the general public to convey a concise version of known, specific information in a clear and engaging manner, it is typically called information graphics.

Innumeracy: Mathematical Illiteracy and its Consequences is a 1988 book by mathematician John Allen Paulos about innumeracy as the mathematical equivalent of illiteracy: incompetence with numbers rather than words. Innumeracy is a problem with many otherwise educated and knowledgeable people. While many people would be ashamed to admit they are illiterate, there is very little shame in admitting innumeracy by saying things like "I'm a people person, not a numbers person", or "I always hated math", but Paulos challenges whether that widespread cultural excusing of innumeracy is truly worthy of acceptability.
Statistical graphics, also known as statistical graphical techniques, are graphics used in the field of statistics for data visualization.
Statistics education is the practice of teaching and learning of statistics, along with the associated scholarly research.
Data literacy is the ability to read, understand, create, and communicate data as information. Much like literacy as a general concept, data literacy focuses on the competencies involved in working with data. It is, however, not similar to the ability to read text since it requires certain skills involving reading and understanding data.
Intuitive statistics, or folk statistics, is the cognitive phenomenon where organisms use data to make generalizations and predictions about the world. This can be a small amount of sample data or training instances, which in turn contribute to inductive inferences about either population-level properties, future data, or both. Inferences can involve revising hypotheses, or beliefs, in light of probabilistic data that inform and motivate future predictions. The informal tendency for cognitive animals to intuitively generate statistical inferences, when formalized with certain axioms of probability theory, constitutes statistics as an academic discipline.

Graphical perception is the human capacity for visually interpreting information on graphs and charts. Both quantitative and qualitative information can be said to be encoded into the image, and the human capacity to interpret it is sometimes called decoding. The importance of human graphical perception, what we discern easily versus what our brains have more difficulty decoding, is fundamental to good statistical graphics design, where clarity, transparency, accuracy and precision in data display and interpretation are essential for understanding the translation of data in a graph to clarify and interpret the science.
References
- ↑ Dodge, Y. (2003) The Oxford Dictionary of Statistical Terms, OUP. ISBN 0-19-920613-9
- 1 2 3 Wallman, Katherine K. (1993). "Enhancing statistical literacy: Enriching our society". Journal of the American Statistical Association. 88 (421): 1–8. doi:10.1080/01621459.1993.10594283. Wallman was president of the American Statistical Association and Chief of Statistical Policy, United States Office of Management and Budget.
- ↑ Gal, I. (2002). Adults’ statistical literacy: Meaning, components, responsibilities (with Discussion). International Statistical Review, 70(1), 1–51.
- ↑ Tractenberg, Rochelle E. (2016-12-24). "How the Mastery Rubric for Statistical Literacy Can Generate Actionable Evidence about Statistical and Quantitative Learning Outcomes". Education Sciences. 7 (1): 3. doi: 10.3390/educsci7010003 .
- ↑ Gerd Gigerenzer et al. (2008) "Helping doctors and patients make sense of health statistics" Psychological Science in the Public Interest8 (2), pp.53-96
- ↑ The International Statistical Literacy Project
- ↑ getstats.org.uk
- ↑ Tufte, Edward R. (1997). Visual explanations : images and quantities, evidence and narrative. Cheshire, Conn.: Graphics Press. ISBN 9780961392123. OCLC 36234417.
- ↑ Tufte, Edward R. (2001). The visual display of quantitative information (2nd ed.). Cheshire, Conn.: Graphics Press. ISBN 9780961392147. OCLC 46932988.
- ↑ Tufte, Edward R. Envisioning information . Graphics Press. Cheshire, Connecticut. ISBN 9780961392116. OCLC 21270160.
- ↑ Heiberger, R.M., Holland, B. (2004) Statistical Analysis and Data Display. Springer. ISBN 0-387-40270-5
- ↑ Tufte, Edward R. (2006). Beautiful evidence. Cheshire, Conn.: Graphics Press. ISBN 9780961392178. OCLC 70203994.
- 1 2 Kahneman, Daniel (2013). Thinking, fast and slow . New York: Farrar, Straus and Giroux. ISBN 9780374533557. The book is about how people actually think, decide and remember (based on psychological experimentation). "Why is it so difficult for us to think statistically? We easily think associatively, we think metaphorically, we think causally, but statistics requires thinking about many things at once, which is something that [intuition] is not designed to do." p 13 "Even statisticians were not good intuitive statisticians." p 5 "The lesson is clear: estimates of causes of death are warped by media coverage. The coverage is biased toward novelty and poignancy." p 138 "When people were favorably disposed toward a technology, they rated it as offering large benefits and imposing little risk; when they disliked a technology, they could think only of its disadvantages, and few advantages came to mind." p 139 "[M]y intuitive thinking is just as prone to overconfidence, extreme predictions, and the planning fallacy as it was before I made a study of these issues. I have improved only my ability to recognize situations in which errors are likely..." p 417
- ↑ Ogburn, William Fielding (1940). "Statistical Trends". Journal of the American Statistical Association. 35 (209b): 252–260. doi:10.1080/01621459.1940.10500563.
- ↑ Huff, Darrell (1993). How to lie with statistics. New York: Norton. ISBN 978-0393310726. First published in 1954.
- ↑ Hopkins, Harry (1973). The numbers game: the bland totalitarianism. Boston: Little, Brown. ISBN 978-0316372701.
- ↑ Paulos, John (1988). Innumeracy : mathematical illiteracy and its consequences . New York: Hill and Wang. ISBN 0-8090-7447-8.
- ↑ Seife, Charles (2011). Proofiness : how you're being fooled by the numbers. New York: Penguin. ISBN 9780143120070.