The economy of Bhutan is based on agriculture and forestry, which provide the main livelihood for more than 60% of the population. Agriculture consists largely of subsistence farming and animal husbandry. Rugged mountains dominate the terrain and make the building of roads and other infrastructure difficult. Bhutan is among the richest by gross domestic product (nominal) per capita in South Asia, at $3,491 as of 2022, but it still places 153rd, and among the poorest in the world. The total gross domestic product is only $2,653 million, and 178th according to IMF.

The economy of Brunei, a small and wealthy country, is a mixture of foreign and domestic entrepreneurship, government regulation and welfare measures, and village traditions. It is almost entirely supported by exports of crude oil and natural gas, with revenues from the petroleum sector accounting for over half of GDP. Per capita GDP is high, and substantial income from overseas investment supplements income from domestic production. The government provides for all medical services and subsidizes food and housing. The government has shown progress in its basic policy of diversifying the economy away from oil and gas. Brunei's leaders are concerned that steadily increased integration in the world economy will undermine internal social cohesion although it has taken steps to become a more prominent player by serving as chairman for the 2000 APEC forum. Growth in 1999 was estimated at 2.5% due to higher oil prices in the second half.

The economy of the Central African Republic is $2.321 billion by gross domestic product as of 2019, with an estimated annual per capita income of just $805 as measured by purchasing power parity in 2019.

The economy of Costa Rica has been very stable for some years now, with continuing growth in the GDP and moderate inflation, though with a high unemployment rate: 11.49% in 2019. Costa Rica's economy emerged from recession in 1997 and has shown strong aggregate growth since then. The estimated GDP for 2023 is US$90 billion, up significantly from the US$52.6 billion in 2015 while the estimated 2023 per capita is US$28,030.

The economy of Kyrgyzstan is heavily dependent on the agricultural sector. Cotton, tobacco, wool, and meat are the main agricultural products, although only tobacco and cotton are exported in any quantity. According to Healy Consultants, Kyrgyzstan's economy relies heavily on the strength of industrial exports, with plentiful reserves of gold, mercury and uranium. The economy also relies heavily on remittances from foreign workers. Following independence, Kyrgyzstan was progressive in carrying out market reforms, such as an improved regulatory system and land reform. In 1998, Kyrgyzstan was the first Commonwealth of Independent States (CIS) country to be accepted into the World Trade Organization. Much of the government's stock in enterprises has been sold. Kyrgyzstan's economic performance has been hindered by widespread corruption, low foreign investment and general regional instability. Despite those issues, Kyrgyzstan is ranked 70th on the ease of doing business index.

The economy of Malawi is $7.522 billion by gross domestic product as of 2019, and is predominantly agricultural, with about 80% of the population living in rural areas. The landlocked country in south central Africa ranks among the world's least developed countries. In 2017, agriculture accounted for about one-third of GDP and about 80% of export revenue. The economy depends on substantial inflows of economic assistance from the IMF, the World Bank, and individual donor nations. The government faces strong challenges: to spur exports, to improve educational and health facilities, to face up to environmental problems of deforestation and erosion, and to deal with the problem of HIV/AIDS in Africa. Malawi is a least developed country according to United Nations.

In ancient times, Maldives were renowned for cowries, coir rope, dried tuna fish, ambergris (maavaharu) and coco de mer (tavakkaashi). Local and foreign trading ships used to load these products in the Maldives and bring them abroad.

The economy of Nicaragua is focused primarily on the agricultural sector. Nicaragua itself is the least developed country in Central America, and the second poorest in the Americas by nominal GDP. In recent years, under the administrations of Daniel Ortega, the Nicaraguan economy has expanded somewhat, following the Great Recession, when the country's economy actually contracted by 1.5%, due to decreased export demand in the American and Central American markets, lower commodity prices for key agricultural exports, and low remittance growth. The economy saw 4.5% growth in 2010 thanks to a recovery in export demand and growth in its tourism industry. Nicaragua's economy continues to post growth, with preliminary indicators showing the Nicaraguan economy growing an additional 5% in 2011. Consumer Price inflation have also curtailed since 2008, when Nicaragua's inflation rate hovered at 19.82%. In 2009 and 2010, the country posted lower inflation rates, 3.68% and 5.45%, respectively. Remittances are a major source of income, equivalent to 15% of the country's GDP, which originate primarily from Costa Rica, the United States, and European Union member states. Approximately one million Nicaraguans contribute to the remittance sector of the economy.

Once a single-crop agricultural economy, Saint Lucia has shifted to a tourism and banking serviced-based economy. Tourism, the island's biggest industry and main source of jobs, income and foreign exchange, accounts for 65% of its GDP. Agriculture, which was once the biggest industry, now contributes to less than 3% of GDP, but still accounts for 20% of jobs. The banana industry is now on a decline due to strong competition from low-cost Latin American producers and reduced European trade preferences, but the government has helped revitalize the industry, with 13,734 tonnes exported in 2018. Agricultural crops grown for export are bananas, mangoes, and avocados. The island is considered to have the most diverse and well-developed manufacturing industry in the eastern Caribbean.

The economy of Seychelles is based on fishing, tourism, processing of coconuts and vanilla, coir rope, boat building, printing, furniture and beverages. Agricultural products include cinnamon, sweet potatoes, cassava (tapioca), bananas, poultry and tuna.

The economy of Slovenia is a developed economy, and the country enjoys a high level of prosperity and stability as well as above-average GDP per capita by purchasing power parity at 92% of the EU average in 2022. The nominal GDP in 2023 is 68.108 billion USD, nominal GDP per capita (GDP/pc) in 2023 is USD 32,350. The highest GDP/pc is in central Slovenia, where the capital city Ljubljana is located. It is part of the Western Slovenia statistical region, which has a higher GDP/pc than eastern Slovenia.

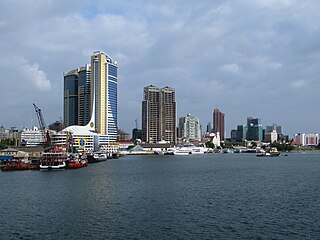
The economy of Tanzania is a lower-middle income economy that is overwhelmingly dependent on agriculture. Tanzania's economy has been transitioning from a planned economy to a market economy since 1985. Although total GDP has increased since these reforms began, GDP per capita dropped sharply at first, and only exceeded the pre-transition figure in around 2007.

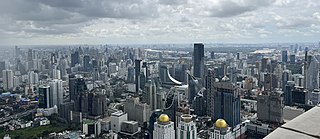
The economy of Thailand is dependent on exports, which accounted in 2021 for about 58 per cent of the country's gross domestic product (GDP). Thailand itself is a newly industrialized country, with a GDP of 17.367 trillion baht (US$495 billion) in 2022, the 9th largest economy in Asia. As of 2018, Thailand has an average inflation of 1.06% and an account surplus of 7.5% of the country's GDP. Its currency, the Thai Baht, ranked as the tenth most frequently used world payment currency in 2017.

The economy of Guyana is one of the fastest growing in the world with a gross domestic product (GDP) growth of 19.9% in 2021. In 2023, Guyana had a per capita gross domestic product of Int$60,648 and an average GDP growth of 4.2% over the previous decade. Guyana's economy was transformed in 2015 with the discovery of an offshore oil field in the country’s waters about 190 km from Georgetown, making the first commercial-grade crude oil draw in December 2019, sending it abroad for refining.

The economy of the Gambia is heavily reliant on agriculture. The Gambia has no significant mineral or other natural resources, and has a limited agricultural base. About 75% of the population depends on crops and livestock for its livelihood. Small-scale manufacturing activity features the processing of peanuts, fish, and animal hides.

The economy of Algeria deals with Algeria's current and structural economic situation. Since independence in 1962, Algeria has launched major economic projects to build up a dense industrial base. However, despite these major achievements, the Algerian economy has gone through various stages of turbulence.


