List of Canadian provinces and territories by gross domestic product

Last updated

Map of the Canadian provinces and territories by GDP in millions of Canadian dollars in 2021.
.mw-parser-output figure[typeof="mw:File/Thumb"] .image-key>ol{margin-left:1.3em;margin-top:0}.mw-parser-output figure[typeof="mw:File/Thumb"] .image-key>ul{margin-top:0}.mw-parser-output figure[typeof="mw:File/Thumb"] .image-key li{page-break-inside:avoid;break-inside:avoid-column}@media(min-width:300px){.mw-parser-output figure[typeof="mw:File/Thumb"] .image-key,.mw-parser-output figure[typeof="mw:File/Thumb"] .image-key-wide{column-count:2}.mw-parser-output figure[typeof="mw:File/Thumb"] .image-key-narrow{column-count:1}}@media(min-width:450px){.mw-parser-output figure[typeof="mw:File/Thumb"] .image-key-wide{column-count:3}}
.mw-parser-output .plainlist ol,.mw-parser-output .plainlist ul{line-height:inherit;list-style:none;margin:0;padding:0}.mw-parser-output .plainlist ol li,.mw-parser-output .plainlist ul li{margin-bottom:0}
.mw-parser-output .legend{page-break-inside:avoid;break-inside:avoid-column}.mw-parser-output .legend-color{display:inline-block;min-width:1.25em;height:1.25em;line-height:1.25;margin:1px 0;text-align:center;border:1px solid black;background-color:transparent;color:black}.mw-parser-output .legend-text{}
> 900,000
> 500,000
> 300,000
> 70,000
> 30,000
< 10,000 Canadian provinces and territories by GDP (2021).svg
Map of the Canadian provinces and territories by GDP in millions of Canadian dollars in 2021.
  •   > 900,000
  •   > 500,000
  •   > 300,000
  •   > 70,000
  •   > 30,000
  •   < 10,000

This article lists Canadian provinces and territories by gross domestic product (GDP).

Contents

While Canada's ten provinces and three territories exhibit high per capita GDPs, there is wide variation among them. Ontario, the country's most populous province, is a major manufacturing and trade hub with extensive linkages to the northeastern and midwestern United States. The economies of Alberta, Saskatchewan, Newfoundland and Labrador and the territories rely heavily on natural resources. On the other hand, Manitoba, Quebec and The Maritimes have the country's lowest per capita GDP values.

In the face of these long-term regional disparities, the Government of Canada redistributes some of its revenues through unconditional equalization payments and finances the delivery of comparable levels of government services through the Canada Health Transfer and the Canada Social Transfer.

GDP and per capita GDP, 2022

A table listing total GDP (expenditure-based), share of Canadian GDP, population, and per capita GDP in 2022. For illustrative purposes, market income (total income less government transfers) [1] per capita from tax returns is included. (The per capita, rather than per tax filer, measure is chosen for comparability with GDP per capita.)

Province
or
territory
GDP
(million
CAD, 2022)
Share of
national GDP
(%, 2022)
Population
(July 1, 2022)
GDP
per capita
(CAD, 2022)
Market
income
per capita
(CAD, 2021)
Flag of Canada (Pantone).svg  Canada 2,813,289100.0038,939,05672,24937,473
Flag of Alberta.svg  Alberta 459,28816.334,510,891101,81840,385
Flag of British Columbia.svg  British Columbia 395,21514.055,356,28473,78539,773
Flag of Manitoba.svg  Manitoba 86,5313.081,413,40961,22131,711
Flag of Newfoundland and Labrador.svg  Newfoundland and Labrador 40,7201.45531,58376,60132,309
Flag of New Brunswick.svg  New Brunswick 44,5011.58809,56854,96930,125
Flag of the Northwest Territories.svg  Northwest Territories 5,5740.2044,685124,74046,058
Flag of Nova Scotia.svg  Nova Scotia 54,3831.931,025,44553,03432,252
Flag of Nunavut.svg  Nunavut 4,7530.1740,485117,40227,303
Flag of Ontario.svg  Ontario 1,048,25837.2615,145,00669,21538,979
Flag of Prince Edward Island.svg  Prince Edward Island 9,3760.33167,18856,08131,152
Flag of Quebec.svg  Quebec 545,59419.398,672,18562,91335,171
Flag of Saskatchewan.svg  Saskatchewan 114,4124.071,178,42297,08933,835
Flag of Yukon.svg  Yukon 3,9300.1443,90589,51146,020

Source: Statistics Canada: GDP (totals), [2] Population, [3] Total income and government transfers, [4] Population covered by income data [5]

International comparisons, 2022

In the table below, the figures from the previous table are converted to United States dollars using the ratio of the International Monetary Fund's estimate for Canada's GDP by purchasing power parity (PPP) to Canada's nominal GDP. [6] The per capita GDP PPP for the relevant year of other advanced economies with a population of at least 15 million according to the International Monetary Fund is provided as comparison.

(Note that because the same conversion rate is used for all of Canada, this method overstates the GDP PPP of provinces and territories with high price levels, and understates the GDP PPP of provinces and territories with low price levels.)

Province
or
territory
GDP PPP
(million
Int$, 2022)
GDP
per capita PPP
(Int$, 2022)
Flag of Canada (Pantone).svg  Canada 2,278,24458,508
Flag of Ontario.svg  Ontario 848,89556,051
Flag of Quebec.svg  Quebec 441,83050,948
Flag of Alberta.svg  Alberta 371,93882,453
Flag of British Columbia.svg  British Columbia 320,05159,752
Flag of Saskatchewan.svg  Saskatchewan 92,65378,624
Flag of Manitoba.svg  Manitoba 70,07449,578
Flag of Nova Scotia.svg  Nova Scotia 44,04042,947
Flag of New Brunswick.svg  New Brunswick 36,03844,515
Flag of Newfoundland and Labrador.svg  Newfoundland and Labrador 32,97662,033
Flag of Prince Edward Island.svg  Prince Edward Island 7,59345,415
Flag of the Northwest Territories.svg  Northwest Territories 4,514101,016
Flag of Nunavut.svg  Nunavut 3,84995,074
Flag of Yukon.svg  Yukon 3,18372,488
Flag of Australia (converted).svg  Australia 61,956
Flag of France.svg  France 56,255
Flag of Germany.svg  Germany 64,031
Flag of Italy.svg  Italy 52,559
Flag of Japan.svg  Japan 49,211
Flag of South Korea.svg  South Korea 53,760
Flag of the Netherlands.svg  Netherlands 70,667
Flag of Spain.svg  Spain 47,670
Flag of the Republic of China.svg  Taiwan 69,243
Flag of the United Kingdom.svg  United Kingdom 55,661
Flag of the United States (23px).png  United States 77,192

Source: International Monetary Fund [7]

Real GDP at basic prices, 2014–2018

A table listing annual GDP at basic prices from 2014 through 2018 in chained 2012 dollars. Caution: GDP at basic prices differs from GDP in the treatment of taxes and subsidies. [8]

Province
or
territory
GDP
(million
chained (2012)
CAD, 2014)
GDP
(million
chained (2012)
CAD, 2015)
GDP
(million
chained (2012)
CAD, 2016)
GDP
(million
chained (2012)
CAD, 2017)
GDP
(million
chained (2012)
CAD, 2018)
British Columbia 219,060.9224,153.4231,509.9240,657.9246,506.3
Alberta 338,262.6326,476.7313,241.5327,596.2335,095.6
Saskatchewan 80,175.779,574.279,364.481,179.082,502.7
Manitoba 58,276.359,082.560,066.261,941.262,723.1
Ontario 659,861.2677,384.0693,900.4712,984.3728,363.7
Quebec 338,319.0341,688.0346,713.7356,677.9365,614.4
New Brunswick 29,039.629,275.729,686.330,271.830,295.3
Prince Edward Island 5,205.65,280.75,372.25,553.35,700.0
Nova Scotia 34,747.235,013.435,549.336,075.436,518.2
Newfoundland and Labrador 31,143.330,806.031,334.531,610.630,757.9
Yukon 2,510.92,320.22,482.52,554.52,626.1
Northwest Territories 4,574.64,621.34,679.84,861.34,954.7
Nunavut 2,363.62,353.02,434.32,685.32,955.0

Source: Statistics Canada [9]

Components of GDP, 2022

A table of Canadian provinces and territories by descending GDP (at current prices and expenditure-based); all figures are from Statistics Canada. [10]

Province
or
territory
GDP
(million
CAD, 2022)
= Final
consumption
expenditure
+ Gross
capital
formation
+ Investment
in
Inventories
+ Exports− Imports
Canada 2,813,2892,095,366655,21758,3431,479,8341,476,141
British Columbia 395,215303,857107,6408,666162,910187,951
Alberta 459,288248,988104,1393,932313,150211,024
Saskatchewan 114,41264,77621,1694,76182,79359,107
Manitoba 86,53175,82316,8761,25045,97453,391
Ontario 1,048,258806,682243,64123,684531,292557,299
Quebec 545,594440,988124,55913,604254,954288,681
New Brunswick 44,50143,5728,7621,19933,21642,259
Prince Edward Island 9,3768,9602,1102544,3796,325
Nova Scotia 54,38358,08213,26119619,78636,951
Newfoundland and Labrador 40,72029,2109,42445223,52521,896
Yukon 3,9304,0041,234−1121,1802,377
Northwest Territories 5,5745,1641,1182213,5504,481
Nunavut 4,7533,4971,2662363,1213,371

Figures may not add up precisely due to omission of the statistical discrepancy column and the "Outside Canada" row.

Census metropolitan areas (CMA) by GDP

This is a list of Canadian metropolitan areas by their gross domestic product (GDP) according to data by Statistics Canada. [11]

Rank Census metropolitan areas GDP
(million
CAD, 2019
1 Toronto (Census Metropolitan Area) 442,180
2 Montreal (Census Metropolitan Area) 233,996
3 Vancouver (Census Metropolitan Area) 163,475
4 Calgary (Census Metropolitan Area) 111,259
5 Edmonton (Census Metropolitan Area) 91,568
6 Ottawa–Gatineau (Census Metropolitan Area) 88,664
7 Quebec (Census Metropolitan Area) 48,544
8 Winnipeg (Census Metropolitan Area) 46,301
9 Hamilton (Census Metropolitan Area) 37,578
10 Tri-Cities (Census Metropolitan Area) 33,538
11 London (Census Metropolitan Area) 28,750
12 Halifax (Census Metropolitan Area) 24,098
13 Victoria (Census Metropolitan Area) 22,758
14 Saskatoon (Census Metropolitan Area) 20,691
15 Regina (Census Metropolitan Area) 18,460
16 St. Catharines – Niagara (Census Metropolitan Area) 17,272
17 Windsor (Census Metropolitan Area) 16,359
18 Oshawa (Census Metropolitan Area) 14,056
19 St. John's (Census Metropolitan Area) 13,272
20 Kelowna (Census Metropolitan Area) 10,911
21 Guelph (Census Metropolitan Area) 10,503
22 Sudbury (Census Metropolitan Area) 10,142
23 Sherbrooke (Census Metropolitan Area) 9,761
24 Kingston (Census Metropolitan Area) 9,409
25 Barrie (Census Metropolitan Area) 8,468
26 Saguenay (Census Metropolitan Area) 8,364
27 Moncton (Census Metropolitan Area) 8,149
28 Abbotsford – Mission (Census Metropolitan Area) 8,148
29 Trois-Rivières (Census Metropolitan Area) 6,823
30 Lethbridge (Census Metropolitan Area) 6,743
31 Thunder Bay (Census Metropolitan Area) 6,554
32 Saint John (Census Metropolitan Area) 6,521
33 Brantford (Census Metropolitan Area) 5,984
34 Belleville (Census Metropolitan Area) 5,280
35 Peterborough (Census Metropolitan Area) 5,163

See also

Notes

  1. Canada, Government of Canada, Statistics (3 May 2017). "Dictionary, Census of Population, 2016 – Market income". www12.statcan.gc.ca. Retrieved 2019-11-07.{{cite web}}: CS1 maint: multiple names: authors list (link)
  2. Canada, Government of Canada, Statistics (8 November 2023). "Gross domestic product, expenditure-based, provincial and territorial, annual". www150.statcan.gc.ca. Retrieved 2023-11-08.{{cite web}}: CS1 maint: multiple names: authors list (link)
  3. Canada, Government of Canada, Statistics (27 September 2023). "Population estimates, quarterly". www150.statcan.gc.ca. Retrieved 2023-11-08.{{cite web}}: CS1 maint: multiple names: authors list (link)
  4. Canada, Government of Canada, Statistics. "Tax filers and dependants with income by source of income". www150.statcan.gc.ca. Retrieved 2023-07-12.{{cite web}}: CS1 maint: multiple names: authors list (link)
  5. Canada, Government of Canada, Statistics. "Selected characteristics of tax filers and dependants, income and demographics (final T1 Family File)". www150.statcan.gc.ca. Retrieved 2023-07-12.{{cite web}}: CS1 maint: multiple names: authors list (link)
  6. "World Economic Outlook Database, April 2024". www.imf.org. Retrieved 2024-04-16.
  7. "World Economic Outlook Database, April 2024". www.imf.org. Retrieved 2024-04-16.
  8. "Glossary". www150.statcan.gc.ca. 30 May 2017. Retrieved 2019-11-07.
  9. "Gross domestic product (GDP) at basic prices, by industry, provinces and territories (x 1,000,000)". Government of Canada, Statistics. September 7, 2019. Retrieved September 7, 2019.
  10. "Table 36-10-0222-01 – Gross domestic product, expenditure-based, provincial and territorial, annual (dollars unless otherwise noted), CANSIM (database)". Statistics Canada. 2023-11-08.
  11. "Statistics Canada. Table 36-10-0468-01 Gross domestic product (GDP) at basic prices, by census metropolitan area (CMA) (x 1,000,000)". Statistics Canada. May 17, 2023. Archived from the original on January 22, 2021. Retrieved June 13, 2020.

Related Research Articles

<span class="mw-page-title-main">Economy of Canada</span>

The economy of Canada is a highly developed mixed economy, with the world's tenth-largest economy as of 2023, and a nominal GDP of approximately US$2.117 trillion. Canada is one of the world's largest trading nations, with a highly globalized economy. In 2021, Canadian trade in goods and services reached $2.016 trillion. Canada's exports totalled over $637 billion, while its imported goods were worth over $631 billion, of which approximately $391 billion originated from the United States. In 2018, Canada had a trade deficit in goods of $22 billion and a trade deficit in services of $25 billion. The Toronto Stock Exchange is the tenth-largest stock exchange in the world by market capitalization, listing over 1,500 companies with a combined market capitalization of over US$3 trillion.

<span class="mw-page-title-main">Gross domestic product</span> Market value of goods and services produced within a country

Gross domestic product (GDP) is a monetary measure of the market value of all the final goods and services produced and rendered in a specific time period by a country or countries. GDP is more often used by the government of a single country to measure its economic health. Due to its complex and subjective nature, this measure is often revised before being considered a reliable indicator.

In economics, the GDP deflator is a measure of the money price of all new, domestically produced, final goods and services in an economy in a year relative to the real value of them. It can be used as a measure of the value of money. GDP stands for gross domestic product, the total monetary value of all final goods and services produced within the territory of a country over a particular period of time.

The economies of Canada and the United States are similar because both are developed countries. While both countries feature in the top ten economies in the world in 2022, the U.S. is the largest economy in the world, with US$24.8 trillion, with Canada ranking ninth at US$2.2 trillion.

<span class="mw-page-title-main">Greater Montreal</span> Metropolitan area in Quebec, Canada

Greater Montreal is the most populous metropolitan area in Quebec and the second most populous in Canada after Greater Toronto. In 2015, Statistics Canada identified Montreal's Census Metropolitan Area (CMA) as 4,258.31 square kilometres (1,644.14 sq mi) with a population of 4,027,100, almost half that of the province.

<span class="mw-page-title-main">Demographics of Ontario</span>

Ontario, one of the 13 provinces and territories of Canada, is located in east-central Canada. It is Canada's most populous province by a large margin, accounting for nearly 40 percent of all Canadians, and is the second-largest province in total area. Ontario is fourth-largest in total area when the territories of the Northwest Territories and Nunavut are included. It is home to the nation's capital city, Ottawa, and the nation's most populous city, Toronto.

<span class="mw-page-title-main">Demographics of Alberta</span>

Alberta has experienced a relatively high rate of growth in recent years, due in large part to its economy. Between 2003 and 2004, the province saw high birthrates, relatively high immigration, and a high rate of interprovincial migration when compared to other provinces. Approximately 81% of the population live in urban areas and only about 19% live in rural areas. The Calgary–Edmonton Corridor is the most urbanized area in Alberta and is one of Canada's four most urban regions. Many of Alberta's cities and towns have also experienced high rates of growth in recent history. From a population of 73,022 in 1901, Alberta has grown to 4,262,635 in 2021 and in the process has gone from less than 1.5% of Canada's population to 11.5%. It is the fourth most populated province in Canada. Between the 2016 and 2021 censuses, the Alberta population grew by 4.8%.
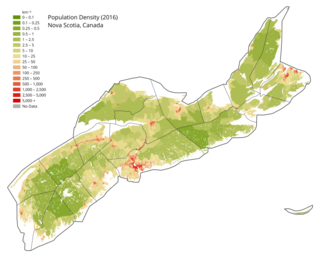
<span class="mw-page-title-main">Demographics of Nova Scotia</span> Demographics of region

Nova Scotia is a Canadian province located on the country's southeastern coast. It is the most populous province in Atlantic Canada, and its capital, Halifax, is a major economic centre of the region. Geographically, Nova Scotia is the second smallest province in Canada, with an area of 52,824.71 km2 (20,395.73 sq mi). As of 2021, it has a population of 969,383 people.

Income in India discusses the financial state in India. With rising economic growth and prosperity, India's income is also rising rapidly. As an overview, India's per capita net national income or NNI was around Rs. 98,374 in 2022-23. The per-capita income is a crude indicator of the prosperity of a country. In contrast, the gross national income at constant prices stood at over 128 trillion rupees. The same year, GRI growth rate at constant prices was around 6.6 percent. While GNI and NNI are both indicators for a country's economic performance and welfare, the GNI is related to the GDP or the Gross Domestic Product plus the net receipts from abroad, including wages and salaries, property income, net taxes and subsidies receivable from abroad. On the other hand, the NNI of a country is equal to its GNI net of depreciation.

In Canada, the federal government makes equalization payments to provincial governments of lesser fiscal capacity so that "reasonably comparable" levels of public services can be provided at similar levels of taxation. Equalization payments are entrenched in the Constitution Act of 1982, subsection 36(2).

<span class="mw-page-title-main">Saskatoon metropolitan area</span> Metropolitan area in Saskatchewan, Canada

The Saskatoon region is the greater metropolitan area of Saskatoon, Saskatchewan. As of 2021 the Statistics Canada estimates the region's population to be 317,480 people.

The demographics of Winnipeg reveal the city to be a typically Canadian one: multicultural and multilingual. Winnipeg is also prominent in the size and ratio of its First Nations population, which plays an important part in the city's makeup. About 12.4% of Winnipeggers are of Indigenous descent, which vastly exceeds the national average of 5.0%.

References